适用于MetaTrader 5的技术指标 - 59
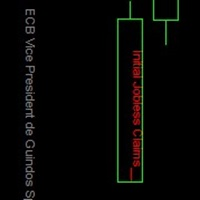
This is one of the most powerful indicators I've ever made.
I was tired of looking at other windows/websites for economical news, and regularly something would happen without me realising.
So I made this indicator which displays all news at the exact time of arrival, directly on the charts!
Now you too can just focus on the charts and know that you won't miss any news events.
There are options:
1. You can choose to display on the price line, or at the bottom of the chart. 2. You can
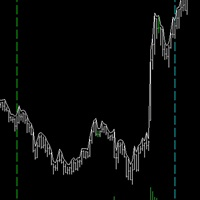
This is one of my most important indicators. Did you ever miss the session open/close? I did, which is why I made this indicator. It took a long time to get this right, since depending on your platform and timezone, it can be incorrect. It should be accurate for everyone now. It takes into account Daylight savings for NY and EU timezones, and should just work like magic on your charts.
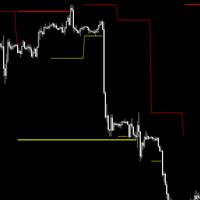
## Check screenshots to see proof that this indictor is a must! ##
Do you hate having to have a Monthly, Weekly, Daily chart when looking at your lower timeframes? I hated it too, so I made this. It will show you the High and Low of other timeframes on your chart, so you will always be aware where some support/resistance may be! Even on the 1 minute chart!
I recommend you use it 3 times, one with Day, Week and Month selected with different line widths.
I use this on every chart I look at

The Boom300 Spike Indicator is a powerful tool designed to identify significant price spikes in the market.
Key Features: Real-time Spike Detection: The indicator continuously scans the market for sudden spikes in price action, providing timely alerts when significant spikes occur. Customizable Alerts: Traders can customize alerts to suit their preferences, including audible alerts, email notifications, and push notifications to mobile devices. User-Friendly Interface: The indicator offers a

Description: The Spike Sniper Crash Market Indicator is a sophisticated tool designed to identify and navigate volatile market conditions, often associated with sudden price spikes and market crashes. Leveraging advanced algorithms and technical analysis, this indicator serves as a vigilant guardian, alerting traders to potential market disruptions and providing actionable insights to mitigate risks and capitalize on opportunities. Key Features: Precision Spike Detection: The indicator employs c

The indicator determines the ATR value (points) in a classic way (taking into calculation paranormal bars/candles) and more correctly - ignoring paranormal movements of the Instrument. Correctly it is excluding paranormal bars from the calculation, extremely small bars (less than 5%( customizable ) of the standard ATR) and extremely large bars (more than 150% ( customizable ) of the standard ATR) are ignored. This is a Extended version - allows you to set calculation parameters a
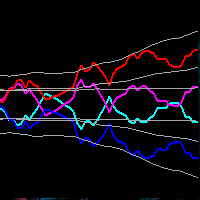
This indicator obeys the popular maxim that: "THE TREND IS YOUR FRIEND" Channel indicators incorporate volatility to capture price action. The Bollinger Bands is widely used, however, there are other options to capture swing action opportunities. Each study you will find here is unique, and reveals different types of price action.
https://www.mql5.com/en/market/product/116256
https://www.mql5.com/en/market/product/115553

MultiFractal Levels MultiFractal Levels – 這是經過修改的 Bill Williams 分形指標,增加了等級。 分形是根據設定中允許的所有 TF 建構的。
水平僅基於尚未經過價格測試的最新分形構建。 與原廠終端指示器相比的優點: 方便 能見度 資訊性 最新等級 可自訂的分形 可自訂的級別 此指標很方便,因為您在工作時無需切換到不同的時間範圍。
可見度 - 在一張圖表中,您可以看到從小到中、大市場走勢的圖表結構。
資訊內容-從視覺上我們獲得更多有關圖形的資訊。
自訂分形可以從兩側進行更改:可以在設定中指定左側和右側的條形數量。
可變更可自訂的水平:根據極值繪製,或根據訊號陰影(中央蠟燭)繪製為區域。 因此,如果舊 TF 的分形具有較大的陰影,則當前 TF 上的符號將很大。
現在,所有基於或基於多重分形指標的交易策略都將具有附加訊號。 此外,分形可以充當支撐位和阻力位。 並且在一些交易策略中,顯示流動性水準。 為此,引入了層次。
使用多重分形水平指標作為您交易系統的補充
也試試我在市面上的其他產品 https://ww

This is the MT5 version of Ku-Chart.
This is an indicator devised by Ku-chan, a famous Japanese trader, based on the dealings of Lehman Brothers' discretionary traders. Unify the measuring stick of currencies to display the true value of currencies.
Although it is an indicator, it does not use a buffer and is displayed using objects such as trend lines. Also, instead of drawing on the subchart, it is drawn in an area far above the current price of the main chart, so you can switch from the

Introduction
The "Smart Money Concept" transcends the realm of mere technical trading strategies to embody a comprehensive philosophy on the dynamics of market operations. It posits that key market participants engage in price manipulation, thereby complicating the trading landscape for smaller, retail traders.
Under this doctrine, retail traders are advised to tailor their strategies in alignment with the maneuvers of "Smart Money" - essentially, the capital operated by market makers

Introducing our state-of-the-art Wave Indicator, meticulously designed for the discerning traders of the MQL5 community! At the core of this innovative tool lies an unmatched sensitivity to capture even the slightest market movements. Our Wave Indicator serves as the foundational element for constructing comprehensive trading strategies, providing you with an unwavering edge in the dynamic world of finance. Whether you're aiming to refine short-term tactics or develop long-term systems, this ind
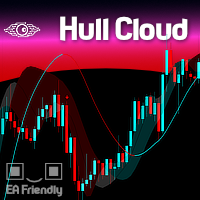
The Hull Moving Average is known for its ability to reduce lag and provide a clearer, more accurate depiction of market trends. By smoothing price data more effectively than traditional moving averages, it helps traders identify trend directions and reversals with greater precision. The Hull Cloud indicator elevates this by using four Hull Moving Averages working together like an orchestra. This combination creates a dynamic system that highlights short, medium, and long-term trends, giving trad
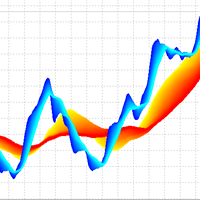
3D Trend Indicator is a non-repaint indicator using multiple moving averages with a 3D surface view. By using this indicator, you can remove uncertainties that can happen using a single and fixed moving average period. You can use a cloud area using a range of moving average periods. Also a wide range of visual settings are added to this indicator to have a better view from the cloud area. Alert and notification system added to the indicator to inform the trader about the action of candles on t
Apresentamos o Indicador de novo grafico - uma ferramenta poderosa para traders que buscam uma análise de preço suave e clara. Este indicador inovador calcula a média simples dos preços, oferecendo uma visão precisa e ajustada dos movimentos do mercado. Como Funciona : O Indicador de Média de Preços Simples (SMA) utiliza uma fórmula simples e eficaz: Ele soma o valor do último preço com o preço anterior. Em seguida, divide essa soma por 2 para obter a média. Fórmula : SMA = U ˊ ltimo Pre c ¸ o +
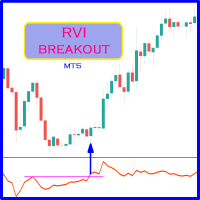
Probability emerges to record higher prices when oscillator breaks out oscillator historical resistance level when exhibit overbought values. It's strongly encouraged to confirm price breakout with oscillator breakout since they have comparable effects to price breaking support and resistance levels; short trades will undoubtedly result in the same outcome. Furthermore , divergence is confirmed in case of absence of continuation signal prior to highest high or lower low when reversal signal
FREE

Probability emerges to record higher prices when oscillator breaks out oscillator historical resistance level when exhibit overbought values. It's strongly encouraged to confirm price breakout with oscillator breakout since they have comparable effects to price breaking support and resistance levels; short trades will undoubtedly result in the same outcome. Furthermore, divergence is confirmed in case of absence of continuation signal prior to highest high or lower low when reversal signal is e
FREE

MinMax Levels MinMax Levels – 是重要交易時段(日、週和月)的最高、最低和開盤價格水準的指標。
每個外匯市場參與者都在其交易系統中使用等級。 它們可以是進行交易的主要訊號,也可以是作為分析工具的附加訊號。 在該指標中,選擇日、週和月作為重要時段,因為它們是大型市場參與者的關鍵交易時段。 如您所知,價格從一個水平移動到另一個水平,了解相對於重要水平的價格位置有助於做出交易決策。 為了方便起見,新增了按鈕來啟用和停用這兩個等級本身,並折疊按鈕以釋放價格圖表工作視窗中的空間。
每個外匯市場參與者都在其交易系統中使用等級。 它們可以是進行交易的主要訊號,也可以是作為分析工具的附加訊號。 在該指標中,選擇日、週和月作為重要時段,因為它們是大型市場參與者的關鍵交易時段。 如您所知,價格從一個水平移動到另一個水平,了解相對於重要水平的價格位置有助於做出交易決策。 為了方便起見,新增了按鈕來啟用和停用這兩個等級本身,並折疊按鈕以釋放價格圖表工作視窗中的空間。
此指標的優點: 方便 能見度 資訊內容 最新等級 可自訂的級別 此指標很方便,因為您

Description of the Indicator The indicator "BullsBearsPulse" is designed for MetaTrader 5 and provides a visual representation of the Bulls Power and Bears Power indicators. These indicators are useful tools for technical analysis, particularly for the EUR/USD currency pair, to help traders identify potential trading opportunities. Functionality Bulls Power : This indicator measures the strength of the bulls (buyers) in the market. It calculates the difference between the highest price and a 20

The Engulf Seeker indicator is a powerful tool designed to detect engulfing candlestick patterns with precision and reliability. Built on advanced logic and customizable parameters, it offers traders valuable insights into market trends and potential reversal points.
Key Features and Benefits: Utilizes revised logic to analyze previous candles and identify strong bullish and bearish engulfing patterns. Convenient arrow-based alert system notifies traders of pattern occurrences on specific symb

This spread indicator displays the actual spread of each candle. It highlights the maximum spread and the minimum spread of the chosen symbol. This indicator is very helpful to see in real time the spread evolution helping to avoid taking a trade when the spread is too high.
Inputs:
Print value in Points: if true displays the spread as a whole number
D isplay minimum and maximum spread of the past N days: select the number of days to consider the maximum and minimum spread
Automatically
===>此指标有什么作用? 他只能在时间范围内选择一个平均SMA
您将此指标放在图形上,因为您需要平均。
选择平均水平的参数和特征,仅此而已!!! ****请参阅屏幕截图01至02
请不要犹豫,要求我提供ICUSTOM代码,以轻松将此平均值集成到您自己的代码,另一个指标或EA中
选择 目标时间范围 期间数 滞后 所需的OHLC 时尚颜色 您可以在代码库和现在以“ William210”的名义找到我的所有出版物。
===>一些示例 这里有一些简单的示例,可以使用多个时间范围的移动平均
比特币上的示例 添加2个移动平均值20,每天在时间范围内,在H6上添加1个,然后在H1中查看 ****请参阅3到5的屏幕截图
S&P500的示例 在每日添加3个移动平均时间为20个时期 ****请参阅6到7的屏幕截图
黄金的例子 每天在每天添加2个移动平均值50和20个时期,然后查看H1 ****请参阅8到9的屏幕截图
你的 分享您的使用设置,并找出其他交易者如何使用此指标来优化其策略!
===>为谁? 无论您是酌情交易者,算法交易者还是开发人员,该指标都旨在
===>此指标有什么作用? 他只能在时间范围内选择一个平均EMA
您将此指标放在图形上,因为您需要平均。
选择平均水平的参数和特征,仅此而已!!! ****请参阅屏幕截图01至02
请不要犹豫,要求我提供ICUSTOM代码,以轻松将此平均值集成到您自己的代码,另一个指标或EA中
选择 目标时间范围 期间数 滞后 所需的OHLC 时尚颜色 您可以在代码库和现在以“ William210”的名义找到我的所有出版物。
===>一些示例 这里有一些简单的示例,可以使用多个时间范围的移动平均
比特币上的示例 添加2个移动平均值20,每天在时间范围内,在H6上添加1个,然后在H1中查看 ****请参阅3到5的屏幕截图
S&P500的示例 在每日添加3个移动平均时间为20个时期 ****请参阅6到7的屏幕截图
黄金的例子 每天在每天添加2个移动平均值50和20个时期,然后查看H1 ****请参阅8到9的屏幕截图
你的 分享您的使用设置,并找出其他交易者如何使用此指标来优化其策略!
===>为谁? 无论您是酌情交易者,算法交易者还是开发人员,该指标都旨在满
===>此指标有什么作用? 他只能在时间范围内选择一个平均SMMA
您将此指标放在图形上,因为您需要平均。
选择平均水平的参数和特征,仅此而已!!! ****请参阅屏幕截图01至02
请不要犹豫,要求我提供ICUSTOM代码,以轻松将此平均值集成到您自己的代码,另一个指标或EA中
选择 目标时间范围 期间数 滞后 所需的OHLC 时尚颜色 您可以在代码库和现在以“ William210”的名义找到我的所有出版物。
===>一些示例 这里有一些简单的示例,可以使用多个时间范围的移动平均
比特币上的示例 添加2个移动平均值20,每天在时间范围内,在H6上添加1个,然后在H1中查看 ****请参阅3到5的屏幕截图
S&P500的示例 在每日添加3个移动平均时间为20个时期 ****请参阅6到7的屏幕截图
黄金的例子 每天在每天添加2个移动平均值50和20个时期,然后查看H1 ****请参阅8到9的屏幕截图
你的 分享您的使用设置,并找出其他交易者如何使用此指标来优化其策略!
===>为谁? 无论您是酌情交易者,算法交易者还是开发人员,该指标都旨在
===>此指标有什么作用? 他只能在时间范围内选择一个平均LWMA
您将此指标放在图形上,因为您需要平均。
选择平均水平的参数和特征,仅此而已!!! ****请参阅屏幕截图01至02
请不要犹豫,要求我提供ICUSTOM代码,以轻松将此平均值集成到您自己的代码,另一个指标或EA中
选择 目标时间范围 期间数 滞后 所需的OHLC 时尚颜色 您可以在代码库和现在以“ William210”的名义找到我的所有出版物。
===>一些示例 这里有一些简单的示例,可以使用多个时间范围的移动平均
比特币上的示例 添加2个移动平均值20,每天在时间范围内,在H6上添加1个,然后在H1中查看 ****请参阅3到5的屏幕截图
S&P500的示例 在每日添加3个移动平均时间为20个时期 ****请参阅6到7的屏幕截图
黄金的例子 每天在每天添加2个移动平均值50和20个时期,然后查看H1 ****请参阅8到9的屏幕截图
你的 分享您的使用设置,并找出其他交易者如何使用此指标来优化其策略!
===>为谁? 无论您是酌情交易者,算法交易者还是开发人员,该指标都旨在

欢迎使用 KMeans Price Zones Detector,这是一款创新的 MetaTrader 指标,利用机器学习的强大功能来识别关键的价格区间。该工具使用 KMeans 聚类算法动态检测价格数据中的中心点,突出显示价格更可能遇到支撑、阻力或整合的区域。 创新的 KMeans 算法 KMeans Price Zones Detector 之所以出众,是因为它先进地使用了 KMeans 聚类算法,这是一种在模式识别中以其效率和准确性而著称的机器学习技术。通过分析历史价格数据,指标识别代表显著价格水平的集群或中心点。然后利用这些中心点计算支撑和阻力区,为交易者提供关于潜在价格反转、突破和整合的重要信息。 主要特点 动态区域检测: 指标根据最新的市场数据不断更新价格区域,确保交易者始终掌握最相关的信息。 适用于所有时间框架: 无论您是在 1 分钟图表上进行短线交易还是在日线图表上进行长期投资,KMeans Price Zones Detector 都能无缝适应,提供准确的区域检测。 兼容所有外汇对: 该指标设计用于任何外汇对,为交易多种货币的交易者提供了灵活性和多功能性。 全面的 A

使用RAR(Relative Adaptive RSI)指标优化您的交易策略! 这一先进的技术分析指标结合了相对强弱指数(RSI)的强大功能和自适应技术,比常见的振荡器提供了更精确和可靠的信号。 什么是RAR指标? RAR是一种为MetaTrader 5设计的指标,使用指数移动平均线(EMA)和自适应移动平均线(AMA)来平滑RSI并动态调整其市场条件。这种创新的组合可以更高的精确度和速度检测市场趋势和强度的变化。 RAR指标的优势 动态适应性 :RAR自动调整以适应不断变化的市场条件,与传统RSI相比,提高了信号的准确性。 市场噪音的减少 :使用EMA和AMA来平滑RSI,减少市场噪音,提供更清晰和可靠的信号。 直观的可视化 :包括一个彩色柱状图,有助于识别市场趋势和强度的变化,帮助做出更明智的交易决策。 有效的趋势检测 :基于平滑RSI的趋势检测功能,能够更有效地识别趋势方向。 高可配置性 :允许调整关键参数,如RSI周期,EMA和AMA,以适应不同的交易策略和风格。 使用方法和信号确认 入场确认 : 支撑和阻力区域 :在价格位于关键支撑和阻力区域时使用RAR确认入场。如果RAR在
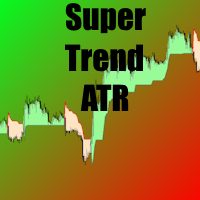
=== > 这个指标有什么作用? 它根据 ATR 绘制一条代表超级趋势的线
选择 ATR倍数 ATR期 就这样 !!! **** 请参阅屏幕截图 01 至 2
请随时向我索要 iCustom 代码,以便轻松将此 SuperTrend 集成到您自己的代码中
=== > 比特币示例 **** 参见截图 03
===> 为了谁? 无论您是全权委托交易者、算法交易者还是开发人员,该指标的设计都能满足您的需求。我了解涉及金钱时可靠性和效率的重要性,并且我非常认真地对待这一责任。
该指标在您的 PC 或 VPS 上消耗很少的资源。
对于算法交易者和开发人员,我提供对这两个缓冲区的完全访问权限: SuperTrend 值的缓冲区 1 缓冲区 2 用于超级趋势的方向
=== > 为什么? ATR上的SuperTrend有很多优势,一定能为您的交易提供帮助
- 清晰识别趋势 - 准确的输入/输出信号 - 优化风险管理 - 适配多种仪器 - 通过其他指标确认趋势 - 简单性和灵活性 - 外汇、股票、商品交易工具 -让您能够更长久地跟踪趋势 - 过滤由于波动性造成的波动 -
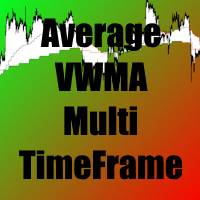
===>此指标有什么作用? 它是按交易量加权的移动平均线,它是根据交易量进行精确平滑
它根据时间范围的选择绘制单个 WWMA 平均值
您可以根据需要多次将该指标放在图表上进行平均。
选择平均值的参数和特征,就是这样! ****请参阅屏幕截图01至02
请不要犹豫,要求我提供ICUSTOM代码,以轻松将此平均值集成到您自己的代码,另一个指标或EA中
选择 目标时间范围 期间数 滞后 所需的OHLC 时尚颜色 您可以在代码库和现在以“ William210”的名义找到我的所有出版物。
===>一些示例 这里有一些简单的示例,可以使用多个时间范围的移动平均
比特币上的示例 添加2个移动平均值20,每天在时间范围内,在H6上添加1个,然后在H1中查看 ****请参阅3到5的屏幕截图
S&P500的示例 在每日添加3个移动平均时间为20个时期 ****请参阅6到7的屏幕截图
黄金的例子 每天在每天添加2个移动平均值50和20个时期,然后查看H1 ****请参阅8到9的屏幕截图
你的 分享您的使用设置,并找出其他交易者如何使用此指标来优化其策略!
==
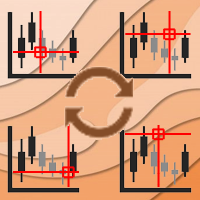
Async Charts is an indicator to synchronize charts and display a customized crosshair (cursor) on all selected charts. This is a useful utility for traders using multiple timeframes of analyzing multiple symbols for trade entry or exit.
Main Features : Real time Crosshair Synchronization on All Selected Charts
Supports Multiple Timeframes and Multiple Symbols at the same time
Auto Scroll Option
Graphical Adjustment of Color, Font, Size, ...
Locking All or Locking Specific Charts
More and

Индикатор тиковых объемов представляет собой инструмент технического анализа, используемый для оценки активности трейдеров на рынке. Этот индикатор отображает количество тиков (изменений цен) за определенный временной период и показывает преобладание тиков, направленных на покупку или продажу.
Основные характеристики и функции индикатора тиковых объемов: Гистограмма объемов:
Белый цвет: Означает преобладание тиков, направленных на покупку. Когда количество покупок превышает количество прода
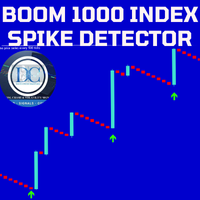
Our Spike Detector is specifically engineered to cater to the unique needs of traders in the Boom and Crash indices markets. This tool is optimized for M1 (1-minute) and M5 (5-minute) timeframes, ensuring you receive timely and actionable insights.
Key Features: 1. **Non-Repainting**: Our detector guarantees accuracy with non-repainting signals, ensuring your data remains consistent and reliable. 2. **Push Notifications**: Stay updated with real-time push notifications, so you never miss a cr
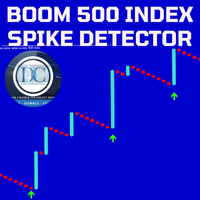
Our Spike Detector is specifically engineered to cater to the unique needs of traders in the Boom and Crash indices markets. This tool is optimized for M1 (1-minute) and M5 (5-minute) timeframes, ensuring you receive timely and actionable insights.
Key Features:
1. Non-Repainting**: Our detector guarantees accuracy with non-repainting signals, ensuring your data remains consistent and reliable. 2. Push Notifications**: Stay updated with real-time push notifications, so you never miss a cr

Our Spike Detector is specifically engineered to cater to the unique needs of traders in the Boom and Crash indices markets. This tool is optimized for M1 (1-minute) and M5 (5-minute) timeframes, ensuring you receive timely and actionable insights.
Key Features:
1. **Non-Repainting**: Our detector guarantees accuracy with non-repainting signals, ensuring your data remains consistent and reliable. 2. **Push Notifications**: Stay updated with real-time push notifications, so you never miss a
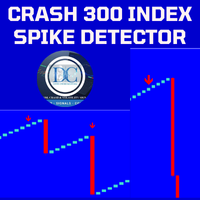
Spike Detector for Boom and Crash Indices
The Spike Detector is specifically designed to cater to the unique needs of traders in the Boom and Crash indices markets. Optimized for M1 (1-minute) and M5 (5-minute) timeframes, this tool ensures you receive timely and actionable insights. Below, you'll find a comprehensive guide on its key features, advantages, installation process, and how to use it effectively.
Key Features and Advantages
1. Non-Repainting: The Spike Detector guarantees accu

This is the test product. Please, DO NOT BUY IT! This is the test product. Please, DO NOT BUY IT! This is the test product. Please, DO NOT BUY IT! This is the test product. Please, DO NOT BUY IT! This is the test product. Please, DO NOT BUY IT! This is the test product. Please, DO NOT BUY IT! This is the test product. Please, DO NOT BUY IT! This is the test product. Please, DO NOT BUY IT!
您知道为什么MetaTrader市场是出售交易策略和技术指标的最佳场所吗?不需要广告或软件保护,没有支付的麻烦。一切都在MetaTrader市场提供。
您错过了交易机会:
- 免费交易应用程序
- 8,000+信号可供复制
- 探索金融市场的经济新闻
注册
登录