MetaTrader 5용 기술 지표 - 59

The DYJ SignalSourceOfMACD is based on the MACD indicator. Generally, signals are generated when crossing the MACD and SIGNAL lines of the MACD indicator. Signals to buy are generated if the MACD line crosses over the SIGNAL line in the negative area below the MACD open level. The negative area is where the values of MACD and SIGNAL lines are below zero. The MACD open level parameter is set in pips. However, in the code it is converted as follows: MACD Open level * Instrument.PipSize. For exa
DYJ SignalSourceOfRSI is a momentum oscillator which shows price strength by comparing upward movements of Close prices to their downward movements over a selected number of periods. There are two kinds of signals provided by RSI: RSI reaching of either overbought or oversold level and then making a bit of reversal: Signals to buy are generated falling of RSI below level(30) and Signals to sell are generated rising of RSI above level(70) Falling of RSI below level(30) and then rising above level

Do you want to know how an economic event will impact price? What will happen to price after the news? How has an economic news affected price in the past? This indicator can help you with that.
Do you like technical analysis? Do you enjoy studying the tick history to predict the future? But what do you think could be more important than technical analysis, what could improve technical analysis? Of course, it's fundamental analysis! After all, economic events directly impact the market, and t

TrendEdge Indicator
Limited-time Special Opportunity: Seize the moment! Be among the first 10 (Purchasing 1/10) to seize this unique opportunity, and not only will you acquire a top-tier trading algorithm but also enjoy an exclusive discount. Don’t delay; this could be your key to trading success with just a few clicks. Grab it now and prepare to elevate your trading experience! Note: This offer is available solely to the first 10 purchasers. Don’t mis out on this one-of-a-kind chance! Descri

MACD is probably one of the most popular technical indicators out there. When the market is trending, it actually does a pretty good job, but when the market starts consolidating and moving sideways, the MACD performs not so well. SX Impulse MACD for MT4 is available here . Impulse MACD is a modified version of MACD that works very well for trading Forex, stocks, and cryptocurrencies. It has its own unique feature which perfectly filters out the values in a moving average range and enables it
Introduction
The Price Action, styled as the "Smart Money Concept" or "SMC," was introduced by Mr. David J. Crouch in 2000 and is one of the most modern technical styles in the financial world. In financial markets, Smart Money refers to capital controlled by major market players (central banks, funds, etc.), and these traders can accurately predict market trends and achieve the highest profits.
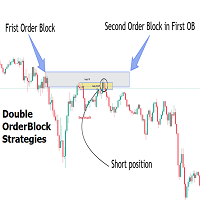
In the "Smart Money" style, various types of "order blocks" can be traded. This indicator
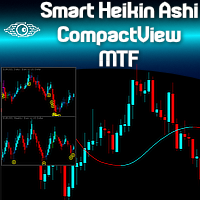
Are you already a fan of the Minions Labs Smart Heikin Ashi chart analysis tool? Or perhaps you're looking for a versatile Heikin Ashi chart capable of operating across multiple timeframes? Want to see the bigger picture before diving into the details, to make smarter ENTRY decisions? Do you want to build your own Dashboard of Symbols in just one chart, without dealing with messy multi-window MT5 stuff? Welcome to the Minions Labs Smart Heikin Ashi CompactView MTF indicator! Please see the power

The indicator illustrates the divergence between the price movements of two financial instruments, such as EURUSD and GBPUSD or US500 and US30 or Gold and Silver. These divergences are plotted in the form of segments on the price chart of the dominant instrument. The dominant instrument refers to the one that exhibits a stronger bullish trend in the case of a bullish divergence, or a stronger bearish trend in the case of a bearish divergence. Investors are encouraged to independently seek correl

The Ultimate Trend and Reversals Detector The Ultimate Trend and Reversals Detector is a powerful tool designed to identify potential trend reversal zones in the financial markets. Here are the key features: Objective : Detect trend directions and reversals. Signal Colors : Green : Indicates a potential bullish trend reversal. Red : Signals a potential bearish trend reversal. Non-Repainting : The indicator’s signals are not redrawn, providing reliable information. Suitable for All Styles : Scal

Introduction
The "Smart Money Concept" transcends mere technical trading strategies; it embodies a comprehensive philosophy elucidating market dynamics. Central to this concept is the acknowledgment that influential market participants manipulate price actions, presenting challenges for retail traders.
As a "retail trader", aligning your strategy with the behavior of "Smart Money," primarily market makers, is paramount. Understanding their trading patterns, which revolve around supply
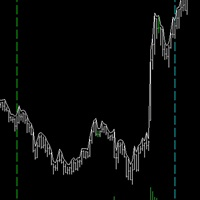
This is one of my most important indicators. Did you ever miss the session open/close? I did, which is why I made this indicator. It took a long time to get this right, since depending on your platform and timezone, it can be incorrect. It should be accurate for everyone now. It takes into account Daylight savings for NY and EU timezones, and should just work like magic on your charts.
## Check screenshots to see proof that this indictor is a must! ##
Do you hate having to have a Monthly, Weekly, Daily chart when looking at your lower timeframes? I hated it too, so I made this. It will show you the High and Low of other timeframes on your chart, so you will always be aware where some support/resistance may be! Even on the 1 minute chart!
I recommend you use it 3 times, one with Day, Week and Month selected with different line widths.
I use this on every chart I look at

The Boom300 Spike Indicator is a powerful tool designed to identify significant price spikes in the market.
Key Features: Real-time Spike Detection: The indicator continuously scans the market for sudden spikes in price action, providing timely alerts when significant spikes occur. Customizable Alerts: Traders can customize alerts to suit their preferences, including audible alerts, email notifications, and push notifications to mobile devices. User-Friendly Interface: The indicator offers a

Description: The Spike Sniper Crash Market Indicator is a sophisticated tool designed to identify and navigate volatile market conditions, often associated with sudden price spikes and market crashes. Leveraging advanced algorithms and technical analysis, this indicator serves as a vigilant guardian, alerting traders to potential market disruptions and providing actionable insights to mitigate risks and capitalize on opportunities. Key Features: Precision Spike Detection: The indicator employs c

The indicator determines the ATR value (points) in a classic way (taking into calculation paranormal bars/candles) and more correctly - ignoring paranormal movements of the Instrument. Correctly it is excluding paranormal bars from the calculation, extremely small bars (less than 5%( customizable ) of the standard ATR) and extremely large bars (more than 150% ( customizable ) of the standard ATR) are ignored. This is a Extended version - allows you to set calculation parameters a
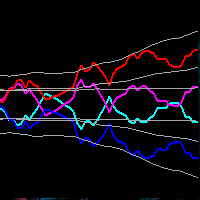
This indicator obeys the popular maxim that: "THE TREND IS YOUR FRIEND" Channel indicators incorporate volatility to capture price action. The Bollinger Bands is widely used, however, there are other options to capture swing action opportunities. Each study you will find here is unique, and reveals different types of price action.
https://www.mql5.com/en/market/product/116256
https://www.mql5.com/en/market/product/115553

MultiFractal Levels MultiFractal Levels – 는 레벨이 추가된 수정된 Bill Williams 프랙탈 표시기입니다. 프랙탈은 설정에서 허용되는 모든 TF에서 구축됩니다.
레벨은 아직 가격 테스트를 거치지 않은 최신 프랙탈을 기반으로만 구성됩니다. 원래 터미널 표시기에 비해 장점: 편의 시계 유익성 최신 레벨 맞춤형 프랙탈 맞춤형 레벨 이 지표는 작업할 때 다른 기간으로 전환할 필요가 없기 때문에 편리합니다.
가시성 - 하나의 차트에서 소규모 시장, 중규모 시장, 대규모 시장 움직임까지 차트의 구조를 볼 수 있습니다.
정보 내용 - 시각적으로 그래픽에 대한 더 많은 정보를 얻습니다.
사용자 정의 프랙탈은 양면에서 변경할 수 있습니다. 왼쪽과 오른쪽의 막대 수는 설정에서 지정할 수 있습니다.
사용자 정의 가능한 수준은 변경할 수 있습니다. 극단에 따라 그려지거나 신호의 그림자(중앙 캔들)에 따라 영역으로 그려집니다. 따라서 이전 TF의 프

This is the MT5 version of Ku-Chart.
This is an indicator devised by Ku-chan, a famous Japanese trader, based on the dealings of Lehman Brothers' discretionary traders. Unify the measuring stick of currencies to display the true value of currencies.
Although it is an indicator, it does not use a buffer and is displayed using objects such as trend lines. Also, instead of drawing on the subchart, it is drawn in an area far above the current price of the main chart, so you can switch from the

Introduction
The "Smart Money Concept" transcends the realm of mere technical trading strategies to embody a comprehensive philosophy on the dynamics of market operations. It posits that key market participants engage in price manipulation, thereby complicating the trading landscape for smaller, retail traders.
Under this doctrine, retail traders are advised to tailor their strategies in alignment with the maneuvers of "Smart Money" - essentially, the capital operated by market makers

Introducing our state-of-the-art Wave Indicator, meticulously designed for the discerning traders of the MQL5 community! At the core of this innovative tool lies an unmatched sensitivity to capture even the slightest market movements. Our Wave Indicator serves as the foundational element for constructing comprehensive trading strategies, providing you with an unwavering edge in the dynamic world of finance. Whether you're aiming to refine short-term tactics or develop long-term systems, this ind
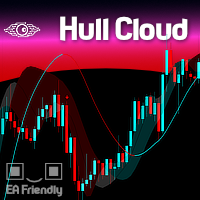
The Hull Moving Average is known for its ability to reduce lag and provide a clearer, more accurate depiction of market trends. By smoothing price data more effectively than traditional moving averages, it helps traders identify trend directions and reversals with greater precision. The Hull Cloud indicator elevates this by using four Hull Moving Averages working together like an orchestra. This combination creates a dynamic system that highlights short, medium, and long-term trends, giving trad
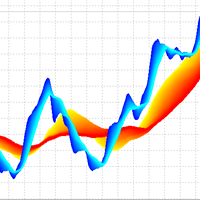
3D Trend Indicator is a non-repaint indicator using multiple moving averages with a 3D surface view. By using this indicator, you can remove uncertainties that can happen using a single and fixed moving average period. You can use a cloud area using a range of moving average periods. Also a wide range of visual settings are added to this indicator to have a better view from the cloud area. Alert and notification system added to the indicator to inform the trader about the action of candles on t
Apresentamos o Indicador de novo grafico - uma ferramenta poderosa para traders que buscam uma análise de preço suave e clara. Este indicador inovador calcula a média simples dos preços, oferecendo uma visão precisa e ajustada dos movimentos do mercado. Como Funciona : O Indicador de Média de Preços Simples (SMA) utiliza uma fórmula simples e eficaz: Ele soma o valor do último preço com o preço anterior. Em seguida, divide essa soma por 2 para obter a média. Fórmula : SMA = U ˊ ltimo Pre c ¸ o +

MinMax Levels MinMax Levels – 은 중요한 거래 기간(일, 주, 월)의 최대, 최소 및 시가 수준을 나타내는 지표입니다.
각 Forex 시장 참가자는 거래 시스템에서 레벨을 사용합니다. 이는 거래를 위한 주요 신호일 수도 있고 분석 도구 역할을 하는 추가 신호일 수도 있습니다. 이 지표에서는 대규모 시장 참여자의 주요 거래 기간인 일, 주, 월을 중요한 기간으로 선택했습니다. 아시다시피 가격은 수준에서 수준으로 이동하며 중요한 수준과 관련된 가격 위치에 대한 지식은 거래 결정을 내리는 데 이점을 제공합니다. 편의를 위해 두 레벨 자체를 활성화 및 비활성화하고 버튼을 축소하여 가격 차트 작업 창에서 공간을 확보할 수 있는 버튼이 추가되었습니다.
각 Forex 시장 참가자는 거래 시스템에서 레벨을 사용합니다. 이는 거래를 위한 주요 신호일 수도 있고 분석 도구 역할을 하는 추가 신호일 수도 있습니다. 이 지표에서는 대규모 시장 참여자의 주요 거래

Description of the Indicator The indicator "BullsBearsPulse" is designed for MetaTrader 5 and provides a visual representation of the Bulls Power and Bears Power indicators. These indicators are useful tools for technical analysis, particularly for the EUR/USD currency pair, to help traders identify potential trading opportunities. Functionality Bulls Power : This indicator measures the strength of the bulls (buyers) in the market. It calculates the difference between the highest price and a 20

The Engulf Seeker indicator is a powerful tool designed to detect engulfing candlestick patterns with precision and reliability. Built on advanced logic and customizable parameters, it offers traders valuable insights into market trends and potential reversal points.
Key Features and Benefits: Utilizes revised logic to analyze previous candles and identify strong bullish and bearish engulfing patterns. Convenient arrow-based alert system notifies traders of pattern occurrences on specific symb

This spread indicator displays the actual spread of each candle. It highlights the maximum spread and the minimum spread of the chosen symbol. This indicator is very helpful to see in real time the spread evolution helping to avoid taking a trade when the spread is too high.
Inputs:
Print value in Points: if true displays the spread as a whole number
D isplay minimum and maximum spread of the past N days: select the number of days to consider the maximum and minimum spread
Automatically
===>이 표시기는 무엇을합니까? 그는 기간을 선택하여 평균 SMA 를 하나만 그립니다.
이 표시기를 평균 필요한만큼 그래픽에 넣습니다.
평균의 매개 변수와 특성을 선택하십시오. **** 스크린 샷 01 ~ 02 참조
이 평균을 자신의 코드, 다른 지표 또는 EA에 쉽게 통합 할 수있는 ICUSTOM 코드를 요청하는 것을 망설이지 마십시오.
선택하다 대상 기간 기간 수 지연 원하는 OHLC 트렌디 한 색 Codebase 및 이제 Marketplace에서 "William210"이라는 이름으로 모든 출판물을 찾을 수 있습니다.
===> 몇 가지 예 다음은 다중 기간 모바일 평균을 사용하는 몇 가지 쉬운 예입니다.
비트 코인의 예 2 개의 모바일 평균 20을 추가, 매일 1 개, H6에 1 개를 추가하고 H1에서 참조하십시오. **** 3에서 5까지의 스크린 샷을 참조하십시오
S & P500의 예 매일 적용되는 일일 중간 가격에 3 개의 모바일 평균 20 개
===>이 표시기는 무엇을합니까? 그는 기간을 선택하여 평균 EMA를 하나만 그립니다.
이 표시기를 평균 필요한만큼 그래픽에 넣습니다.
평균의 매개 변수와 특성을 선택하십시오. **** 스크린 샷 01 ~ 02 참조
이 평균을 자신의 코드, 다른 지표 또는 EA에 쉽게 통합 할 수있는 ICUSTOM 코드를 요청하는 것을 망설이지 마십시오.
선택하다 대상 기간 기간 수 지연 원하는 OHLC 트렌디 한 색 Codebase 및 이제 Marketplace에서 "William210"이라는 이름으로 모든 출판물을 찾을 수 있습니다.
===> 몇 가지 예 다음은 다중 기간 모바일 평균을 사용하는 몇 가지 쉬운 예입니다.
비트 코인의 예 2 개의 모바일 평균 20을 추가, 매일 1 개, H6에 1 개를 추가하고 H1에서 참조하십시오. **** 3에서 5까지의 스크린 샷을 참조하십시오
S & P500의 예 매일 적용되는 일일 중간 가격에 3 개의 모바일 평균 20 개
===>이 표시기는 무엇을합니까? 그는 기간을 선택하여 평균 SMMA를 하나만 그립니다.
이 표시기를 평균 필요한만큼 그래픽에 넣습니다.
평균의 매개 변수와 특성을 선택하십시오. **** 스크린 샷 01 ~ 02 참조
이 평균을 자신의 코드, 다른 지표 또는 EA에 쉽게 통합 할 수있는 ICUSTOM 코드를 요청하는 것을 망설이지 마십시오.
선택하다 대상 기간 기간 수 지연 원하는 OHLC 트렌디 한 색 Codebase 및 이제 Marketplace에서 "William210"이라는 이름으로 모든 출판물을 찾을 수 있습니다.
===> 몇 가지 예 다음은 다중 기간 모바일 평균을 사용하는 몇 가지 쉬운 예입니다.
비트 코인의 예 2 개의 모바일 평균 20을 추가, 매일 1 개, H6에 1 개를 추가하고 H1에서 참조하십시오. **** 3에서 5까지의 스크린 샷을 참조하십시오
S & P500의 예 매일 적용되는 일일 중간 가격에 3 개의 모바일 평균 20 개
===>이 표시기는 무엇을합니까? 그는 기간을 선택하여 평균 LWMA를 하나만 그립니다.
이 표시기를 평균 필요한만큼 그래픽에 넣습니다.
평균의 매개 변수와 특성을 선택하십시오. **** 스크린 샷 01 ~ 02 참조
이 평균을 자신의 코드, 다른 지표 또는 EA에 쉽게 통합 할 수있는 ICUSTOM 코드를 요청하는 것을 망설이지 마십시오.
선택하다 대상 기간 기간 수 지연 원하는 OHLC 트렌디 한 색 Codebase 및 이제 Marketplace에서 "William210"이라는 이름으로 모든 출판물을 찾을 수 있습니다.
===> 몇 가지 예 다음은 다중 기간 모바일 평균을 사용하는 몇 가지 쉬운 예입니다.
비트 코인의 예 2 개의 모바일 평균 20을 추가, 매일 1 개, H6에 1 개를 추가하고 H1에서 참조하십시오. **** 3에서 5까지의 스크린 샷을 참조하십시오
S & P500의 예 매일 적용되는 일일 중간 가격에 3 개의 모바일 평균 20 개

KMeans Price Zones Detector와 함께하는 트레이딩의 미래에 오신 것을 환영합니다. 이 혁신적인 MetaTrader 지표는 기계 학습의 힘을 활용하여 주요 가격대를 식별합니다. 이 도구는 가격 데이터에서 중심점을 동적으로 감지하기 위해 KMeans 클러스터링 알고리즘을 사용하여 가격이 지지선, 저항선 또는 통합에 직면할 가능성이 높은 영역을 강조합니다. 혁신적인 KMeans 알고리즘 KMeans Price Zones Detector는 KMeans 클러스터링 알고리즘을 고급적으로 활용하여 두드러집니다. 이 알고리즘은 효율성과 정확성으로 패턴 인식에서 알려져 있으며, 기계 학습의 기본 요소입니다. 역사적인 가격 데이터를 분석함으로써, 이 지표는 중요한 가격 수준을 나타내는 클러스터 또는 중심점을 식별합니다. 그런 다음 이러한 중심점을 사용하여 지지선과 저항선을 계산하여 트레이더에게 가격 반전, 돌파 및 통합의 가능성에 대한 중요한 정보를 제공합니다. 주요 특징 동적 영

RAR (Relative Adaptive RSI) 지표로 트레이딩 전략을 최적화하세요! 이 고급 기술 분석 지표는 상대 강도 지수(RSI)의 힘을 적응 기술과 결합하여 일반적인 오실레이터보다 더 정확하고 신뢰할 수 있는 신호를 제공합니다. RAR 지표란? RAR은 MetaTrader 5를 위해 설계된 지표로, 지수 이동 평균(EMA)과 적응 이동 평균(AMA)을 사용하여 RSI를 부드럽게 하고 동적으로 시장 상황에 맞게 조정합니다. 이 혁신적인 조합은 시장 트렌드 및 강도 변화를 더 큰 정확도와 속도로 감지할 수 있게 합니다. RAR 지표의 장점 동적 적응성 : RAR은 변화하는 시장 조건에 자동으로 적응하여 전통적인 RSI에 비해 신호 정확도를 향상시킵니다. 시장 소음 감소 : EMA 및 AMA를 사용하여 RSI를 부드럽게 하여 시장 소음을 줄이고 더 명확하고 신뢰할 수 있는 신호를 제공합니다. 직관적인 시각화 : 시장 트렌드 및 강도 변화를 식별하는 데 도움이 되는 색상 히스토그
=== > 이 지표는 어떤 역할을 합니까? ATR을 기반으로 Supertrend를 나타내는 선을 그립니다.
선택하다 ATR 배수 ATR 기간 그리고 그게 다야 !!! **** 스크린샷 01~2 참조
이 SuperTrend를 귀하의 코드에 쉽게 통합하려면 주저하지 말고 iCustom 코드를 요청하세요.
=== > 비트코인의 예 **** 스크린샷 03 참조
=== > 누구를 위한 것인가? 귀하가 임의 거래자, 알고리즘 거래자 또는 개발자인지 여부에 관계없이 지표는 귀하의 요구를 충족하도록 설계되었습니다. 나는 돈이 관련될 때 신뢰성과 효율성의 중요성을 이해하고 있으며 이 책임을 매우 진지하게 받아들입니다.
표시기는 PC 또는 VPS에서 리소스를 거의 소비하지 않습니다.
알고리즘 거래자와 개발자를 위해 두 버퍼에 대한 전체 액세스를 제공합니다. SuperTrend 값에 대한 버퍼 1 Supertrend의 방향을 위한 버퍼 2
=== > 왜요? ATR의 Super
===>이 표시기는 무엇을합니까? 거래량에 따라 가중된 이동평균이며, 교환된 거래량에 따라 정밀하게 평활화됩니다.
선택한 기간에 따라 단일 WWMA 평균을 표시합니다.
평균을 구하는 데 필요한 만큼 이 지표를 차트에 놓습니다.
평균의 매개변수와 특성을 선택하면 끝입니다!!! **** 스크린 샷 01 ~ 02 참조
이 평균을 자신의 코드, 다른 지표 또는 EA에 쉽게 통합 할 수있는 ICUSTOM 코드를 요청하는 것을 망설이지 마십시오.
선택하다 대상 기간 기간 수 지연 원하는 OHLC 트렌디 한 색 Codebase 및 이제 Marketplace에서 "William210"이라는 이름으로 모든 출판물을 찾을 수 있습니다.
===> 몇 가지 예 다음은 다중 기간 모바일 평균을 사용하는 몇 가지 쉬운 예입니다.
비트 코인의 예 2 개의 모바일 평균 20을 추가, 매일 1 개, H6에 1 개를 추가하고 H1에서 참조하십시오. **** 3에서 5까지의 스크린 샷을 참
Async Charts is an indicator to synchronize charts and display a customized crosshair (cursor) on all selected charts. This is a useful utility for traders using multiple timeframes of analyzing multiple symbols for trade entry or exit.
Main Features : Real time Crosshair Synchronization on All Selected Charts
Supports Multiple Timeframes and Multiple Symbols at the same time
Auto Scroll Option
Graphical Adjustment of Color, Font, Size, ...
Locking All or Locking Specific Charts
More and

Индикатор тиковых объемов представляет собой инструмент технического анализа, используемый для оценки активности трейдеров на рынке. Этот индикатор отображает количество тиков (изменений цен) за определенный временной период и показывает преобладание тиков, направленных на покупку или продажу.
Основные характеристики и функции индикатора тиковых объемов: Гистограмма объемов:
Белый цвет: Означает преобладание тиков, направленных на покупку. Когда количество покупок превышает количество прода
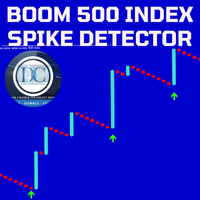
Our Spike Detector is specifically engineered to cater to the unique needs of traders in the Boom and Crash indices markets. This tool is optimized for M1 (1-minute) and M5 (5-minute) timeframes, ensuring you receive timely and actionable insights.
Key Features:
1. Non-Repainting**: Our detector guarantees accuracy with non-repainting signals, ensuring your data remains consistent and reliable. 2. Push Notifications**: Stay updated with real-time push notifications, so you never miss a cr
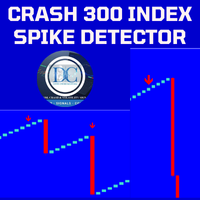
Spike Detector for Boom and Crash Indices
The Spike Detector is specifically designed to cater to the unique needs of traders in the Boom and Crash indices markets. Optimized for M1 (1-minute) and M5 (5-minute) timeframes, this tool ensures you receive timely and actionable insights. Below, you'll find a comprehensive guide on its key features, advantages, installation process, and how to use it effectively.
Key Features and Advantages
1. Non-Repainting: The Spike Detector guarantees accu
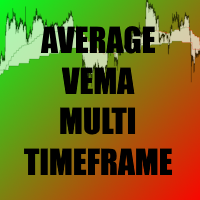
===>이 표시기는 무엇을합니까? 선택한 기간에 따라 단일 VEMA 평균을 표시합니다.
거래량 가중 지수 이동 평균(VEMA)은 최근 데이터와 거래량이 많은 막대에 더 많은 가중치를 두는 이동 평균입니다.
이는 거래량이 많은 바의 가격 변동이 VEMA에 더 큰 영향을 미친다는 것을 의미합니다.
평균을 구하는 데 필요한 만큼 이 지표를 차트에 놓습니다.
평균의 매개변수와 특성을 선택하면 끝입니다!!! **** 스크린 샷 01 ~ 02 참조
이 평균을 자신의 코드, 다른 지표 또는 EA에 쉽게 통합 할 수있는 ICUSTOM 코드를 요청하는 것을 망설이지 마십시오.
선택하다 대상 기간 기간 수 지연 원하는 OHLC 트렌디 한 색 Codebase 및 이제 Marketplace에서 "William210"이라는 이름으로 모든 출판물을 찾을 수 있습니다.
===> 몇 가지 예 다음은 다중 기간 모바일 평균을 사용하는 몇 가지 쉬운 예입니다.
비트 코인의 예 2 개의

Willkommen in einer neuen Ära des Tradings mit dem AI Moving Average Indikator, einem fortschrittlichen MetaTrader 5 Indikator, der Tradern prädiktive Einblicke in Marktbewegungen bietet. Dieses Tool kombiniert die Leistungsfähigkeit von KI mit der Zuverlässigkeit eines Zero-Lag-Exponentialgleitenden Durchschnitts, um präzise und zeitnahe Vorhersagen über zukünftige Preisentwicklungen zu liefern. Innovatives Lineares Regressionsmodell Der AI Moving Average nutzt ein maschinelles Lernmodell der l

Trend reversal identification: The K-line countdown indicator helps traders capture trend reversal signals by identifying excessive buying and selling behavior in the market. This indicator is particularly effective when the market is in extreme states. Risk management: This indicator can help traders identify potential risks in the market before the trend reverses and adjust positions in time to avoid losses. For example, you might consider reducing your long position when a bullish countdown c

Evaluate operational viability in each timeframe and in any instrument, according to their respective spread and percentage volatility, which are essential for correct risk management in your trades.
This indicator is essential for both Day Traders and Swing Traders, as in addition to evaluating operational viability in each timeframe, it is also possible to identify the fair minimum stop for each period and instrument.
Example in Swing Trade: your broker charges a spread equivalent to 0.05
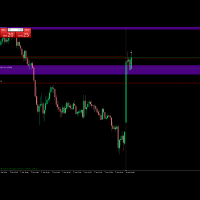
Your average price indicator for the position you were looking for. This indicator inserts a horizontal line on your chart when you are positioned, long or sold, after completing the partial. After completing the partial, it inserts the horizontal line on the graph visually showing where the true BreakEven of the operation is. Take a look the line of point 0 of operation.
Seu indicador de preço médio da posição que estava procurando. Este indicador insere uma linha horizontal no seu gráfico q

다중 시간대 및 다중 기호 시장 스캐너. 이 표시기는 선택한 모든 기기 및 기간에 대해 선택한 기술 전략을 테스트하고 몇 분의 1초 안에 스캔 결과를 표시합니다.
사용 사례 지표를 실행하고 거래 시간과 거래 논리를 설정하세요. 대부분의 장비에서 스캔 결과가 수익성이 있는지 확인한 다음 마우스 클릭 한 번으로 원하는 차트로 전환하십시오. 무역 신호가 준비되었습니다. 신호의 주파수가 편안한지 확인하고 필요한 경우 "트리거 감도" 옵션을 사용하여 변경하십시오. 화면 및 전화 알림을 설정합니다. 실시간 거래를 위한 모든 준비가 완료되었습니다.
특징 - 시간과 거래 논리를 사용자 정의할 수 있습니다. 추세 추종, 역추세, 지역 돌파, 평균 회귀 전략 중에서 선택하세요. 아시아, 런던, 뉴욕 세션 중 거래 여부를 설정합니다. - 스캔 결과는 스크롤 가능하고 승리 확률에 따라 정렬 가능하며 클릭하여 스캔된 차트로 전환하고 거래를 구성할 수 있습니다. - 다시 그리지 않고 지연되지 않습니다

StochastiX is an extension of a well-known indicator.
1) StochastiX is displayed in the range of -100 to 100.
2) A histogram is calculated from the difference of the main and signal curves - again as a stochastic, but without smoothing.
The histogram gives the user a hint about the dynamics of oscillator changes. Patterns need to be studied from real graphs.
I wish you successful trading.

Why the RSI Alert Indicator is Essential for Your Trading Toolkit
In the fast-paced world of trading, timely and accurate information is crucial. The RSI Alert Indicator is a powerful tool designed to help you stay ahead of the market by providing real-time alerts when the Relative Strength Index (RSI) reaches critical levels. Whether you're a novice trader or a seasoned professional, this indicator can significantly enhance your trading strategy by pinpointing potential market reversals with

This is the test product. Please, DO NOT BUY IT! This is the test product. Please, DO NOT BUY IT! This is the test product. Please, DO NOT BUY IT! This is the test product. Please, DO NOT BUY IT! This is the test product. Please, DO NOT BUY IT! This is the test product. Please, DO NOT BUY IT! This is the test product. Please, DO NOT BUY IT! This is the test product. Please, DO NOT BUY IT!
MetaTrader 마켓은 거래 로봇과 기술 지표들의 독특한 스토어입니다.
MQL5.community 사용자 메모를 읽어보셔서 트레이더들에게 제공하는 고유한 서비스(거래 시그널 복사, 프리랜서가 개발한 맞춤형 애플리케이션, 결제 시스템 및 MQL5 클라우드 네트워크를 통한 자동 결제)에 대해 자세히 알아보십시오.
트레이딩 기회를 놓치고 있어요:
- 무료 트레이딩 앱
- 복사용 8,000 이상의 시그널
- 금융 시장 개척을 위한 경제 뉴스
등록
로그인
계정이 없으시면, 가입하십시오
MQL5.com 웹사이트에 로그인을 하기 위해 쿠키를 허용하십시오.
브라우저에서 필요한 설정을 활성화하시지 않으면, 로그인할 수 없습니다.