适用于MetaTrader 4的付费EA交易和指标 - 139

Antlia2021 is a moderate profit algorithm with more than 60% profitable trades and 12% Equity Drawdown Maximal in 12 months historical backtesting. It usually opens multiple trades per week and closes them mostly within 1-3 days. Centaurus is combination of Fixed Lots, RSI and Grid algorithm. Recommended Broker : www.icmarkets.com
Trades The Group of Trade has a Fixed Lots with grid algorithm open by Divergence RSI , a fixed Take Profit about 10 pips or 100 dollars set from the beginning. Fe

Здравствуйте, уважаемые трейдеры! Разрешите мне представить незаменимого помощника для Вашей торговли на рынке Forex. Прежде всего хочу акцентировать Ваше внимание на том, что первый торговый ордер открывается Вами ВРУЧНУЮ,путем нажатия соответствующей кнопки выбранного направления сделки согласно Вашей стратегии.
Я назову Вам 10 причин, почему данный советник должен быть у каждого трейдера! -)) 1) Такие уровни как Stop Loss, Take Profit, а так же отложенные усредняющие ордера будут строго
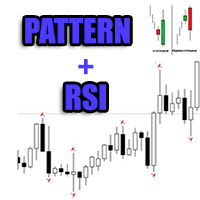
This Expert Advisor is notable for the fact that it is designed for trading any currency pair. The "Pattern + RSI" robot demonstrates good performance for a long time without changing the settings, and it is not some prohibitively complex system, but simply a successful combination of Prise Action, indicators and an order grid.
The EA can be used in any market with a low spread and good liquidity. However, I recommend the following currency pairs: EURUSD, USDJPY, GBPUSD and XAUUSD. Fully auto
FRPattern
Советник можно использовать на любом рынке с низким спредом и хорошей ликвидностью. Тем не менее рекомендую следующие валютные пары: EURUSD, USDJPY, GBPUSD и XAUUSD. Полностью автоматическая торговля с расчетом входов на основе анализа паттерна на старшем таймфрейме и фильтрации на младшем таймфрейме.
Основные характеристики советника Продвинутое управление стоп-лоссом Алгоритм контроля за проскальзыванием, позволяющий избегать больших убытков при сильном проскальзывании Полнос
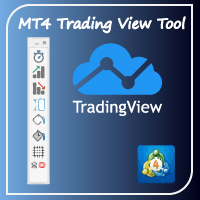
Hello Traders! I share with you today a tool that I use on a daily basis. For those of you like me who do the analysis on the trading view and then enter the trades on the MT4, it's known that can be problems. This tool is for just that.
MAIN FUNCTION: 1 - Candle Close Timer: for those who do scalping or short-term operations, you need to know the exact moment of the closing and opening of a new candle; 2 - Trading View Interface: Check on your broker if your analysis in therm of Risk Reward R

Many forex traders spend their time looking for that perfect moment to enter the markets or a telltale sign that screams "buy" or "sell". And while the search can be fascinating, the result is always the same. The truth is… there is no guaranteed way to trade the forex markets. As a result, traders must learn that there are a variety of indicators that can help to determine the best time to buy or sell a forex cross rate. Our indicator definitely does this! This strategy is created by traders fo

Sometimes we need convincing data to make sure our robot, or our indicator goes exactly the way it should be. Sometimes we find out that the data is inaccurate , it can be void , or it has the same data as the previous one . that is why sometimes we find a message on the screen " Waiting for Update ". The system is trying to refresh and reload the data.
The Refresh Charts indicator. This Indicator Utility will solve those problems with just one click . It will refresh and extract data from
Description : Sensor EA MT4 is an advanced Expert advisor for MetaTrader 4, built using the usual signals provided by Bollinger Bands Technical Indicator . The Expert Advisor places a buy order, When price crosses above the lower band, and a sell order when price crosses below the upper band. The Expert Advisor uses a Stop Loss and a Take profit. The Expert Advisor settings are as follows :
( The parameters below can be set according to your trading rules. ) StopLoss ( Stop Loss in pips) TakeP

Circinus 2021 is a versatile algorithm which can use wide range of deposit. Suitable for EURUSD pair. Backtesting showed more than 220% profits in 12 months for initial deposit 100 USD and initial Lot 0.01 (TP_money =10) Backtesting showed more than 140% profits in 12 months for initial deposit 1,000 USD and initial Lot 0.1 (TP_money =10) Backtesting showed more than 140% profits in 12 months for initial deposit 10,000 USD and initial Lot 1.0 (TP_money =100) Circinus 2021 is combination of
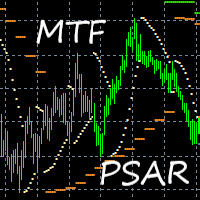
This indicator gives you the PSars for multiple time frames: M1, M5, M15, M30, H1, H4, Daily, Weekly, Monthly. Features Alert function for current Psar. Good results on M5. How to use: Download M1 history for testing. Hover over the different colors to see different timeframes. Simply attach to any chart. Take note of higher time frames before entering trades on lower time frames. (Zoom the H1/H4/Daily chart out completely) Sell when Multiple PSars cross above the price. Example: M1-M5-M15-M30-H

SETTINGS ORDERS COMMENT SHOW PANEL
FIXED LOT MONEY MANAGEMENT MAS SPREAD
TAKE PROFIT STOP LOSS
CLOSE MIDLE LINE INVERT ORDERS TIME FRAME( CURRENT) PERIOD
APPLIED PRICE ( CLOSE PRICE ) ATR PERIOD
ATR MULTIPLIER MAX HISTORY BARS ACTIVE TRAILING
TRAILING INIT
TRAILING START
TRAILING STEP
USE MART ( TRU FALSE) ORDERS DISTANCE
TAKE PROFIT
LOT MULTIPLIER
LOT INCREASE MAX ORDERS NUMBER LOT INCREMENT TYPE
LOT REPETITION START HOUR
END HOUR


Clidro FX is a complete trading system designed and developed by Auxrum Analytics targeting the EURUSD, USDJPY, and GBPUSD FX pairs. It is currently available to MetaTrader 4 users. The Clidro FX algorithm, along with the optimized money-management and order-management rules sets up the basis for excellent trading results consistently over an extended period of time. The fundamental premise of the system is that each FX pair displays its unique quantitative characteristics while oscillating thro

This is a trading robot to work mainly on the EURUSD pair, with H1 timeframe . It uses a robust strategy that combines the strength of the Bears Power, Force Index and Envelopes indicators through a scalping system that will give you excellent results. Backtest now! Special OFFER for this week Discount price - $ 49. Next price $ 149. BUY NOW!!! Are you tired of trading systems that work only in backtesting? Would you like an EA that works well on live accounts? Collect fortunes with t

THE SCALPER SIGNALS BUY AND SELL ENTRIES / REENTRIES , BASED ON THE PRICE ACTION OF BARS
IT HAS MULTIPLE MODES AS SELECTED , Which will provide different price action signals . The Signals are further filtered using Higher Time Frame Trend Analysis. For Example - (1) The Signals Of reversal points entries of the Higher Time frame can are plotted over any lower time frame , Giving robust signals (2) The Signal Of Lower time Frame - plotted only when the higher time frame is also in th

! register Interactive Broker https://ibkr.com/referral/zhenwei375
Hi! I will be happy if you subscibe to my youtube channel.
# youtube https://www.youtube.com/channel/UC4fZRTNdAcHJMDm71MyMkew?sub_confirmation=1
! First Backtest By Your Self
Broker: ICMarkets Raw Spread Account
Works On D1 TimeFrame
# Pairs ------------
EURUSD
US500
JP225
USTEC
US2000
SE30
STOXX50 CA60
HK50
# Currently Working On - Signal Services - Stock Scanner(US/JP Stock Currently) If you w

The indicator of tick volumes Better Volume MT4 allows you to assess the general mood of the market and quite accurately catch the moments of the formation of large movements. The indicator is a color arrows on chart window. In the calculation of Better Volume MT4 the Price Action combinations are taken into account, the values of the volumes with the height of columns and color marking are displayed. Input parameters: MAPeriod - period for calculating the moving average for volume; Right_Valu

Balanced Costing - shows signals - can be used with an optimal risk factor. The indicator can be used both for pipsing on small periods and for long-term trading. The Balanced Costing trend indicator uses reliable algorithms in its calculations. Shows favorable moments for entering the market with arrows, that is, using the indicator is quite simple.
Works on all currency pairs and on all timeframes. Of course, the approach to trading should be complex and in order to make a decision, you sho

Индикатор Adapter определяет господствующую тенденцию, помогает анализировать рынок на выбранном временном интервале. Прост в настройке и работает на всех парах и всех временных интервалах.
Индикаторы тренда дают возможность классифицировать направление ценового движения, определив его силу. Решение этой проблемы помогает инвесторам вовремя войти в рынок и получить хорошую отдачу. Для любого трейдера крайне важно правильно определить направление и силу трендового движения. К сожалению, единст

The Direction Arrows indicator tracks the market trend while ignoring the sharp market fluctuations and noise around the average price. The indicator implements a kind of technical analysis based on the idea that the market is cyclical in nature. It catches the trend and shows favorable moments of entering the market with arrows. The indicator can be used both for pipsing on small periods and for long-term trading.

The key difference between the Real Channel indicator and other channel indicators (for example, from the same Bollinger) is that the Real Channel takes into account not simple moving averages, but twice smoothed ones, which, on the one hand, makes it possible to more clearly determine the market movement, and on the other hand makes the indicator less sensitive. Real Channel is a non-redrawing channel indicator based on moving averages.

You can download Dynamic Pulse for free and test the bot in this way by yourself convincing of its capabilities. The bot can be tested on different currency pairs and different periods. The main thing is to set the tester settings as shown in the screenshot for correct testing. You need to trade on timeframes M1-M15. The Expert Advisor is designed for trading on any instrument. It is preferable to test the EA with a broker with five-digit quotes, or even better on the MetaQuotes-Demo server. It

The Search for Reversal trend indicator can be used both for pipsing on small periods and for long-term trading. Indicator showing signals for entry. Displays both entry points and the trend itself. Shows statistically calculated times to enter the market with arrows. Using the indicator, you can optimally distribute the risk coefficient.
Uses all one parameter for settings. When choosing a parameter, it is necessary to visually resemble so that the corresponding graph has an excellent projec

Andromeda 2021 is a high profit algorithm with more than 160% profitable trades in 9 months historical backtest (initial deposit 1000 USD). It usually opens multiple trades per week and closes them mostly within 1-3 days. Andromeda 2021 is combination of EMA, Grid and Martingale algorithm. If you do not like Martingale algorithm, you can change the value of Martingale to 1. Recommended Broker : www.icmarkets.com
Trades The Group of Trade has a fixed Take Profit about 10 pips or 100 dollars a

Arrow indicator without redrawing and delay The indicator shows the best trend entry points on the chart. It is better to use it in conjunction with other trend indicators as a filter. The indicator shows good results on lower timeframes. The signal is generated inside the candle and appears as blue and red arrows. Displays signals at the zero bar
Settings
Step : Calculation of bars in history
Bar : Shows bars in history
Delta : Offset of the signal from the candle

Trade Zone SupDem - индикатор служит для определения зон спроса/предложения. В возможности входят такие функции, как отображение зон уже пробитых, зон к которым цена еще не доходила с момента определения, и подтвержденным, к которым цена уже доходила, но не пересекала полностью. Сами зоны можно определять, как с текущего таймфрейма, так и со старшего. Важно помнить, что если необходимо отображения зон с нескольких таймфреймов, то придется прикреплять к графику несколько копий индикатора, и при э

专家基于两条移动平均线,其中一条用于开仓,另一条用于平仓,每条均线具有单独的设置。
“扭曲”来自这样一个事实,即对于平仓订单,不使用经典条件,如果出现平仓信号,EA 有能力跳过第一个或几个平仓条件,因此增加利润的机会增加。专家还具有最多十个步骤的内置恢复模式,其中,可以在每次潜在损失后增加或减少手数,所有这些都是可配置和可优化的。用户也可以启用或禁用恢复。
默认设置是为 Eur/Usd H1 时间框架构建的,其他设置可以在“评论”部分的第一条评论中找到。
使用 Auto_Lot 功能 - 如果账户余额小于初始账户余额(智能交易首次启动时使用),则不会降低手数;为了重置手数计算(自动手数模式)并实现新的、更小的余额,必须重新启动智能交易。
参数的优化是使用过去 10 年的图表历史、默认设置和“评论”部分中提供的附加设置进行的。 EA 是为处理新开的蜡烛而构建的,然后才进行计算,因此,考虑到在蜡烛的开盘和收盘之间不需要计算这一事实,可以非常快速地对其他品种进行优化。

is a manual tradepanel for the forex market combined with a traderobot which can be switched on and off to open trades based on tradesignals of integrated indicators.
The Signalarea consists of 3 EMA´s, PSAR, Bollinger Bands, MACD, Stochastic, RSI and Gann Hi Lo Indicator.
All indicators can be freely combined on the current chart and two additional adjustable timeframes
to generate the tradingsignals.
All indicators are integrated except the Gann Hi Lo which represents the signalline.
Th
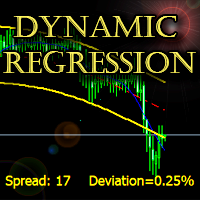
The indicator builds a dynamic regression channel with high accuracy without lagging.
Channel deviation is calculated using a unique formula and displayed on the graph.
Support: https://www.mql5.com/en/channels/TrendHunter
Can be used on any timeframe and any instrument. MT5-version: https://www.mql5.com/en/market/product/64257 Can be used as a ready-made trading system, as well as an addition to the existing one.
Settings: Fast Period - Fast smoothing period; Slow Period - Slow smoo

The Gladiator is my another fully automatic Expert Advisor for the trading on GBPJPY . The Gladiator has been tested from year 2003 to March 2021 on GBPJPY H1. You can download the demo and test it yourself. My test used the real tick data with 99,90% accuracy. Monte Carlo test with 200 simulations used too. All trades are covers by TakeProfit and StopLoss ! Doesn't use Martingale or other dangerous startegies.
This Expert Advisor using fixed lot size, which you can set in settings.
Result

GT_Volume - это универсальный индикатор подходящий для всех валютных пар. Показывает текущий объем на горизонтальных уровнях. Объемы рисуются по мере движения цены. Все просто и нет ни чего лишнего. Индикатор очень помогает быстро определить сильные уровни сопротивления и поддержки, работает шустро! Есть возможность поменять цвет и выбрать день на котором отображать объемы.

Automatic trading system. It includes three very strict algorithms for finding a reversal on large timeframes. It is installed on any timeframe, but for the quality indicators of the visual panel, it is better to set it to H4, you can set it to H1. Optimized for the USDZAR currency pair.
In addition to the usual settings, it is possible to limit trading by day. If the days 1-31 are set, the EA will trade every day.
The Expert Advisor trades by itself, but it is more profitable to use it as
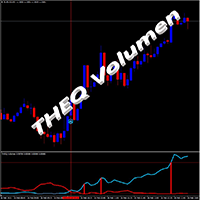
THEQ Volume显示精确的音量振荡器。它可以用来交易跟随趋势或可能的趋势变化。 THEQ Volume还包括THEQ Volume箭头,带有信号和警报的指示器以及用于真实/演示,回测和优化或制定自己策略的THEQ Volume EA。 付款后,其他指示器和Robot EA分别发货。 THEQ Volume不会重新粉刷,没有滞后并且蜡烛关闭时信号永远不会消失。 它还具有预信号,可以准备好并快速进入市场。 手册,最佳设置指示符和EA随时随地为您提供支持和帮助。新版本始终包含在第一笔付款中。 尖端: -使用最准确的方法(技巧)对EURUSD对和M5 TF的最近5年进行回测,以验证您购买的内容与屏幕截图和视频相同。 -检查EA是否不读取历史记录数据。 -最好在模拟账户中运行EA一周,以检查一切是否正确并熟悉指标和EA。

Oakbot Grid Trading Series14 is a safe and high profit algorithm with more than 100% profitable trades in 5 months historical backtest. It usually opens multiple trades per week and closes them mostly within 1-3 days. NO m artingale in this algorithm Recommended Broker : www.icmarkets.com
Trades The Group of Trade has a fixed Take Profit about 10 pips or 5 0 dollars and Stop Loss set from the beginning. Although the values can be changed, it is recommended to keep the default values to get t

该EA拥有一系列可完全自定义的条形,然后在超出该范围的范围内将进行买卖。达克斯以其高波动性和巨大的突破而闻名。用户可以设置平台将锁定在哪一点以维持收支平衡以保护交易。通过定义的止损和获利,该EA确实捕获了这些动作。它可以用于其他指数或外汇,但是我还没有测试过,Dax是我使用此EA的主要指数。 它经过简化以使您更容易理解参数的作用。 包括的参数有: -SR_Shift =要创建范围,您不能使用当前柱线,因此您可以向左移动x柱线数量以开始范围计数 -SR_BAR RANGE =给出范围内的总柱线,因此,例如,如果SR移动设置为1且SR柱线范围设置为5,它将从当前形成的柱线中减去5个总柱线,并创建蓝色支撑和阻力在该特定范围内的条形图。 -SL点=止损 -TP点=获利 -TOD从小时/分钟= EA开始的时间,以小时和分钟为单位 -TOD结束小时/分钟= EA结束的时间,以小时和分钟为单位 -交易量=起始手数默认设置为1 -声音警报=当交易打开时被通知警报 -最大未平仓交易=任何时候都有最大未平仓交易,这可以防止过多的连续交
Fundamental Signals Indicator is a Non-Repaint Indicator with a powerful calculation engine that can predict market movement over 3000 pips (30000 points). The indicator does not analyze the market fundamentally, it is named fundamental because it can predict trends with large movements, no complicated inputs and low risk. Also Indicator can alert on market trend changes.
Using Indicator :
The Indicator is very simple and without complicated input parameters. (No need to optimize anythin

Indicator for working with a Trend. Trend is your friend! The digital indicator helps to find the optimal points of entry into the market, to stay in the trend as much as possible. If the trend and direction change, exit the position in time. The indicator is recommended for use on timeframes H4 and higher. Works on any trading instrument. The indicator menu contains options for fine tuning the signals and color gamut. Happy trading!

NEW PRICE!!! ONLY $59!!! (for few days)
Sale, price $ 299 !!! The next price is $ 349.
Real Account Monitoring: https://www.mql5.com/en/signals/972137
Automata Forex Robot presents: ATLAS EXPERT If you're the type of person who likes being in control and carefree at the same time, then look no further, because we have the perfect EA for you.
We do the hard work for you. Our "set it and forget it" EA is:
Highly Profitable
Simple to use
Come with ready-made settings
User frie
A dealer with simple logic of opening orders and reliable closing control for advanced.
The input signal is determined by only one indicator.
Closing occurs on target profit.
When drawdring first orders, the following appears.
Maximum number of orders - no more than three in each direction.
Settings for configuration:
----------- Trade Settings ----------- Quantity Lot 1 - the size of the first transaction Quantity Lot 2 - the size of the second transaction in the series Quantit

VICTORY-FX 5 copy of 20 left at this price Next 10 copies $499, then $1299. THE VICTORY-FX is a fully automatic Scalping Expert Advisor based on the banks servers data and the market price action manipulation.
95% of investors often blame market manipulation as the primary reason for their lack of success, which is RIGHT. The main market players are the largest banks in the world, and they form the exclusive club in which most trading activities take place. This club is known as the inter

The Secret Channel is an extended version of the Bolinger Bands. For those who use konals when trading. For this indicator to work, a moving average with a MAPeriod period is taken - the number of bars for analysis. As a result, two channels will be built, one shows the limit of the price in 70% of the time for the selected number of bars, the other shows the limits of the price 90% of the time for the selected number of bars. The channel calculates the limits within which any indicator or price
The indicator works on the principle of drawing buy and sell arrows, based on the signals of the built-in algorithm. The indicator definitely needs a flat filter. This indicator will take trading to a new level. Works on all timeframes and currency pairs. It is advisable to use the indicator in conjunction with other tools for more reliable signals and making a more balanced decision.

This FX indicator shows exactly when you need to buy or sell a position and is based on moving average indicator (golden cross and dead cross). If a golden cross or dead cross is detected, arrows will appear and an alert will sound. If you see the up arrow , the price will go up . When there appear down arrow , the price will go down . So you can decide easily buy or sell based on the information which you can gain from moving average! You can adjust the period in parameter settings. Default nu

The indicator works on the principle of the difference between two oscillators. You can set the periods for the fast and slow oscillator, as well as the position relative to the given level. This indicator will take your trading to a whole new level.
Settings: FastPeriod - fast oscillator period. SlowPeriod - the period of the slow oscillator. LevelSignal - signal level. Index - the bar from which to take data, 0 - the current bar, 1 - the previous one.
The indicator works on all timeframes

交易者工具箱是一種多功能工具 基於對常見交易策略的廣泛培訓而創建,以使這些策略和計算自動化。 (由Jason Kisogloo設計和編程) 特徵: 19個獨立信號 -這些信號 中的 每個信號 都 以神經網絡樣式配置進行偏置,以構成最終/整體結果。 每個信號都有其自己的設置 ,可以根據 需要 對其進行 自定義或優化。 綜合上 - 屏 - 顯示 -六搭扣,全面的信息和工具提示走板。 (單擊面板邊框可折疊或折疊...自動為每台儀器保存的設置): 信號面板 -顯示帶有偏差信息和信號詳細信息的信號分析。 新聞小組 -和未來甚至有消息 牛逼 小號 基於 預測 的 影響與倒計時事件當前的儀器。 ( 針對此功能,必須將 內部M T 5經濟日曆與 外匯工廠刮板的 選項 -https: // www.forexfactory.com 添加到Metatrader中允許的網站上) EA設置面板 -根據止

Automatically closes orders when profit per lot or total profit reaches your specified level Per a lot : The amount of wins per lot in the selected symbol. Each orders is calculated as 1 lot. Example: If EURUSD total lot is 2.05 and earnings per lot is $ 100, then 100 * 2.05 = 205 $.
Orders will be closed when EURUSD has a total profit of $ 205. When the total of all orders on the selected symbol reaches the specified amount, it closes all orders belonging to the symbol.
For example: There are

The EA's strategy is based on the price movement from the support line to the resistance line, as implemented in the indicator: https://www.mql5.com/en/market/product/27135 Each position has a stop loss and take profit. BONUS: I will provide all buyers with an absolutely free trading expert for working with gold: https://www.mql5.com/ru/market/product/61919 To get it, after the purchase, write me a Private message, please. The EA does not use a grid and martingale system. Support: https://www

>>>>>>>>>>>>>>>>>>>> 60 % discount ( 150 USD >>> 89 USD) , special for10 buyers ( 2 left) <<<<<<<<<<<<<<<<<<< EA GOD is an expert advisor specializing on EUR/USD to maximize profit by 10-20% per month. Martingale is a strategy of EA GOD which NEVER Margin Call for 5 years backtest 99.9% accuracy with tick data suite. Minimum Deposit: $180 Profit: 10-20% per month Strategy: Martingale Time frame : M1 Backtest: 99.9% accuracy with tick data suite Setting Start Lots: Start lot Step: Dist

️️️️️ Mr Fibonacci Robot Mix Ichimoku And ADX ️️️️️ Best time frame M5 .
Change Lot Size to 0.01 for Martingale Mode.
Manual PDF of Robot
Buy "Mr Fibonacci Robot " at 325$ and receive 1 indicator for free (* for ONE trade accounts)
THIS IS GIFT : https://www.mql5.com/en/market/product/71392
This Is a a full feature pro version - You can enjoy free version HERE ️️️️️ Dear friends who bought our robot, please update to the new version. ️️️️️

Fibonacci Retracements Pro The Fibonacci Retracements Pro is a powerful yet easy to use indicator. It automatically plots all the important Fibonacci retracement and extension levels for you. FRP is dynamic powerful and seamlessly adjusts to whatever timeframe you are analyzing. Fibonacci Retracement Pro is optimized for ALL timeframes and ALL Currency pairs, Indices, Commodities, and Cryptocurrency pairs. Trade with improved confidence and maximize your success rate. Benefits Dynamic and Power

蜘蛛投資
EA剝頭皮和對沖
該EA數據庫包含以下類別的預測:
世界金融組織,銀行,網站,評級機構。
此Ea專為交易貨幣和XAUUSD而開發
*推薦時間範圍:5M。
*推薦:RSIMAXFXCORE90,RSIMINFXCORE20。
*它使用剝頭皮和對沖。
*默認設置是經紀人接受以0.01手交易指數和貨幣的好設置
*最低存款要求為200美元。
*最低建議餘額為1000美元。
*注意:與以下產品有關,使用本產品獲得的結果可能會有所不同:
1.與用戶進行交易的經紀人
2.槓桿水平
3.每個用戶的風險等級
4.必須為每個代理,每個用戶調整配置。
建議在使用任何真實賬戶之前先在模擬賬戶中進行測試。
Spider Invest
EA Scalper and Hedging
This EA database contains forecasts for the following categories:
World Financial Organizations, Banks,

Most often, a good trend is visible on a price chart visually. But an experienced trader should clearly understand the current balance of power in the market before entering. The Trend Regulator indicator will help the trader to make decisions by helping him with the appropriate signals. The intelligent algorithm of the Trend Regulator indicator shows the points of potential market reversal. A strategy for trading with the trend, filtering market noise and all the necessary features built into o

Schrodinger Channel is a non-redrawing channel indicator based on moving averages, it takes into account not simple moving averages, but twice smoothed ones, which, on the one hand, makes it possible to more clearly determine the market movement, and on the other hand, makes the indicator less sensitive. Signals are not redrawn and can be used immediately after they appear. This means that there is no need to wait for a new confirming bar. The lower and upper bands are used as support / resista

The Trend Goblin indicator identifies the mainstream trend. They help to analyze the market on a selected time frame. Easy to set up and works on all pairs and all time frames. Trend indicators provide an opportunity to classify the direction of price movement by determining its strength. Solving this problem helps investors enter the market on time and get good returns.
It is extremely important for any trader to correctly determine the direction and strength of the trend movement. Unfortuna

The Arrows Forecasters indicator is simple, visual and effective trend detection. The intelligent algorithm of the indicator determines the trend with a good probability. Uses just one parameter for settings. The indicator shows the points of potential market reversal. Ready-made trading system.
The indicator does not redraw and does not lag. Works on all currency pairs and on all timeframes. You should remember that using a combination of forecasting tools, it is advisable to choose 2-3 indi

Active Channel is a non-redrawing channel indicator based on moving averages. The key difference between the Active Channel indicator and other channel indicators (for example, from the same Bollinger) is that the Active Channel takes into account not simple moving averages, but twice smoothed ones, which, on the one hand, makes it possible to more clearly determine the market movement, and on the other hand makes the indicator less sensitive.
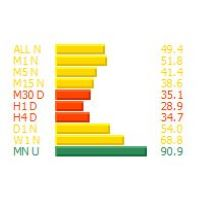
This MT4 indicator, Rsi Visual MTF, summarize the oscillator values in color graphic in current market emotion stage which will show you in multi timeframes (9) and sum of the total Rsi oscillator values which is an important information for traders especially you can see all oscillator values in visualized graphic easily, Hope it will be helpful tool for you for making a good decision in trading.

The Point Transition trend indicator is based on price divergence. If you do not have your own trading strategy yet, you can use our ready-made trading strategy. The indicator will help in finding entry points when analyzing the price chart. The indicator displays information in a visual form. Has one Length parameter. It can be used as a filter in trading. The indicator can work both for entry points and as a filter. Do not forget that the approach to trading must be complex, additional informa

My Expert Advisor trade Bitcoin on M30 time frame, Base on Bollinger Bands indicator, stop loss 25 usd/0.01 bitcoin take profit 17 usd/0.01 bitcoin (0.01 lot) Totally, my EA win 89% and loss 11%. Min deposit: from 200 usd Recommended deposit: 400 usd Broker 5 digit, stop loss = 250000, take profit: 170000; Profit: 25%-35%/month. Draw Down: < 35% Input Setting to test my EA: - Lots: 0.01 - Stoploss: 25 usd/0.01 bitcoin or 2500 usd/bitcoin depend on your broker and your account ( adjust to

This MT4 indicator, Stochastic Visual MTF, summarize the oscillator values in color graphic for both Main and Signal in current market emotion stage which will show you in multi timeframes (9) and sum of the total Main and Signal oscillator values which is an important information for traders especially you can see all oscillator values in visualized graphic easily, You can add more by Shift, Hope it will be helpful tool for you for making a good decision in trading.
Reborn master
The MT4 indicator finds turning points for entering trades. Works without redrawing and delays!
The indicator ideally determines the points of the beginning of a trend or correction for entering trades for currencies, crypts, metals, stocks, indices.
The first 10 sales will be with a 40% discount, then the price will be without a discount
Benefits: Signals are not redrawn! and are shown at the moment of appearance, and since the signal can appear at any time, the indica

TRENDIEST TREND LINE ️️️️️ Do you want to become a constantly profitable 5-star forex trader? ️️️️️
Trendiest Trend Line is a one of a kind trend line indicator, Trend lines work until the market reverses or consolidates. Easily stay out of the chop and stay in the long trends!
Key Features of Trendiest Trend Line Stay in strong trends longer with confidence Clearly shows you when the market is ranging to save you money Entry signals help you get in at a good price 100% reliable

The Trend Display is a nice additional Tool to identify the current trend of the pair you want to trade.
It shows you the direction of the trend in the separate charts.
That way you have a nice overview of the direction in one chart.
You do not need to swap between each time frame to identify the trend.
I wish everyone the most possible success when trading FX. Thank you for using that Indicator.

This is a trading robot to work on USDCHF - Timeframe H1 . It exploits a statistical advantage produced in the Swiss franc. All trades with SL and TP. Backtest now! Special OFFER for this week Discount price - $ 49. Next price $ 149. BUY NOW!!! Would you like to see how 100 dollars turn into more than 3 million dollars? Do you already have a robust strategy that works on USDCHF ? TC Poseidon EA is the god of the seas, water, storms, hurricanes, earthquakes, and horses. Use its power to

"Support or Resistance Alert Broken" is a simple and very intuitive tool that allows you to create or eliminate horizontal and trend supports and / or resistances with a simple click.
When the support or resistance line is broken by the closing price at the end of the current candle, the "Support or Resistance Alert Broken" tool will send an alert with sound, as well as a notification to the MT4 or MT5 mobile application. This tool can send alerts from multiple pairs at the same time. Utility

你的籃子
您能做的最好的事情就是保護您的訂單免於虧損。 您現在可以放心,讓 UR Basket 來處理它。
使用 UR 籃子的優勢:
所有參數都可以在圖表的圖形面板中動態更改 - 您無需重新啟動 EA 即可更改參數或調用您使用的設置! 您可以通過以下方式跟踪您的訂單: - 幻數 - EA評論 - 以上兩者 -一次完成所有交易 UR Basket 可以通過您的貨幣價值、PIPS 或您的餘額或淨值的百分比來跟踪您的利潤。 圖形面板始終顯示您在這三種方法中的利潤,並刷新您告訴他的頻率。 最大優勢:鎖定利潤,不虧本! 下面詳細介紹它。 有一個特殊的電報聊天,您可以在其中了解最新的工具更新,如果您覺得缺少什麼,也可以發送請求!
為什麼選擇 UR 籃子?
有很多 EA 可以自行交易,或者需要您盡可能多地關注獲利的優秀手動策略,但這些都不是防彈的突然變化或經常發生的“鯨魚攻擊”。 因此,這個籃子讓您可以跟踪所有交易,鎖定您的利潤,這樣您就不會失去您已經建立的東西,並儘快關閉交易並確保您不會陷入負值。 圖表上的設置也由用戶動態更改,因此您無需在每次要更改值

This EA implements a fully functional trading strategy designed to trade Gold (XAUUSD). The EA takes advantage of the COMEX price manipulation during the New York session, by buying dips on the Asian session and closing all exposure before the New York session begins. [ Installation Guide | Update Guide | Troubleshooting | FAQ | All Products ]
Easy to set up and supervise No indicators or hard analysis needed The strategy is timeframe-independent It blends a fundamental approach with a technic

MuskBTCUSD Work mainly on BTCUSD , in Timeframe M5 . The EA used Moving Averages Indicators. Moving Average with input parameters: : MaximumRisk = 0.02; // Maximum Risk in percentage DecreaseFactor = 3; // Descrease factor MovingPeriod = 12; // Moving Average period MovingShift = 6; // Moving Average shift
if you can not run a backtest, Please see the historical back test screenshot.
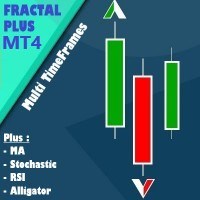
Fractal Plus is a trading tool in the form of an expert advisor. I n it there are 1 indicators that are position execution and 4 indicators that function as filters. You can choose whether each indicator is active or not, it can even be combined according to your trading needs. All filter indicators have multi timeframes options.
Indicators as execution position: 1. Fractal
4 Indicators as Filter: 1. Moving Averages 2. Stochastic Oscillator 3. RSI 4. Alligator
Parameter Information: - Lot

All In Max Volume. Buy or Sell as much as you can. This expert opens positions until you run out of free margin. Positions are opened in the order of max possible lot size down to the min possible lot size (e.g 1 lot size positions, then 0.1 lot positions, finally 0.01 lot positions). 1. Drag and drop Expert to desired chart 2. Select buy or sell in the input parameter. 3. Expert will execute and exit automatically when done.
MetaTrader市场是 出售自动交易和技术指标的最好地方。
您只需要以一个有吸引力的设计和良好的描述为MetaTrader平台开发应用程序。我们将为您解释如何在市场发布您的产品将它提供给数以百万计的MetaTrader用户。
您错过了交易机会:
- 免费交易应用程序
- 8,000+信号可供复制
- 探索金融市场的经济新闻
注册
登录