适用于MetaTrader 4的付费EA交易和指标 - 142
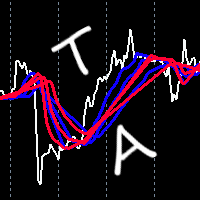
This indicator takes input from the Alligator indicator. Great for scalping. Great for identifying new trends. This indicator can be used on all time frames and pairs. Features alert functions.
Parameters: Alerts JawsPeriod JawsShift TeethPeriod TeethShift LipsPeriod LipsShift
How to use: Simply attach to any chart with default settings. Sell when all 3 red lines cross above white line. Buy when all 3 blue lines cross below white line.
Best results when checking the higher time frames (3 or

Smoothing Oscillator is an ea based on the Smoothing oscillator indicator. https://www.mql5.com/es/market/product/59187 This ea uses the indicator's trend exhaustion signal to initiate a countertrend strategy. The system has a costly lotage, although it can have more than one operation open at a time It does not require large capital or margin requirements to be operated.
You can download the demo and test it yourself. Very stable growth curve as result of smart averaging techniques.
"Saf

The Expert Advisor trades on a trend reversal on any instrument and timeframe. Testing was carried out on the H4 timeframe. Trades are not frequent and therefore, to increase the number of trades, it is advisable to put on several instruments. To control the number of simultaneously trading advisors, a limit for trading symbols is set and advisors must have the same order comments. Closing deals can be done in virtual mode (preferably). There are information and statistics panels. Indicator base

Советник торгует EURGBP. Уникальным свойством EURGBP является снижение активности торгов на американской сессии, которое объясняется отсутствием в составе инструмента USD. Пара малоактивна с 19-00 до 9-00 – этот промежуток в три раза больше, чем у традиционных для ночной торговли азиатских валют. Кросс-пары в отличие от долларовых валютных инструментов слабо реагируют на новости США, что позволяет в разы снизить ложные срабатывания стопов и проскальзывания. Таймфрейм: M5 Минимальный депозит: $3
This indicator (translated from the Japanese source) automatically identifies authentic Japanese candlepatterns (Japanese Sakata Gohou rules) and displays with arrows the following Japanese candlestick patterns:
BEARISH AND BULLISH ENGULFING CANDLES (known as Tsutsumi in Japanese) BULLISH THREE WHITE SOLDIERS BEARISH THREE BLACK CROWS BEARISH EVENING STARS BULLISH MORNING STARS THREE LINES THREE INSIDE DOWN (marks with a box) THREE INSIDE UP (marks with a box)
You can switch off or on to hav

This indicator takes input from the ZigZag and ADX indicators, combined with a special trend algorithm. You also get a Moving Average on the chart to determine trend direction. Great for scalping. Perfect for channels. Features alert functions. BulletPeriod. Parameter TrendLinePeriod for the MA line. Change to your preference. Try 200.
How to use: Simply attach to any chart. Sell on red bullets, with red MA line above price. Enter on bullets closest to this line. Buy on blue bullets, with blue
基于ADX指标的ea交易。
对于专业。 ECN账户,也适用于ECN。有一个鞅。
EA使用WPR和ATR过滤器打开交易。
ind_name="========ADX=========";
Sdelok=4;//交易数量
魔法=2021;//魔法
手数=0.1//手数
MaximumRisk=5//风险
DeltaCur=1000;//止盈
止损=0;//止损
.............. 周期=26;//ADX周期
阵容=30;//走廊的上边界
阵容=25;//走廊的下边界
lineDn=15;//Adx和(DI+//DI的交集-)
opentype1=true;//按类型1打开
opentype2=true;//按类型2打开
!!!

Smoothing Oscillator , is a powerful indicator that vibrates along with the market, resulting in a very useful tool to improve and decide your trading. This indicator is a smoothed version of the Super Oscillator MT4 that you can download at this link https://www.mql5.com/es/market/product/59070 The idea of this indicator is to smooth and limit the aggressiveness of the previous indicator, it has less power in terms of pullback points but has more power to detect trends and consolidation

American traders say: “Trend is your friend”, which means “Trend is your friend”. And indeed it is! By trading with the trend, you reduce your risks and gain an advantage, as you increase the mathematical expectation of completed trades and, therefore, earn more profit. Together with the Going straight indicator you will trade with the trend with ease! This is one of the most effective ways to deal with market trends.
Trading strategies using the channel indicator belong to the classic method

MEDUSA X is a Revolutionary Momentum and Pullback Algorithm Expert Advisor, specializing on the low spread major pairs, GBPUSD. This EA trades frequently during the day if there's a valid signal.
Real Signal: https://www.mql5.com/en/signals/1681843
Extremely EASY-TO-USE, with TREND EMA, RSI, Volatility filters all highly optimized at the backend.
Most of the time, the trades will TP 5pips with single entries. Like a experienced human trader, It utilizes additional Grid averaging tr

ActInvest is a customizable robot that can be adapted to work on any timeframe and any financial market. The robot is based on mathematical logic and an enhanced version of Martingale. It has powerful tools to reduce losses. It can trade one or both directions at the same time. It can be used in correlation with manual trading as well. Can be used in all timeframes and with all forex pairs. With the proper settings it can also be used for metals (including gold), indexes, or even stocks. There i
Fibonacci Level start form price Open as zero number. then do Fibonacci line offset on above and to below, base last Day High Low Fibonacci Percentage.
With ADR Label for measure maximum and minimum pips running limit. Using ADR 5 days, ADR 10 Days, ADR 20 Days and ADR 50 Days.
On current running price, there plot two line boundaries, are current High line and current Low line, with percentage running pips.
Please see attachment pictures for more information.
Regards
ATRenko Indicator
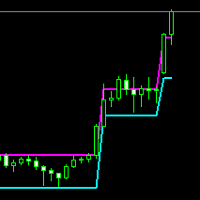
ATRenko is an indicator and I think it works better on the daily chart. Indicator draws 2 lines; Upper band line and lower band line.
If the price is between two bands, it means that there is no trend or the previous trend is continuing and there is a consolidation process. There are two indicator inputs that can be changed by the user.
1. ATRenko Period
It is 10 by default. It determines in how many bars the calculation will be made in the selected timeframe.
2. Katrenko
Arrow indicator of trend reversal with 2-level signaling and multi timeframe. The indicator line consists of 4 colors, indicating the divergence level and possible trend reversals. Light arrows indicate a weak trend, dark arrows indicate a strong one. Sensitivity levels and steps are set in the settings. Signals are output to the mailbox and mobile terminal.

Working with the Smart Analiz indicator is very simple - you just react to the arrows that the indicator reflects, that is, the arrow is a command for action. The indicator signals are accurate enough and you can trade using this information! The indicator builds a very high-quality channel in which it generates entry signals! Which is the ideal strategy for a trader as the trader is always hesitant when choosing a strategy to work with. That is, this indicator will allow you to solve the dilemm

The indicator builds a graphical analysis based on the Fibonacci theory.
Fibo Fan is used for the analysis of the impulses and corrections of the movement.
Reversal lines (2 lines at the base of the Fibonacci fan) are used to analyze the direction of movements.
The indicator displays the of 4 the target line in each direction.
The indicator takes into account market volatility.
If the price is above the reversal lines, it makes sense to consider buying, if lower, then selling.
You can op

Telegram Signals MT4 is an utility helps to instantly publish your trading in the Telegram channel. If you have long wanted to create your Telegram channel with FOREX signals, then this is what you need.
Telegram Signals MT4 can send messages:
Opening and closing deals; Placing and deleting pending orders; Modification of stop loss and take-provit (last order); Triggering stop loss and take provit; Activation and removal of a pending order: Sending trade reports; Sending a message with rep
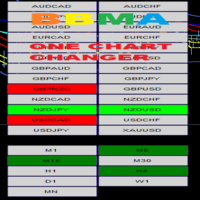
This is Mini Dashboard of BBMA with Reentry Signal and Trends. *More convenience to change any symbols in One Chart. *Multipairs and Multi Timeframe
Reentry Signal : Are based on BBMA Method . You can select any Time Frames to scan the current signals of Reentry. RED BUTTON = REENTRY SELLS GREEN BUTTON = REENTRY BUY
Trends : Multi Time Frames Are based on BBMA Method. GREEN BUTTON = TREND UP RED BUTTON = TREND DOWN.
Inputs: MultiPairs : any list of symbols. Options to attach indicator on
This Relative Strength Index version using four different Period. Calculate on Timeframe M1, M5, M15, M30, H1, H4 and D1. Each using median price for valid average calculation.
How to use this indicator, as follows; 1. This indicator design for FOLLOW THE TREND, not using for Overbought or Oversold, but if you want to use it as Reversal trades, is up to you. 2. You can see on pictures attachment, it produce three type of signal, LONG, SHORT and SIDEWAYS. 3. Recommended for trading, Open trad

Professional Scalping EA is an automated professional scalping Expert Advisor designed to work in the FOREX market . The strategy uses the relative strength index ( RSI ) and the average true range ( ATR ) in order to determine the best entry points into the market. Advisor is suitable for both experienced traders and beginners. The most volatile pairs are suitable for work: GBPUSD, USDCAD, EURUSD, USDJPY, USDCHF, AUDUSD, NZDUSD .
Recommend ECN broker with LOW SPREAD: IC Market , Exness,

The Expert Advisor works on sharp price movements; it can apply open position locking and pyramiding. Virtual stops are used (take profit, trailing stop), to limit losses, order locking and stop loss are used in% of balance. At the same time, several dozens of orders can be opened and the advisor will need free funds to exit the locks and close all positions for total profit, this should be taken into account when choosing the number of instruments for trading.
The work of the adviser does not

Forex Daily Scalping EA is a professional scalping advisor for daily work on the FOREX currency market. In trading, along with experience, traders usually come to understand that the levels of accumulation of stop orders, price and time play a significant role in the market.
Recommend ECN broker with LOW SPREAD: IC Market , Exness, NordFX , FXPRIMUS , Alpari , FXTM
PARAMETERS: PRICE - the price distance to be covered in the allotted time period; TIME - time allotted in seconds; HL_PERIOD -

Price Fluctuations EA is an advisor w ithout indicator advisor to accelerate the deposit , it works on price fluctuations, and has the function of reducing the drawdown on the account by overlapping unprofitable orders. The chart displays information about the profit.
OPTIONS: DISTANCE - distance that the price must travel in N seconds; TIMER_SEC - timer in seconds after which the distance will be updated; START_LOT - initial lot; LOT_MULTIPLIER - lot multiplier in the order grid; MA
One Shoot Expert Advisor. This expert advisor was designed specifically for the USD / JPY Forex market. Its operation is based on a multi time frame moving average strategy, so it can be classified as a trend expert. When the trend has consolidated on one direction the algorithm buys or sells the currency pair. In the event of a trend inversion, there is a fixed stop loss, while the take profit is variable with the trailing stop function. For this reason the platform must always be connected to

When Metatraders trades many currency pairs, it's not easy to see the full information. This indicator is very comfortable and easy to see the current transaction. You can confirm this information and determine the type of order (SELL/BUY) for further transactions. If you use this tool, you probably won't be able to make orders without it. Also, you can easily see the sharp changes in total profits.

The considered bot Your Scalpel is a scalpel with all that it implies. The description of the bot will be very concise and to the point, namely, the principle of operation and parameters for setting up an Expert Advisor. The scalpel expert uses very flexible settings. The bot can work with a deposit of $ 100, which is not unimportant. The bot offers full control over the environment parameters, all the necessary settings will be described below. The work takes place on the periods M1-M15.
The

Hello and welcome to Parabolik EA developed by OPTIMIZFX!
Parabolik EA was created to take advantage of the Parabolic SAR and uses Moving Averages to determine the Correct Trend for entry. Parabolik can be used on any time frame and any pairs, the higher the time frame (1H to 4H) the better the entry but the slower the profits. M5 is recommended, M1 you can expect poor entries, the recovery system makes up for poor entries.
3 WAYS TO TRADE PARABOLIK EA - FIXED LOT SIZE | Leave Multiplier ON
Super Oscillator is an ea based on the super oscillator indicator. https://www.mql5.com/es/market/product/59070 This ea uses the indicator's trend exhaustion signal to initiate a countertrend strategy. The system has a costly lotage, although it can have more than one operation open at a time It does not require large capital or margin requirements to be operated.
You can download the demo and test it yourself. Very stable growth curve as result of smart averaging techniques.
"Safety firs

Reversal Trend indicator, which recalculates values for a new period without changing the previous ones. According to statistics, more than 85% of traders who prefer aggressive trading suffer losses. The rush and desire to make a profit immediately leads them to frequently open orders at random, much like playing in a casino. The bottom line is disappointing: a few trades, possibly, will bring profits and then losses. To understand the dynamics of the market and use it for profit, you need to

This version of the MACD named MACD Platinum is the MACD indicator calculated with ZeroLag moving averages (ZLEMA) .
ZLEMA is an abbreviation of Zero Lag Exponential Moving Average . It was developed by John Ehlers and Rick Way. ZLEMA is a kind of Exponential moving average but its main idea is to eliminate the lag arising from the very nature of the moving averages and other trend following indicators.

T D Sequential indicator consist of two components. TD Setup is the first one and it is a prerequisite for the TD Countdown – the second component.
TD Setup TD Setup compares the current close with the corresponding close four bars earlier. There must be nine consecutive closes higher/lower than the close four bars earlier.
1- TD Buy Setup - Prerequisite is a bearish price flip, which indicates a switch from positive to negative momentum.
– Af

The indicator scans for TD Sequential signals in multiple timeframes for the all markets filtered and shows the results on Dashboard. Key Features Dashboard can be used for all markets It can scan for signals on MN1, W1, D1, H4, H1, M30, M15 ,M5, M1 timeframes Parameters UseMarketWatch: Set true to copy all symbols available in market watch MarketWatchCount : Set the number of symbols that you want to copy from the market watch list. CustomSymbols: Enter the custom symbols that you want to be a

TD Combo is better when you have sharp directional moves, because it requires only thirteen price bars from start to finish compared to TD Sequential which needs at least 22 bars. The criteria for a Setup within TD Combo are the same with those required for a Setup within TD Sequential. The difference is that the count starts at bar 1 of the setup and not from bar 9 and TD Combo requires four conditions to be satisfied simultaneously.
Requirements for a TD Combo Buy Countdown
- Close lower

The indicator scans for TD Combo signals in multiple timeframes for the all markets filtered and shows the results on Dashboard. Key Features Dashboard can be used for all markets It can scan for signals on MN1, W1, D1, H4, H1, M30, M15 ,M5, M1 timeframes Parameters UseMarketWatch: Set true to copy all symbols available in market watch MarketWatchCount : Set the number of symbols that you want to copy from the market watch list. CustomSymbols: Enter the custom symbols that you want to be availa

The Effect indicator shows the points of potential market reversal. Simple, visual and efficient trend detection. Ready-made trading system. The intelligent algorithm of the indicator determines the trend with good probability. Uses just one parameter for settings. The indicator does not redraw and does not lag. Works on all currency pairs and all timeframes.
You should remember that using a combination of forecasting tools, it is advisable to choose 2-3 indicators for trading. Otherwise, the

The Trend Logic indicator provides an opportunity to classify the direction of price movement by determining its strength. Solving this problem helps to enter the market on time and make a good profit. It is extremely important for any trader to correctly determine the direction and strength of the trend movement. Unfortunately, there is no single correct solution to this problem. Many traders trade at different time frames. For this reason, the received signals are perceived subjectively. The

Multiphase is a non-redrawing channel indicator based on moving averages. The key difference between the Multiphase indicator and other channel indicators (for example, from the same Bollinger Band) is that Multiphase takes into account not simple moving averages, but double-smoothed ones, which, on the one hand, makes it possible to more clearly determine the market movement, but, with on the other hand, it makes the indicator less sensitive.
Super Oscillator , is a powerful indicator that vibrates along with the market, resulting in a very useful tool to improve and decide your trading.
You can download the demo and test it yourself.
In a versatile indicator that in a single graph shows us information about four different aspects of the market
1) 4 operational zones. The indicator divides the screen into 4 zones that allows us to properly assess the moment of the market. a) Pullback Buy Trend. If the indicator is above 80,

This indicator automatically plots Yearly High , Yearly Low and Yearly Average price levels from the previous year. It also builds two additional equidistant parallel levels ( Extended Highs R2 , R3 / Extended Lows S2 , R3 ) extended from previous Year High / Low. Extended High R3 / Low S3 is 100 percent Low-to-High extension ( as in Fibonacci 100 % extensions ) above / below the previous Year H/L and is the final reversal level with a sure reaction. Extended High/Low R3/S3 represent the ulti
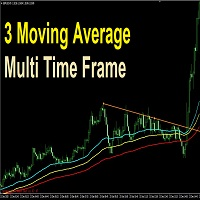
The simplest and profitable strategy is to break the trend of the small time frame in the direction of the big time frame.
3 moving average multi time frame is for those who trade on a 5-minute frame and want to enter with the direction of the hour; Or trade on the hour and want to enter with the daily trend, or the minute with the quarter hour trend.... This indicator draw three moving averages that show the direction of the big trend and help to enter with the end of the correction ,and re

PO-Plus Readme
機能: 3つのロジックでの買いサイン、売りサインを表示します。 各ロジックでの勝率を表示します。
サイン表示後、勝率を確認して高い勝率でBOやFXでエントリーすることが出来ます。
勝率の判定本数を変更できます。
Indicator Noを変えることによるこのインジケータを複数適用することができます。 これによりRCIの数値を変更して勝率を複数表示が可能になります。 その際は、ラベルの表示位置も変更してください。 ボタンを押すことによりラベルや買いサイン、売りサインを表示、非表示すことが出来ます。
注意:こちらのロジックはZigZag+ロジックでの勝率になりますので 勝率は実際のものより高めに表示されます。 エントリーする際は勝率60%以上のものを推奨します。 ZigZagベースなので価格が動く日本、欧州、NY時間の前半でのエントリしない ことを推奨します。
各パラメータの説明: ----------Basic Setting---------- Indicator No:インジケータNoを設定します。もし同じチャート

Implement analyzes market dynamics for pivot points. If you want to learn how to spot the correct reversals for consistently likely profitable trading, buy this indicator. Shows favorable moments of entering the market in stripes. Ready-made trading system.
The principle of operation of the indicator is to automatically determine the current state of the market when placed on a chart, analyze historical data based on historical data and display instructions for further actions on the trader's


Trend Anthropoid is a trend indicator that allows you to effectively determine the direction of the current trend, as well as identify potential reversal points. The indicator makes it possible to classify the direction of price movement by determining its strength. Solving this problem helps to enter the market on time and get the desired result.
Let's start with the benefits. Allows you to determine the current trend. You can quickly understand which trend is currently developing in the mar

The Agency indicator reveals all the main market conditions (trend, retracement in a trend, flat), which allows you to enter the market at any time and use any trading methods and styles. The indicator is a directional system (ADX). The directional system was developed by J. Wilder in the mid-70s in addition to the PARABOLIC SAR system and then developed by a number of analysts. It has two main rows of points. The first row of red dots shows the direction of the sell trend. The second row of gr

The principle is very simple, practical and effective - they are implemented in the Compass indicator, which will help traders to protect their deposit from loss. This is one of the implementations of the indicator for protecting a position from loss. Similar implementations exist, this is not a complex algorithm. The indicator uses a series of moving averages, which, with a given Length step, form the resulting lines that are displayed on the price chart as blue and red lines. These lines are t

Fitpro 10 Scalper Expert Advisor is a automated forex trading robot designed to work on the most traded currency any pair. The strategy is based on using several MT4 indicators , each entry point is calculated using an advanced input filter based on the analysis of the movement of the price chart. Each order is secured by a fixed stop-loss while, no martingale, no grid, scalp or hedge. Paramater • Magic Order - is a special number that the EA assigns to its orders
• Take Profit - take
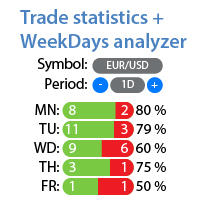
Detailed statistics of your trading for the selected period My #1 Utility : includes 65+ functions | Contact me if you have any questions The utility includes 2 separate tools: Trade Statistics WeekDays Analyzer Statistics display modes: For the selected currency pair/trading instrument Statistics for all trades (" ALL ") You can select the period for which you want to get statistics: 1 day 1 week 1 month 2 months 3 months 6 months 1 year 2 years All trading history 1. Trade Stat

Heikin-Ashi-Sniper is a perfect addition to your portfolio. This is the thirdpart of the Portfolio. It is meant to be traded on USDJPYon H1 Timeframe.
It uses Bollinger Bands to determine optimal entry signals while having a reasonably low drawdown Each Expert of our portfolio uses a different technique to minimize curve fitting and diversify the strategy. More EA´s will be published shortly to complete the Portfolio. The EA Trades not very frequently it waits for the right chance and places t

Heikin-Ashi-Sniper is a perfect addition to your portfolio. This is the second part of the Portfolio. It is meant to be traded on GBPUSD on H1 Timeframe.
It uses Bollinger Bands to determine optimal entry signals while having a reasonably low drawdown Each Expert of our portfolio uses a different technique to minimize curve fitting and diversify the strategy. More EA´s will be published shortly to complete the Portfolio. The EA Trades not very frequently it waits for the right chance and place
DNA is an indicator that allows us to operate both in favor of a trend and a pullback. You can download the demo and test it yourself.
Trend trading is above zero and pullback trading is below zero.
The direction of the operation is marked by the color of the line.
If the line is green it corresponds to purchases.
If the line is red it corresponds to sales.
For example, if the green line is above zero and growing, we will have an uptrend operation. If the red line is above zero and
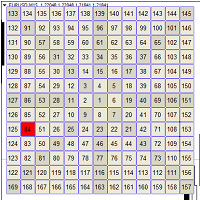
Gunn Chart 江恩广场的价格走势。 计算是相对于当前价格进行的。
在计算中,您可以使用 Digit 和 minus_znak 设置来使用定价的一部分。
例如:当前价格看起来像 - 1.23456,并且 Digit 设置为 _5____,
那么数字23456将参与计算, 对于 _6____ 将是数字 123456
对于 __4____,数字将为 3456
___3___ 的数字将是 456
该 minus_znak设置删除号码定价的权利
例如: Digit 设置为 _5____ 并且 minus_znak 设置为 _0
定价的形式为 23456
在 _1 将是 2345
在 _2 将是 234 要移动方块,您需要使用键盘按键:
向上箭头 - 向上移动方块 向下箭头 - 方块向下移动 向右箭头 - 方块向右移动 向左箭头 - 将方块向左移动 指标设置说明: _width - 以像素为单位的单元格宽度 _height - 单元格的高度(以像素为单位)
_font_size - 文字大小 clr_txt - 文本颜色 clr_back

British-Japanese Wizard This Expert Advisor has been developed for GBPJPY H1 based on Bollinger Bands and pending orders . It has been backtested on more than 17-year long tick data with 99,9% quality of modeling . It has been developed with the help of a genetic algorithm . It is highly stable and durable and suitable for long-term smart trading. I tried several thousand optimizations before I found an EA that is not only profitable in the backtest but has the potential to be profitable in t
Hundreds of possible combinations and only two strategies. By using automated software like an EA, you can benefit from the following advantages: it can trade while you are sleeping, it is not susceptible to emotions and you can quickly run backtests. However, it is hard to ascertain whether an EA will help you to achieve consistent profits. Lots of EAs are profitable on a demo account, but for some unknown reason, when the trader tries to apply it on a live account with their own funds, suddenl

Канал Achieved состоит из двух линий отображающих канал. Линии канала определяются по простому и надежному алгоритму. Канал желательно использовать для торговли внутри канала. Индикатор не перерисовывается и не запаздывает, в основе работы простые алгоритмы. Работает на всех валютных парах и на всех таймфреймах. Как всегда предупреждение, не надо забывать, что подход должен быть комплексным, сигналы индикатора требуют дополнительной информации для входа в рынок.

This PORTFOLIO of 5 strategies has been developed, tested and traded live on GBPUSD M30 TF. Multiple EAs traded together will lead to a bigger profits and smoother equity curve. 5 not correlated EAs logics for GBPUSD M30 merged to a single strategy. Very SIMPLE STRATEGIES with only FEW PARAMETERS. Every trade has his own logic for STOP LOSS. To catch the profits every strategy uses different approach - some has TAKE PROFIT, some uses TIME BASED EXITS or PROFIT TRAILING. EA has been backtested
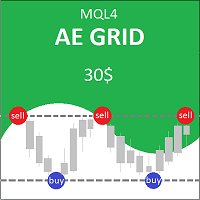
AE Grid is an automated expert advisor that works on the basis of trend and classic grid averaging.
AE Grid was developed, tested and optimized strictly according to the history of 10 years. ( from 2010 to 2020 ) Demo trading account
Features built-in mathematical slip algorithm. The price channel in all time frames. When touching the price channel with a positive balance, it closes all positions in order to avoid a trend reversal. It goes in addition to the ADVISER for Free. Issuing a n

The stocks that make up the index are one of the drivers of the movement. Analyzing the financial performance of all elements of the index, we can assume further development of the situation. The program (script) displays corporate reports of shares that are part of the index selected in the settings.
"Indexes" cannot be tested in the tester (since there is no way to get information from the Internet).
Information is downloaded from the site investing.com: Report Date Earnings per share
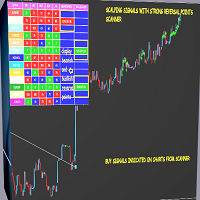
REVERSAL SIGNALS SCALPER SCANNER
Indicator is a multi purpose tool and very useful to know the EXTREME TURNING POINTS of any pair / stock/ commodity. The extreme levels can be input and it will show you when those levels have reached . So that you can plan your EXTREME REVERSAL TRADES . It is a MULTI TIME FRAME TREND ANALYSIS TOOL AND IT WILL suggest probable changes in the trend and swing . It is very useful for day trading , scalping, and swing trading .
SPECIAL FEATURE - CLICK ON THE RE
Dual Trend Scalper
Advantages You Get
Easy, visual and effective trend detection. you can find the IMPULSE COLOR PANEL FOR QUICK TREND DETECTION Gives you the ability to filter and further improve your trading strategies. YOU HAVE TREND DETECTION IMPULSE FILTER , AS WELL AS 2 LEVELS OF SUPERTREND. Enhanced statistics calculation following the entry point, take profit and exit signal. ENTRY CAN BE AS PER VARIATION OF SETTINGS AND PARAMETERS, SL AND TARGETS ALSO CAN BE ADJUSTED Neve
Top and Bottom Scalper
BINARY AND FOREX
The signals indicate strong reversal points (Tops/bottoms)- The indicator gives accurate signals on any currency pairs and instruments. It also has a setting for adjusting the frequency of the signals. It is further strengthened and made robust by the support and resistance zones. There are different qualities of zones as per robustness.
Inputs ZONE SETTINGS; BackLimit - default is 10 000. Check the past bars for formations. First Time Fram
REVERSAL AREA INDICATOR
This Indicator will generate signals on top and bottom of the swings .
It will check for some support and resistance found and generate the signals at such areas. There is high probability of the price moving in favorable directions as they are signals when there is support and resistance . The advantage is that the entries will have small stop loss and high risk to reward ratios as they are near tops and bottoms. 1. This is an indicator that will provid
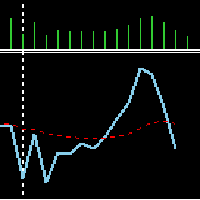
Volume MA This indicator shows selected period of volume and it's moving averages. Easy to use has nothing complicated. It has two parameters input. Volume period: Default is 9 Signal MA: Default is 21 If the blue line is rising, there is an increase in the volume within the selected period. If it is the opposite, it is falling. The dashed Red line shows the moving average of the volume values within the selected period.

You ask yourself the question every time you open your charts: how to win in trading? Will using a lot of indicators work? well know that I also asked myself the same questions when I first started trading. After testing many indicators, I realized that winning trading is simple and accurate trading. after several months of thinking and optimizing I was able to find my solution: Candle Good Setup Candle Good setup is a trend and entry timing indicator analyzing the market in multi-frame to g
---> Check all the other products <---
The Candle Bias is a coloring indicator that doesn't take account of the close price of the bars.
It will color the candle in the bearish color (of your choice) if the downard range is greater than the upward range. Conversely, it will color the candle in the bullish color of your choice if the upward range is greater than the downward range.
This is a major helper for Multi Time Frame analysis, it works on every security and every Time Frame. You

Скрипт вычисляет коды свечей на текущем графике и сохраняет их в CSV файл. Таблица в файле состоит из двух колонок: дата/время свечи и ее код. Подробнее о коде свечи и об алгоритме его расчета читайте в описании к индикатору Candle Code .
ПАРАМЕТРЫ FileName: имя файла, в который экспортируются данные. Если оставить поле пустым, то имя файла - "Candle Code. ' ВАЛЮТНАЯ ПАРА' 'ТАЙМФРЕЙМ' "
Pullback Probability It is an indicator that shows us the probability that the price will t urn around and we can operate that market turn.
The indicator marks a line that oscillates between a percentage of 0% to 100%.
The one indicated in the upper left corner shows us a help in which it informs us of the area in which the price is in real time, as well as the percentage that the candle is open. You can download the demo and test it yourself.
The indicator marks 6 work zones. 1) Ab

Moving Average Grid EA is a grid Expert Advisor. It features several trading strategies based on Moving Average. It works on minute bar Open prices. Virtual trailing stop, stop loss and take profit can be set in pips, in the deposit currency or as a percentage of the balance. Depending on the settings, different orders may be opened for diversifying risks. Their closure can be either an oppositely directed or unidirectional basket of orders. The order grid is adaptive and is made of market order

Adaptive Trading EA is an multicurrency Expert Advisor uses based on a position averaging. Stop loss can be calculated in currency or by drawdown in % of the balance. I recommend that you withdraw your profit regularly! The product is designed for 4 and 5-digit quotes. VPS server is recommended. Timeframes: M30-H4. Recommended minimum deposit – 1 000 units of the base currency.
Setup The EA is launched on several low spread symbols simultaneously (for example, EURUSD, GBPUSD, AUDUSD, USDJPY, U
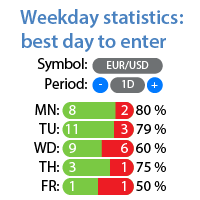
Profit/loss statistics for each day of the week on which the trade was opened My #1 Utility : includes 65+ functions | Contact me if you have any questions Statistics display modes: For the selected currency pair/trading instrument Statistics for all trades (" ALL ") You can select the period for which you want to get statistics: 1 day 1 week 1 month 2 months 3 months 6 months 1 year 2 years All trading history Displayed information: You will see statistics for each day of
学习如何在MetaTrader AppStore上购买EA交易,MetaTrader平台的应用程序商店。
MQL5.community支付系统支持通过PayPay、银行卡和热门付款系统进行交易。为更好的客户体验我们强烈建议您在购买前测试EA交易。
您错过了交易机会:
- 免费交易应用程序
- 8,000+信号可供复制
- 探索金融市场的经济新闻
注册
登录