 MetaTrader 5
 专家
专家
 指标
指标
 程序库
程序库
 实用工具
实用工具
 窗口小部件
窗口小部件
 规则
规则
适用于MetaTrader 4的EA交易和指标 - 361
 EA交易自动执行市场交易,而指标可使您更准确地分析报价并预测价格行为。
通过这些应用程序,您将能够更明智地在MetaTrader 4执行交易,抓住更多的交易机会。
EA交易自动执行市场交易,而指标可使您更准确地分析报价并预测价格行为。
通过这些应用程序,您将能够更明智地在MetaTrader 4执行交易,抓住更多的交易机会。 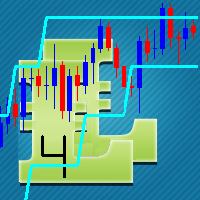
The concept of bands, or two lines that surround price, is that you will see overbought and oversold conditions. The proposed indicator has the ability to increase a smooth-effect in the bands Indicator. This indicator could play an important role in determining support and resistance. nPeriod input parameter determines number of Bars for Moving Above Bands calculation.

The indicator identifies the direction and strength of the trend. Bearish trend areas are marked with red color, bullish areas are marked with blue color. A thin blue line indicates that a bearish trend is about to end, and it is necessary to prepare for a bullish one. The strongest signals are at the points when the filled areas start expanding. The indicator has only two parameters: period - period; offset - offset. The greater the period, the more accurate the trend identification, but with a

The Bears indicator with overbought and oversold zones. Two display options - as a line and as a histogram. A series of OBS indicators (overbought and oversold) - these are indicators enhanced with overbought and oversold zones. This is the standard indicator, but it provides additional possibilities for the analysis of any market. Thanks to a special algorithm, this indicator has overbought zones =70 and =100, as well as oversold zones -70 and -100, which allows you to use it to determine the
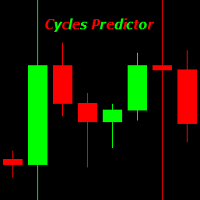
Cycles Predictor Indicator This indicator uses past market cycles to predict future price movements. The indicator scans through past data and considers combinations of cycles. When cycles coincide at the same future date/time then it is considered a valid future prediction. The predictions are drawn as vertical lines on the right side of the chart in the future. A prediction will often result in type of candle (ex. bull or bear) and/or a reversal point (ex. bottom or top) forming at this ex

The script creates account summary report in a separate window. The report can be created for all deals and for deals on selected financial instruments.
It is possible to specify a time interval of calculation and save report to an htm file.
Script inputs
report starting date - initial report generation date. symbols selection for report - select a method of choosing tools for a report generation. allSymbol - report is generated for deals performed on all symbols. onlyCurrentSymbol - report is
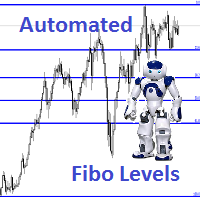
Description Fibo Levels is an indicator that automatically plots Fibonacci levels. The levels are calculated and plotted over a certain interval using the number of bars specified by the user . When the price achieve one of the target levels (23.6%, 38.2%, 50% or 61.8%) the indicator at the request of the user gives a sound signal and/or sends the message by e-mail. Example of the e-mail notification: Subject: Fibo Up Signal Message: Signal,H1 - Correction of EURUSD reached 23.6% - 2014

A moving average is commonly used with time series data to smooth out short-term fluctuations and determine longer-term trends. The proposed indicator has an ability to increasing a smooth-effect. This indicator could play an important role in determining support and resistance. An input parameter nPeriod determines number of Bars for Moving AboveAverage calculation.

Alex 盈利 EA 仅通过挂单交易 EURUSD。挂单放置在重要级别的突破位置。 本 EA 工作于 H1。建议账户类型 - ECN, 建议杠杆 - 1:500。 本 EA 不需要很大本金,并可以从 $50 开始。 每笔交易以停止位保护 (止损和止盈)。仓量依据可用基金数量。 当赢得了最小利润,订单转移到盈亏平衡位,让我们将交易的亏损降到最低。 实盘账户监控: https://www.mql5.com/zh/users/sania2010s/seller Alex 盈利是全自动 EA,并不需要任何交易者的行动。 本 EA 不使用马丁格尔。它需要一个低点差的经纪商和一个 VPS。
参数 TP - 挂单的止盈; SL - 挂单的止损; BBUSize - 盈利点数, 此时止损会移动到盈亏平衡位; BBUSizepip - 盈亏平衡点数大小; Magic - 魔幻数字; UseTrailing - 尾随开关; TrailingStart - 盈利点数, 之后尾随开始; TrailingStep - 步长大小, 每多盈利一步,止损将移动到下一阶段; TrailingStop - 步长大小,

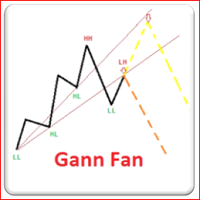
此技术分析的形成,基于市场是呈几何性和周期性的思想。 江恩扇形由一系列称为江恩角度的对角线组成,其中有九条。 这些角度叠加在价格图表上,显示出一组安全的支撑和阻力级别。 结果图像应该能够有助于技术分析师预测价格变动。 虽然曾经以手工绘制,今天江恩扇形可以由软件程序绘制。 此指标绘制的江恩扇形是基于之字折线级别的。江恩有 2 类: 水青色江恩是动态的支撑位; 红色江恩是动态的阻力位。 本指标有助于马丁格尔风格的交易者,寻找良好的支撑/阻力级别。
本产品可以方便用户比较不同图表的K线,还可以方便地查看同一商品在不同时间周期中的K线形态。
将脚本附加到一个图表上,移动K线,或者改变显示比例,所有打开的图表上的K线将与当前的图表上的K线按照时间对齐,并且同步移动。
如果不同图表上的K线的周期不同,将会根据K线的起始时间进行对齐。
使用前请确保相关的历史数据已经下载到本地。
欢迎提出宝贵建议或意见,请与我联系。
。。。。。。。。。。。。。。。。。。。。。。。。。。。。。。。。。。。。。。。。。。。。。。。。。。。。。。。。。。。。。。。。。。。。。。 。。。。。。。。。。。。。。。。。。。。。。。。。。。。。。。。。。。。。。。。。。。。。。。。。。。。。。。。。。。

Индикатор Magneto Weekly Pro отображает: Недельные важные линии поддержки и сопротивления (выделены желтым, красным и синим цветами). Основные недельные цели (выделены белым цветом). Недельные паттерны возврата цены (обозначаются красными флажками). Применение индикатора Magneto Pro можно использовать и как дополнение к существующей стратегии, и как самодостаточную торговую стратегию. Данный продукт состоит из двух индикаторов, работающих на разных временных промежутках, и предназначен для скаль

指标提供良好的信号,趋势反转 或离开该单位时,价格变动的可能方向。
功能和设置: Sensitivity = 3 - (下图中为例)的多个信号的灵敏度为1〜 5 ,较高的值; DeepBars = 3000 - 深度计显示; ZeroBarCalc = FALSE; - 用于在零杆的计算,如果是这样的信号将被使用,但目前的蜡烛结束前可能会消失; UseAlert = FALSE; - 包容警告; AlertSound = TRUE; - 声音; AlertMessage = TRUE; - 显示; AlertMail = FALSE; - 发送消息到邮局; FileSound = “ alert2.wav ” ; - 文件磬;

Bulls indicator with overbought and oversold zones. Two display options - as a line and as a histogram. OBS (overbought and oversold) indicator series - are indicators that have been provided with overbought and oversold zones. This is the standard indicator, but it provides additional possibilities for the analysis of any market. Thanks to a special algorithm, this indicator has overbought zones =70 and =100, as well as oversold zones -70 and -100, which allows you to use it to determine the p

Logarithmic Network - cm-hourglass Expert Advisor The Expert Advisor places orders with a decreasing lot and step in the direction of the trend and with an increasing lot and step in the counter-trend direction. It sets Take Profit for every direction to avoid breakeven of the entire series. The farthest order in the direction of the trend is closed with a farthest counter-order so as to get the positive total, thus pulling the entire network to the price without letting it expand. Parameters Lo

The Force Index indicator with overbought and oversold zones. Two display options - as a line and as a histogram. A series of OBS indicators (overbought and oversold) - these are indicators enhanced with overbought and oversold zones.
Settings OBS Period - overbought/oversold calculation period Force Period - period of Force Price MA - prices for MA calculation Method MA - MA calculation method Line or Histo - display by line or histogram
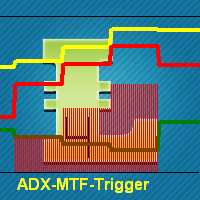
This indicator is using classical indicators: Average Directional Movement Index from the higher TF (which you can set up using input parameter TimeFrame). Yellow line represents the Main Average Directional Index from the senior TF. Green line represents the Plus Directional Indicator (+DI) from the senior TF. Red line represents the Minus Directional Indicator (-DI) from the senior TF. Green histogram represents Up trend. Red histogram represents Down trend.

Features Simultaneous Multi-Signals, Multi-Symbols and Multi-Timeframes. Please message me for ALL settings. I am constantly seeking new signals and improving old ones to maintain and improve the edges in my updates to this EA Extraordinarily robust (wide range of settings produces positive results over long testing periods during optimizations and across different broker feeds and timeframes) Built-in anti-curve fitting features for extremely robust optimizations (Time Dilation testing, Monte C

The Accumulation indicator with overbought and oversold zones. Two display options - as a line and as a histogram. A series of OBS indicators (overbought and oversold) - these are indicators enhanced with overbought and oversold zones. Simple and straightforward settings that are easy to match to the right tool
In the indicator, you can adjust: Display depth of the indicator Color of indicator levels


The indicator allows determining the strength and direction of the trend precisely. The histogram displayed in a separate window shows changes of the slope of the regression line. A signal for entering a deal is crossing the zero line and/or a divergence. The indicator is also useful for wave analysis. Input Parameters: Period - period of calculation, 10 on default; Angle threshold - slope at which a flat is displayed, 6.0 on default (within the range from -6.0 to 6.0); Filter by volume - volume

TimeFilter indicator allows you to visually select bit masks (GoodHourOfDay, BadHoursOfDay, GoodDayOfWeek, BadDaysOfWeek) for the Intraday Time Filter module of trading signals of the Standard Library. The use of time filters allows you to take into account the particulars of each trading session in performing trading operations.

The indicator is an inter-week hourly filter. When executing trading operations, the indicator allows considering time features of each trading session. Permissive and restrictive filter intervals are set in string form. The used format is [first day]-[last day]:[first hour]-[last hour]. See the screenshots for examples. Parameters: Good Time for trade - intervals when trading is allowed. Bad Time for trade - intervals when trading is forbidden.
time filter shift (hours) - hourly shift. percenta

Multicurrency indicator Any chart obs is a price chart with a percentage scale. Can be displayed as a line and as a histogram. There is also a reverse function available, it mirrors the chart. The name of an instrument to be displayed is specified in the input parameters, the current symbol is used on default. The indicator doesn't have lags as it is not smoothed with any formulas, but bound to a percentage scale, what allows detecting the price equilibrium, the overbought and oversold state. Th

This indicator is a combination of 2 classical indicators: MA and CCI. Two moving averages form Upper and Lower bands. The input parameter counted_bars determines on how many bars the indicator's lines will be visible. The input parameter barsNum is used for MA and CCI calculation.

This indicator is using 2 classical indicators: Commodity Channel Index from the higher TF (which you may change using input parameter TimeFrame ) and Average True Range from the current TF. The Green ribbon indicates the upper trend and the Red ribbon indicates the down trend. Buy when the Yellow line crosses the Upper bound (Aqua line). Sell when the Yellow line crossover the Lower bound (Aqua line).
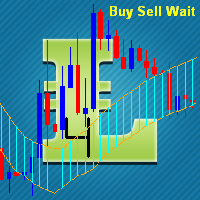
The input parameter counted_bars determines on how many bars the indicator lines will be visible. The input parameter barsNum is the period for bands calculation. When PriceClose for previous bar is above upper band a Long position may be opened. When PriceClose for previous bar is under lower band a Short position may be opened. If the current Price is between bands it is time to wait.

MACD indicator with overbought and oversold zones. Two display options - classic lines and a histogram. Can be used to detect a possible reversal or pullback in price, as well as for channel strategies All settings are simple and straightforward - all like a standard indicator, but with additional support and resistance levels Can be used both separately and together with other indicators

This highly informative indicator applies overbought/oversold levels for more accurate representation of the market situation. It is also possible to change the appearance of the indicator - line or histogram. Additional parameters enable more fine-tuning, while trading can be inside the channel and along a trend.
Distinctive features Oversold/overbought levels; Does not redraw. Displayed as a line or a histogram; Works on all timeframes and symbols. Suitable for manual trading and development

This indicator is a combination of 2 classical indicators: MA and Force Index. The input parameter counted_bars determines on how many bars the indicator lines will be visible. The input parameter MaForcePeriod is used for MA and Force calculation. You may go Long if the current price crossed Up the Ribbon (HISTOGRAM) and you may go Short if the current price crossed Down the Ribbon (HISTOGRAM)

Fibonacci sequence is defined by integer sequence: 0, 1, 1, 2, 3, 5, 8, 13, 21, 34, 55, 89, 144, ... By definition, it starts from 0 and 1, the next number is calculated as a sum of two previous numbers. Instead of the standard moving average, the indicator uses the following calculation of average price: Bar0 + Bar1 + Bar2 + Bar3 + Bar5 + Bar8 + Bar13 + Bar21 + ...
Input parameters FiboNumPeriod_1 - numbers in the following integer sequence for Fibo Moving Average 1. nAppliedPrice_1 - Close pr
Since a flat price stays within the same range and hardly moves, a horizontal or sideways trend can negatively affect the trade position A flat can also refer to a trade in which the currency pair has not moved significantly up or down and, therefore, has no large gain or loss attributed to the forex trading position. This Indicator is created for a M15 time frame.
The Zero-Line means a flat market.
The positive and negative impulses indicate the Long and Short movements accordingly.


描述 Abigail 是中线交易系统,在价格回滚过程中赢利。 本 EA专 已经针对 EURUSD 进行了优化工作。但是,它也可以成功地与其它货币对正常工作。 您可以在 MetaTrader 4 和 MetaTrader 5 交易信号 部分检查本 EA 针对不同经纪商和品种的交易统计。 参数: 风险管理: enter volume - 入场交易量。如果此数值大于 0 - 手数, 如果小于 0 - 可用资金百分比, 如果等于 0 - 暂停入场。 portion of partial closing - 部分平仓 (大于或等于 1.0 - 完整平仓)。 limit of number of addition - 加仓数量限制。 limit step additions - 设置加仓步长。 仓位维护: take_profit - 设置止盈点数 (0 - 禁用) stop_loss - 设置止损点数 (0 - 禁用) trailing_stop - 设置尾随停止点数 (0 - 禁用, <0 - 根据指标设置) 策略设置: 一般周期 一般偏离 定义周期 定义偏离 准确周期 准确偏离 附加指标设置:
Description Keltner's colored multicurrency/multisymbol channel indicator, also called STARC band, drawn in a separate window below the chart of the main financial symbol. The indicator uses the calculation technique of the three drawing options: basic, improved and modified . The first two were proposed by Keltner, the third one - by a successful trader L. Rakshe. You can also search for your own best parameters of the indicator. The upper, middle and lower bands can be colored. The indicator

This indicator is a combination of 2 classical indicators MA and RVI. The Relative Vigor Index (RVI) is a momentum indicator used in technical analysis that measures the strength of a trend by comparing a security's closing price to its trading range while smoothing the results using a simple moving average The input parameter counted_bars determines how many bars the indicator's lines will be visible. The input parameter MaRviPeriod is used for MA and RVI calculation.

This is a self-explanatory indicator - do nothing when the current price in the "fence" (flat) mode. Definition of a flat market: A market price that is neither Up nor Down. The input parameter counted_bars determines on how many bars the indicator's lines will be visible starting from the current Bar backward. The input parameter barsNum is used as a Period for aqua "fence" calculation.
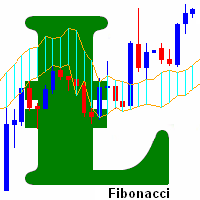
This indicator is based on the Fibonacci sequence. The input parameters fiboNum is responsible for the number in the integer sequence. The input parameter counted_bars determines on how many bars the indicator's lines will be visible. When the previous Price Close is above the previous indicator Bar, the probability to go Long is very high. When the previous Price Close is under the previous indicator Bar, the probability to go Short is very high.

A tick is a measure of the minimum upward or downward movement in the price of a security. A tick can also refer to the change in the price of a security from one trade to the next trade. This indicator will show amounts of ticks when the price goes up and down. This indicator is designed for M1 time frame and shows: Sum of points when the price goes up (Green Histogram). Sum of points when the price goes down (Red Histogram).

This indicator is based on two ideas: Correlations between 5 main currency pairs: EURUSD, GBPUSD, USDCHF, USDJPY, USDCAD; US Dollar Index = the value of the United States dollar relative to a basket of foreign currencies. The use of the indicator is the same as classical Commodity Channel Index (CCI) indicator. CCI is calculated with the following formula: (Typical Price - Simple Moving Average) / (0.015 x Mean Deviation) (Typical Price - Simple Moving Average) / (0.015 x Mean Deviation)

NewsCatcher Pro opens both pending and market orders based on data from the mql5.com calendar. In live mode, NewsCatcher Pro automatically downloads the calendar, opens orders, trails and closes orders. NewsCatcher Pro can trade any event from the calendar with any symbol available in MetaTrader, including Gold, Oil and cross-rates. To change the default symbol, go to the event view you want to change it for. NewsCatcher Pro uses two strategies: Strategy 1 (pending orders): the advisor opens two

Description Heiken Ashi Pivot is a universal color multicurrency/multisymbol indicator of the Pivot Points levels systems on Heiken Ashi candlesticks. You can select one of its three versions: Standard Old Standard New and Fibo . It plots pivot levels in a separate window. The system will automatically calculate the Pivot Point on the basis of market data for the previous day ( PERIOD_D1 ) and the system of support and resistance levels, three in each. It can also display price tags for

This indicator is based on the same idea as https://www.mql5.com/en/market/product/2406 , but instead of Average Bars it uses series or Fibonacci sequence. When the previous Price Close is above the previous indicator Bar, the probability to go Long is very high. When the previous Price Close is under the previous indicator Bar, the probability to go Short is very high.

Ace Scalper EA works on the GBPUSD, AUDCAD, EURGBP, USDCHF, GBPCAD, GBPAUD, USDCAD and some others pairs. Timeframe M5. The strategy is based on the search of price fluctuations for the quiet period of the Asian session. During this period, there is usually no strong unpredictable price movements, which allows relatively safe scalping, with the average trade duration 1 hour. Uses tight Stop Loss, which provides deposit protection in the event of adverse developments in the market. EA does not us
Description The indicator is intended for labeling the chart using horizontal levels and/or half-round prices on Heiken Ashi chart in a separate window. The indicator may be used with any broker, irrespective of the name of the financial instrument since it is necessary to manually enter the name as an input parameter. If you enter a non-existent or incorrect name of a financial instrument, you will receive an error message that this financial instrument is unknown (does not exist). A user can c

The indicator produces signals according to the methodology VSA (Volume Spread Analysis) - the analysis of trade volume together with the size and form of candlesticks. The signals are displayed at closing of bars on the main chart in the form of arrows. The arrows are not redrawn.
Input Parameters DisplayAlert - enable alerts, true on default; Pointer - arrow type (three types), 2 on default; Factor_distance - distance rate for arrows, 0.7 on default. Recommended timeframe - М15. Currency pair
Description Heiken Ashi Multicurrency is a colored well-known multicurrency/multy-symbol indicator. It shows a financial instrument as a smoothed candlestick chart in a separate window below the chart of the main financial symbol. The indicator may be used with any broker, irrespective of the name of the financial instrument since it is necessary to manually enter the name as an input parameter. If you enter a non-existent or incorrect name of a financial instrument, you will receive an error m

The indicator is based on Fibo levels.
The Indicator's Objective Calculation of the first market movement (from levels 0 to 100). Displaying possible price movement from 100 and higher to Profit Level , as well as in the opposite direction to Correction level and Revers level depending on the direction. The indicator is not redrawn! All indicator levels can be configured by users: CorrectLvl - correction level. When reached, level 100 is drawn (the market has performed its first movement). The
Moving Average Cross Expert Advisor is a standard trend trading robot that can work on a real account at any broker with any order execution method. It is resistant to connection failures and is capable of managing the margin preventing a deposit's "overloading" when working with other Expert Advisors. The robot also has built-in features for following the Martingale principles. Moving Average Cross is based on the following idea: Crossing of two Moving Average lines (fast and slow ones) as a si

Description A colored universal indicator/oscillator based on crossing moving averages. The rising and falling lines of the indicator histogram can be colored. The combined use of the line and the histogram increases the level of the analysis when making a decision to open or close deals. The indicator can be calculated as the standard Price Oscillator or as a derivative on the basis of the following eleven other indicators included in the standard package of the MetaTrader 4 terminal: AD - an i
Description The indicator draws a layout as horizontal levels of round and/or half-round prices in a separate window below the main chart. The indicator may be used with any broker, irrespective of the name of the financial instrument since it is necessary to manually enter the name as an input parameter. If you enter a non-existent or incorrect name of a financial instrument, you will receive an error message that this financial instrument is unknown (does not exist). You can color the indicato
Description Pivot System is a universal color multicurrency/multisymbol indicator of the Pivot Points levels systems. You can select one of its three versions: Standard Old , Standard New and Fibo . It plots pivot levels in a separate window.
The system will automatically calculate the Pivot Point on the basis of market data for the previous day ( PERIOD_D1 ) and the system of support and resistance levels, three in each. It can also display price tags for each level. You can color th

The indicator is intended for detecting big (long) and/or small (short) candlesticks. There is possibility of coloring the bullish and bearish candlesticks. The indicator can be used for manual and/or automated trading within an Expert Advisor. The indicator data that can be used for automated trading can be taken from one of four buffers of the double type: 0, 1, 2 or 3. Values must not be equal to zero.

Moving Average Bars is a self-explanatory indicator with one input parameter: nPeriod. When the previous Price Close is above the previous indicator Bar, the probability to go Long is very high. When the previous Price Close is under the previous indicator Bar, the probability to go Short is very high.

Description The universal colored multicurrency/multisymbol indicator MACD Classic, consisting of two MACD indicators: MACD Line and MACD Histo. The indicator may be used with any broker, irrespective of the name of the financial instrument since it is necessary to manually enter the name as an input parameter. If you enter a non-existent or incorrect name of a financial instrument, you will receive an error message that this financial instrument is unknown (does not exist).
Inputs Currency_Nam

Description A colored universal indicator MACD Classic (MA convergence-divergence indicator) that combines two indicators: MACD Line and MACD Histo. The rising and falling lines, the signal line and the indicator histogram can be colored. The indicator can be calculated as the standard one on the basis of a price or as a derivative on the basis of the following twelve other indicators included in the standard package of the MetaTrader 4 terminal: AD - an indicator of accumulation and distributio

Description A universal colored indicator MACD Histo. The rising and falling of the indicator histogram can be colored. The indicator can be calculated as the standard one on the basis of a price or as a derivative on the basis of the following twelve other indicators included in the standard package of the MetaTrader 4 terminal: AD - an indicator of accumulation and distribution of volume. OBV - On Balance Volume. Volume - tick volume indicator. Force - Force Index indicator. MFI - Money Flow

Description A colored universal indicator MACD Line (MA convergence-divergence indicator, shown as a histogram). The rising and falling of the indicator histogram can be colored. The indicator can be calculated as the standard one on the basis of a price or as a derivative on the basis of the following twelve other indicators included in the standard package of the MetaTrader 4 terminal: AD - an indicator of accumulation and distribution of volume. OBV - On Balance Volume. Volume - tick volume i

Description A universal indicator RSI together with moving averages based on it. Depending on the need, moving averages can be disabled. You can color the indicator lines and levels: lines of RSI, moving average lines and thresholds of overbought and oversold levels. The indicator can be calculated as the standard one on the basis of a price or as a derivative on the basis of the following eighteen other indicators included in the standard package of the MT4 terminal: AD - an indicator of accu

Description A universal indicator CCI together with moving averages based on it. Depending on the need, moving averages can be disabled. You can color the indicator lines and levels: lines of CCI, moving average lines and thresholds of overbought and oversold levels. The indicator can be calculated as the standard one on the basis of a price or as a derivative on the basis of the following eighteen other indicators included in the standard package of the MetaTrader 4 terminal: AD - an indicato

Description A colored universal indicator AO (Awesome Oscillator). The rising and falling of the indicator histogram can be colored. The indicator can be calculated as the standard one or as a derivative on the basis of the following eleven other indicators included in the standard package of the MetaTrader 4 terminal: AD - an indicator of accumulation and distribution of volume. OBV - On Balance Volume. Volume - tick volume indicator. Force - Force Index indicator. MFI - Money Flow Index. ATR

Envelopes is an excellent indicator when the market is trending. Open Long position when the ClosePrice crossed the upper Aqua band. Close Long position when the Price crossed the upper Yellow band moving down. Open Short position when the ClosePrice crossed the lower Aqua band. Close Short position when the Price crossed the lower Yellow band moving up.

Description The indicator determines the appearance of bars that notify of the reversal of the current trend, and paints them in accordance with the bullish and/or bearish mood. The indicator can notify of the appearance of a formed reversal bar by playing a beep, as well as display the time remaining until the end of the formation of the current bar in the format of <d:h:m:s, where: < means the current bar. d - days. h - hours. m - minutes. s - seconds. You can select the color for bullish and
The Average True Range (ATR) indicator drawn using a tick chart. After launching it, wait for enough ticks to come. Parameters: ATR Period - number of single periods used for the indicator calculation. The number of ticks to identify Bar - number of single ticks that form OHLC. Price levels count - number of displayed price levels (no levels are displayed if set to 0 or a lower value). price mode - choice of prices under calculation (can be bid, ask or average). Сalculated bar - number of
Tools Standard is a color multicurrency/multi-symbol indicator. It is designed for displaying one of the seven standard indicators on candlestick chart in a separate window under the base symbol chart. The indicator can be calculated based on one of the seven indicators according to user preferences: Bill Williams Alligator Bollinger Bands Envelopes Bill Williams Fractals Moving Average Two Moving Averages Parabolic SAR. Bill Williams Alligator is used by default. The indicator may be used wi
The Williams' Percent Range (%R) indicator drawn using a tick chart. After launching it, wait for enough ticks to come. Parameters: WPR Period - period of the indicator. Overbuying level - overbought level. Overselling level - oversold level. price mode - choice of prices under calculation (can be bid, ask or average). Сalculated bar - number of bars for the indicator calculation. The following parameters are intended for adjusting the weight of WPR signals (from 0 to 100). You can find t
The Price Channel indicator drawn using a tick chart. After launching it, wait for enough ticks to come. Parameters: Period - period for determining the channel boundaries. Price levels count - number of displayed price levels (no levels are displayed if set to 0). price mode - choice of prices under calculation (can be bid, ask or average). Bar under calculation - number of bars on the chart for the indicator calculation. Buffer indexes: 0 - Channel upper, 1 - Channel lower, 2 - Channel m

Description A colored multicurrency/multi-symbol Chaikin Oscillator . The oscillator may be used with any broker, irrespective of the name of the financial instrument since it is necessary to manually enter the name as an input parameter. If you enter a non-existent or incorrect name of a financial instrument, you will receive an error message that this financial instrument is unknown (does not exist). You can select the way of the graphic display of the oscillator values, as well as color the g
Description A colored multicurrency/multi-symbol Detrend Oscillator. In fact, the oscillator shows how far the current price has gone from a certain equilibrium price expressed in the form of a moving average. If the oscillator is greater than zero, it reflects the value of the price increase. If less - the value of the price fall. The oscillator may be used with any broker, irrespective of the name of the financial instrument since it is necessary to manually enter the name as an input parame

Description Candlestick Tools is a colored multicurrency/multy-symbol indicator. It shows one of four standard indicators as a candlestick chart in a separate window below the chart of the main financial symbol. The indicator is calculated based on one of two indicators included in the standard package of the МetaТrader 4 terminal: CCI - Commodity Channel Index. RSI - Relative Strength Index. The default indicator is Commodity Channel Index. The indicator may be used with any broker, irrespecti
MetaTrader 市场 - 在您的交易程序端可以直接使用为交易者提供的自动交易和技术指标。
MQL5.community 支付系统 提供给MQL5.com 网站所有已注册用户用于MetaTrade服务方面的事务。您可以使用WebMoney,PayPal 或银行卡进行存取款。
