 MetaTrader 5
 专家
专家 指标
指标 程序库
程序库 实用工具
实用工具 窗口小部件
窗口小部件 规则
规则适用于MetaTrader 4的EA交易和指标 - 351
 EA交易自动执行市场交易,而指标可使您更准确地分析报价并预测价格行为。
通过这些应用程序,您将能够更明智地在MetaTrader 4执行交易,抓住更多的交易机会。
EA交易自动执行市场交易,而指标可使您更准确地分析报价并预测价格行为。
通过这些应用程序,您将能够更明智地在MetaTrader 4执行交易,抓住更多的交易机会。 
The indicator calculates the levels by ATR daily range using the equations: 1AR = Open + ATR -1AS = Open - ATR AR 1/2 = Open + (ATR / 2) AS -1/2 = Open - (ATR / 2) AR 1/4 = Open + (ATR / 4) AS -1/4 = Open - (ATR / 4) AR 3/4 = Open + ((ATR*3) / 4) AS -3/4 = Open - ((ATR*3) / 4) AR 2 = Open + (ATR*2) AS -2 = Open - (ATR*2) Parameters Period ATR - ATR period
Shift time - shift by time for Open Color opening of day - Open line color
Color 1AR, -1AS - 1AR, -1AS line color
Color AR 1/2, AS -1/2 - AR 1
The indicator displays signals of different indicators (which can be selected in parameters) on a chart when zero level is crossed. AO, AC or AO+AC if signals of two indicators coincide. The indicator shows an Alert message (pop-up window) when a signal appears. Parameters: Indicators - Selection of the indicator AO, AC, AO+AC. Bars - Number of bars in history for display of signals. Alert - Pop-up window in case of a signal.
The indicator makes levels according to local maximums and minimums of a week, a month, or a year. Parameters: Week number - number of weeks for lines display Week level color - Week line color Month number - number of months for lines display Month level color - Month line color Year number - number of years for lines display Year level color - Year line color Width line - Width of lines Style line - Style of lines

Strategy requirements You need to set-up the chart manually for this strategy. You need three mt4 default indicator: FAST EMA (Exponential Moving Average of the close price) SLOW EMA (Exponential Moving Average of the close price) CCI (Commodity Channel Index) Buy signal: When FAST EMA is above the SLOW EMA, you can take buy when CCI crosses 0.0 level from bottom to top. Sell signal: When FAST EMA is below the SLOW EMA, you can take sell entry when CCI crosses 0.0 level from top to bottom . The
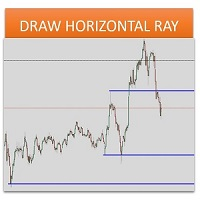
Sometimes we want to draw a horizontal ray from any given price based on a candlestick, and this tool solves that with just 1 key! In order to draw an horizontal ray you just need to drag and drop the indicator over any chart you want and then: 1) Click over ANY candle and then 2) Hit any of the following keys: O - It will draw an horizontal ray right at the OPEN price of the clicked candle H - It will draw an horizontal ray right at the HIGH price of the clicked candle L - It will draw an horiz

MarkerElliottWave is a panel for rapid and user-friendly manual markup of Elliott waves. One can select a color and a font of marks. There are also functions for removing the last markup and the entire markup made by the indicator. Markup is made in one click. Click five times - have five waves! MarkerElliottWave will be a great instrument both for beginners and professional analysts of Elliott waves.
The main rule of the profitable trading is opening trades in the direction of a trend. You can define the current trend using fractal analysis. Important Levels ResSup displays important price levels on the chart. The breakthrough of those levels shows the price direction. The data panel allows you to track the current trends on all timeframes. The current timeframe's important level values are shown in the comments. The indicator can be useful for traders working by levels. It can also be a par

Copies transactions between MT4 terminals. Possibilities: quick copy start minimum processor load direct and reverse (reverse) copying. copying Take Profit and Stop Loss levels copying deferred and their changes copy transactions one to many copy trades many to one local copy only Attention: The product is designed for copying trades only within a single computer or VPS with access to the desktop. The product will not work on the built-in Virtual Hosting of the terminal. We will help you set up
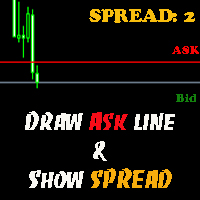
The indicator helps you to draw Ask line on the current chart and show the current spread. So, it helps you to do scalping trade easier. See the video below. It shows you how it works. Parameters line_color – Ask line color
text_size – text size of spread value text_color – color of spread value Thank you! If you have any question, please contact me via Skype: cuongph149, or email: hungcuongkhmt51@gmail.com
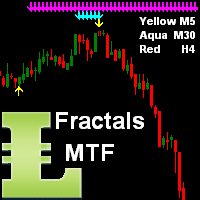
This indicator shows arrows as Support and Resistance from current time frame (Yellow arrows) and 2 higher TF by your choice (TF2 = Aqua arrows, TF3 = Magenta arrows and TF4 = Blue arrows). When all 3 color arrows are appearing in the same place then this is a good time to enter a new position.
Inputs NumOfBars - number of Bars where the indicator will show all arrows; DistanceArrow - you can increase the distance (vertically) between arrows especially on higher TF.

The Volume indicator is an excellent tool for measuring tick volume or real volume activity. It quickly and easily helps traders evaluate the volume's current size. The indicator for classification of the volume size uses the moving average and its multiples. Accordingly, the area where the volume is located (relative to the moving average) is labeled as ultra-low, low, average, high, very high, or ultra-high. This indicator can calculate the moving average by four methods: SMA - Simple Mov

The ATR indicator is a helpful tool for measuring the range of bars. It quickly and easily helps evaluate the ATR's current spread (range), which is especially useful for VSA traders. The indicator for classifying the range of bars (candles) uses the moving average and its multiples. Accordingly, the area where the volume is located (relative to the moving average) is labeled as ultra-low, low, average, high, very high, or ultra-high. Our ATR indicator is rendered as a histogram. This indicator

The [GRAFF] III manual trading system is based on multiple MetaTrader (MT4) indicators. Together, the entire PACK of GRAFF III indicators makes an advanced trading tool. The system consists of over 20 different custom-built indicators which have been carefully selected and tested in the long term to produce strong and efficient trading signals. The particular indicators are based on different mathematical formulas, so the entire system is calibrated to remove false signals from its own indicator
This indicator shows the lateral movement of the price when the indicator line corresponds to zero and Up/Down trend when indicator line is higher / lower than and parallel to zero-line. Of course, the moment when the indicator line is crossing the zero-line is the best moment to enter the market. This indicator has no input parameters... So, the results will be always the same for every time frame and currency pairs.

This indicator is based on the classical indicator RSI (Relative Strangth Index) and will be helpful for those who love and know how to use not a visual but digital representation of the indicator. All TimeFrames RSI MT4 indicator shows values from each timeframe. You will be able to change the main input parameters for each RSI for every TF. Example for M1: sTF1_____ = "M1"; Period1 = 14; Price1 = PRICE_CLOSE.
XP Moving Average – Your All-in-One Trading Powerhouse Master the markets with XP Moving Average , the ultimate moving average indicator for MetaTrader 4. Whether you’re scalping , swing trading , or investing long-term , this versatile tool combines 9 advanced moving averages in one—enhanced with a modern graphical dashboard and real-time alerts . With AI-powered insights coming soon , XP Moving Average is your key to smarter, more profitable trades . Why Choose XP Moving Average? 9-in-1

The EA created based on this strategy: This EMA crossover trading strategy is made with MACD. For MACD, you can avoid false signals from this EMA crossover. With this strategy, you can get more accurate signals. So this is more profitable .
Strategy required FAST EMA SLOW EMA MACD with default setting How Signals come Buy Signal: When FAST EMA cross SLOW EMA from lower to upper, then you have to wait for MACD confirmation. After crossover, when you see MACD above 0.0 level, then you can take buy

MoonLightEA is a multicurrency night scalper with a strict stop loss.
EA Features: No martingale, no averaging, no grid
15 currency pairs (AUDCAD, AUDJPY, CADCHF, CADJPY, EURCAD, EURCHF, EURGBP, EURJPY, EURUSD, GBPCAD, GBPCHF, GBPJPY, USDCAD, USDCHF, USDJPY) Minimum deposit - 100$ Minimum lot - 0.01 Minimum leverage - 1:100 Timeframe M15 Recommended types of accounts - ECN and NDD (standard and cent accounts not recommended) News filter (required indicator ffcal.ex4) Working time - 5 nights per

This EA will help you to automatically put stop loss and take profit for all your orders. Stop loss point and take profit points can be selected in the tab of the input parameters. You can specify three symbols with SL and TP values (you can see symbol1 , symbol2 ... in the input tab below). The EA performs checks. If a new order with symbol1 appears, it puts SL and TP with stoploss1 and takeprofit1 values (in points). If a new order with symbol2 appears, it puts SL and TP with stoploss2 and tak

Knowledge of the strength and weakness of each currency is vital for every forex trader. Our Currency Strength Meter indicator measures the strength of eight major currencies (USD, EUR, GBP, CHF, JPY, CAD, AUD, NZD) by using the Relative Strength Index indicator, also known as RSI. The Currency Strength Meter indicator shows you, simply and quickly, when a currency is oversold, overbought, or in "normal area". This way, you can identify which currency is the strongest and the weakest.
Our

The FFx Watcher PRO is a dashboard displaying on a single chart the current direction of up to 15 standard indicators and up to 9 timeframes. It has 2 different modes: 1. Watcher mode: Multi Indicators User is able to select up to 15 indicators to be displayed User is able to select up to 9 timeframes to be displayed
2. Watcher mode: Multi Pairs User is able to select any number of pairs/symbols User is able to select up to 9 timeframes to be displayed This mode uses one of the standard indicat

Waddah Attar Binary Support and Resistance Indicator. This indicator draws on chart very powerful Support and Resistance levels. It calculate these levels based on price binary values. Stronger levels are drawn in Blue Color and Red Color in more width. You can change the color and width for these levels from the indicator properties window. This indicator works only on five-digit symbols.

"Make it Horizontal" will convert any trendline to horizontal by just selecting it and then pressing the H key. This tool must be included in your charts as an indicator. It has no inputs, just drag it to your charts and that's it! I created this tool because the MT4 doesn't have any built-in feature like this. How many times have you drawn a line and you need to double click it in order to configure the start and end price level so you can make it horizontal? Well, that's not an issue anymore!

This indicator will be very useful for a research of a trading strategy system. The MACD Control Panel is based on the very popular Relative Strength Index indicator. You will be able to change the indicator parameters FastPeriod , SlowPeriod , SignalPeriod and Apply Price by clicking on the Up ( /\ ) and Down ( \/ ) buttons. Sometimes, when you will open a rarely used currency pair or timeframe the indicator will not show its value. In this case you should use button " 0 ".

Bulls CD LBT Global (Bulls Convergence/Divergence Low Bottom Top Global) is an analytical bulls convergence/divergence indicator (C, D or CD) between a financial instrument and 22 MT4 indicators working on all periods simultaneously. The indicator measures the power of CD for indicators and periods and is the first one out of the two possible versions (LBT and LTB).
Features The analyzer is not a lagging one. It works by ticks and is able to show CD in the main window even in case the MT4 i
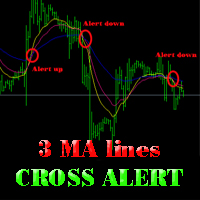
The indicator alerts you when 3 MA lines cross UP/DOWN (see the screenshot below). You can choose all parameters for these 3 MA lines to use via parameter input tab.
Parameters Same as 4 parameters you have to choose when you add MA line on the chart. Fast MA: ma1_period ma1_shift ma1_method (0=Simple; 1=Exponential...) ma1_apply (0=Close; 1=Open; 2=High; 3=Low...) Medium MA: ma2_period ma2_shift ma2_method (0=Simple; 1=Exponential...) ma2_apply (0=Close; 1=Open; 2=High; 3=Low...) Slow MA:

This indicator will be very useful for a research of a trading strategy system. The RSI-ControlPanel is based on the very popular Relative Strength Index indicator. You will be able to change the indicator parameters Period , Apply Price, HighLevel and LowLevel by clicking on the Up ( /\ ) and Down ( \/ ) buttons. Sometimes, when you will open a rarely used currency pair or timeframe the indicator will not show its value. In this case you should use button " 0 ".
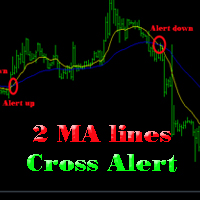
The indicator help you to do alert when two MA lines cross action You can choose all parameters for two these MA lines to use via parameter input tab (see screenshot below).
Parameters Same as 4 parameters you have to choose when you add MA line on chart. Fast MA: ma1_period ma1_shift ma1_method (0=Simple; 1=Exponential...) ma1_apply (0=Close; 1=Open; 2=High; 3=Low...) Slow MA: ma2_period ma2_shift ma2_method (0=Simple; 1=Exponential...) ma2_apply (0=Close; 1=Open; 2=High; 3=Low...) When f

[ EA] ENTERPRISE LT is a MetaTrader (MT4) Expert Advisor designed for use with most currency pairs and Gold. It implements complete, fully functional trading strategy. It is NOT based on any indicators or Price Action. It is very easy to set up and supervise. The strategy is timeframe-independent. [EA] ENTERPRISE LT has a set of unique features: It can be individually adjusted, according to your strategy. It has complete money management and risk management. Advanced functions to respond to diff

Bears CD HTB Global (Bears Convergence/Divergence High Top Bottom Global) is an analytical bears convergence/divergence indicator (C, D or CD) between a financial instrument and 22 MT4 indicators working on all periods simultaneously. The indicator measures the power of CD for indicators and periods and is the second one out of the two possible versions (HBT and HTB).
Features The analyzer is not a lagging one. It works by ticks and is able to show CD in the main window even in case the MT4 in
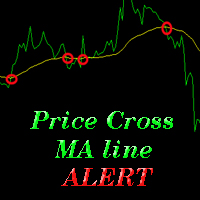
The indicator alerts you when the market price crosses MA line. You can choose any MA line to use via the parameter input tab (see the screenshot below). Parameters (the same as the four parameters you have to choose when you add MA line on a chart): ma_period ma_shift ma_method (0=Simple; 1=Exponential...) ma_apply (0=Close; 1=Open; 2=High; 3=Low...) When the price crosses MA line, it will alert you with a message looking as follows: "Price crossing DOWN MA line, pair: EURUSD Period: 60" or "

This Expert Advisor can work in three different modes, which can be configured by changing the input parameters. The Expert Advisor performs trading operations based on the signals of the built-in indicator "Digital Filter A". The algorithm of this indicator is based on a highly efficient digital filter. The indicator resembles a moving average, but has one significant difference — the digital filtering algorithm. This algorithm is based on a mathematical model of a digital filter with adaptive
This is a Control Panel for major indicators: ATR, CCI, RSI, RVI, Stochastic and MACD. You have the ability to change any input parameters for each indicator. For example: ATR atrPeriod = 13; atrColor = Yellow; CCI cciPeriod = 13; cciPrice = PRICE_CLOSE; cciColor = Aqua; This indicator will be helpful for those who like to use many indicators before any decision making.
This is a Control Panel for major chart indicators: Moving Averages, Bollinger Bands, Envelopes, PSAR and Fractals. You have the ability to change any input parameters for each indicator. For example:
MA maPeriod = 13; ma_method = MODE_SMA; app_price = PRICE_CLOSE; maColor = Yellow; Bands bbPeriod = 20; bb_dev = 2; bb_Price = PRICE_CLOSE; bbColor = Aqua; This indicator will be helpful for those who like to use many indicators before any decision making.
Description The product draws lines on the chart to show daily support, resistance and pivot plus weekly and monthly pivot. An alert can be set when the price reaches one of the lines or the price closes above/below it. This can be useful for both entry and exit. The alerts can be controlled interactively directly from the chart.
The product also includes bonus indicators of Average Daily Range (or Average True Range - configurable), current spread and ask/bid prices in large text, color coded a

Pivots is an indicator to show pivots for relevant time frames. Besides the pivots the indicator can also show daly open line, the resistance and support levels, the ADR Fibonacci levels and the order of the pivots. Pivots includes an intelligent algorithm to eliminate Sunday candles, but only if your broker provides those. Pivots are significant price levels that may serve as support, resistance or breakout levels Settings textFont - font to use for the labels. textSize - font size. textColor -

Description Shows Heikin-Ashi candles (often misspelled Heiken-Ashi) on the chart and can alert when candles change color. The alert is useful for both entry and exit. The number of candles of the new color before an alert is raised can be set. The alert can be controlled interactively, directly from the chart. Also includes bonus indicators of current spread and ask/bid prices in large text, color coded as price changes. Usage Heikin-Ashi candles give a much better insight to the underlying tre
This panel will be very useful for a research of a trading strategy system. The MA-ControlPanel is based on the very popular Moving Averages indicator. You will be able to change the indicator parameters: Period , Shift , Method and Apply Price by clicking on the Up ( /\ ) and Down ( \/ ) buttons. You may choose your favorite colors using parameters BackGround, maColor1 and maColor2. Sometimes, when you will open a rarely used currency pair or timeframe the indicator will not show its value. In

Effortless Trade Management – Automatic Stops & Trailing Take the guesswork and manual effort out of risk management. Our Automatic Stops tool continuously monitors your account and instantly applies your predefined stop loss, take profit, partial close levels (scaling out), and trailing stop to every new trade. Once the EA is attached to a chart, it automatically sets and manages these levels for any new trade on that currency pair – so you never have to enter them manually again. Key Feat

A library for creating a brief trading report in a separate window. Three report generation modes are supported: For all trades. For trades of the current instrument. For trades on all instruments except the current one. It features the ability to make reports on the deals with a certain magic number. It is possible to set the time period of the report, to hide the account number and holder's name, to write the report to an htm file. The library is useful for fast assessment of the trading effec
The indicator shows you time remaining till completion of the current candlestick of any timeframe you chose, showing struct (see details). Minute: second. The indicator has 3 parameters: TF - this parameter will help you choose timeframe you want, for example, if you want to show remaining time for M30, set TF=30. If you want to show remaining time of the current period you are seeing on chart, set TF=0 (like in default). Local - this parameter will help you choose location on the chart where t

Crossing of market price and moving average with all kinds of alerts and features to improve visualization on the chart.
Features Crossing of market price and Moving Average (MA) at current bar or at closing of last bar; It can avoid same signals in a row, so it can allow only a buy signal followed by a sell signal and vice versa; MA can be set for any of the following averaging methods: Simple Moving Average (SMA), Exponential Moving Average (EMA), Smoothed Moving Average (SMMA), Linear-weigh

The script allows to close part of opened position if this position has some profit. You just need to drop this script on the chart with a desired currency pair. Let's say you have 1 lot for a Long position with positive profit. With this script you can close any part of the 1 lot (input parameter LotCoeff from 0.1 to 0.9) and remain (for example, 0.4 lot) will have a BreakEven StopLoss. Before placing an opposite orders, the input window is opened allowing you to modify all input parameters:
We never know what market price will go on next second. That's why a trader needs to find a good way to have a good exit strategy. Quadro Multi Grid Scalper is a High Frequency Grid scalper using Dynamic Fibo Level, with only 3 maximum Opened order each cycle, will make less risk to your account. This EA uses Averaging exit system with changable martingale settings, and uses total profit target to closing all. Recommended Broker Parameters: Low spread less than 1 pip (you will have fast open an

Description Stoploss Master Expert Advisor helps you to manage the virtual Stop Loss. It replaces the real Stop Loss levels by virtual ones with further trailing according to its own strategy of preserving a reached profit level. This EA is used when following the trend. In multicurrency/multisymbol mode, the EA is attached to the chart of each financial instrument separately and tracks positions only of a certain financial instrument. Management is performed only by market orders. The EA starts

This script searches for all positions for the current currency pair and calculates the sum of all lots for those positions with negative profit and offers to open a hedge (opposite) position with a lot size equal to the calculated sum of lots multiplied by LotCoeff. You just need to drop this script on the chart with a desired currency pair. Before placing opposite orders, the input window is opened allowing you to modify all the input parameters: LotCoeff = 1.5; BuySearch = true; SellSearch =

Spread Histogram displays spread changes at each price movement. The product is very useful for scalpers as it allows them to spot good market entry points. Small spreads can be used to open a new order or close the current one. This indicator is equipped with: maximum spread minimum spread up / down spread histogram average spread Inputs: AveragePeriod (determine the average of the "X" Histogram) Shift Report

The indicator shows you buy/sell signals and does not repaint. It works well with almost all pairs, while the best ones are GBPUSD, XAUUSD and EURUSD. The product works better on H1 and H4. You can change the parameters in the inputs tab to get the best signals and the best trade results on each pair. You can enable/disable alerts when signal appears. The indicator is easy to use.
Parameters barstrip & Sensitive: amount of bars to process the highest and lowest prices (relates to the internal l

顾问(Fortune):您的外汇高频交易可靠工具 顾问Fortune设计用于任何时间段、任何货币对和任何经纪商服务器。其独特的交易系统使其成为交易者的多功能工具。为了获得最佳性能,建议使用流动性好的外汇货币对,保持低点差,并使用VPS。您可以从100美元的存款和0.01的手数开始使用。 主要特点和优势 高频交易 :使用虚拟和真实止损两种交易选项。虚拟止损水平(止盈、止损和追踪止损)存储在顾问的内存中,对经纪商不可见。 历史测试 :专家系统在所有时间段和货币对上进行单一设置测试。测试在真实经纪商账户上进行。 佣金和点差 :如果账户中有佣金,应将其重新计算为点差等值,并填写在Commission字段中。减少佣金和点差可以提高交易效率。 延迟和设置 :在设置止损、止盈和追踪止损时,应考虑经纪商和互联网渠道的延迟,以确保服务器能及时处理。在测试期间,可以调节点差并使用所有的ticks。 高频交易(HFT)的基础 高频交易(HFT)是一种使用先进技术在短时间内执行交易的算法交易形式。Fortune顾问实施了HFT策略,需要高速计算机和互联网连接。在低速计算机和互联网条件下无法成功使用该产品。

The analyzer panel allows traders to add the pending order grid (Buy Limit, Sell Limit, Buy Stop, Sell Stop) quickly and efficiently. Parameters stop mode - select stop setting mode every order - stop levels are set for each order separately position as - common stop levels for all orders order type - select pending order type Buy Limit Sell Limit Buy Stop Sell Stop magic - set a magic number for open orders if necessary. If position as mode is enabled, stop levels are corrected for all orders

The indicator of a Professional Trader is an arrow indicator for predicting the direction of price movement. I have been working on this indicator since 2014.
You can use this indicator as your main indicator, use its entry signals, and use it as your only indicator to find entry points.
About the product: Recommended TF [H4-D1-W1] . The indicator predicts the direction of the next candle. Fits a variety of tools; Flexibility in settings for different instruments and intervals through the MO

Zig Zag Swing Detector is a talking indicator tool, that let you track new highs and lows using Zig Zag patterns and allows you to react to new highs and lows. For example for uptrend each time there is higher hi spotted, the strength of the trend is increased. Trend is ended with lower low than the previous one. Be notified by Alerts, Speech and Notifications and be alerted about new highs/lows! You can also setup conditions to open trades automatically on new heights. Speech synthesis allows y

Prototype 2 is a no-martingale automated system, well testable in a 15-year history period and showing good results in real trading. The default settings are suitable for EURUSD M15, however the EA is well adaptable for any currency pairs and timeframes through its input parameters. The Expert Advisor is suitable both for beginners, because you need only to attach it to a chart, and experienced traders, because in addition to the automatic mode, the EA has options for manual settings of the lot,

This is an old and well-known strategy from the book "Sure Fire Hedging Strategy", but have more Advance Parameter than anyother old style Hedge Averaging EA. This strategy is using a hedge order with a higher lot size for the last (opposite) order and will receive profit if your free margin is huge enough to handle. A good money management is needed for using this system. No Pending order used on this EA, because using pending order will have more high risk order slipage and Spread can be diff

Description Trend Trading is an innovative analyzer designed for trend following trading. The analyzer consists of a trend line, colored bars, arrow pointers and reference information. After completion of the current bar, the trend line, the color of the bar and the arrow pointers are not redrawn. Change of market sentiment can be calculated based on one of the fourteen basic indicators included in the standard package of MT4, it affects the color of the trend line. Optionally colored bars, arro

ForexTrendMT4 Indicator: A Reliable Tool for Market Tracking The ForexTrendMT4 indicator offers reliable market trend tracking, filtering out sudden fluctuations and market noise. This tool helps identify trends and signals favorable entry points into the market using arrows. It is suitable for both scalping on shorter timeframes and long-term trading strategies. Based on the principles of technical analysis, ForexTrendMT4 takes into account the cyclical nature of the market. Key Features and A

此交易机器人应用七个指标!交易在回滚时执行。本产品功能还有内置的资金管理系统。每笔订单均由双倍安全的网格以及十分平滑的马丁格尔支持。不要尝试设置过高的初始手数,以便降低风险。本机器人自动分析市场状况,并基于来自七个指标的一般信号制定入场决策。用于获取信号的指标是: PSAR, MACD, MA, Envelopes, CCI, RVI 和 Alligator!您应该在 H1 内进行交易, 因为趋势/横盘和回滚在此更明显。建议本金: 美分帐户至少 $50, 以及美元帐户最少 $500。在注册账户时要选择最大杠杆。最佳杠杆是 1:1 000。
设置
对于 5-位报价: MM = 5 000。此处设置手数 0.01。如果您设置 500, 则手数是 0.01, 本金是 $500。$1 000 - 0.02, 以此类推。 Lot = 0.01。如果 MM 为 0,则是手数。 K_Lot = 1.6。增加手数会同时增加回撤。 Take_Profit = 1。本币为单位的止盈。 Step = 500。订单间隔步长。对于 4-位报价 - 50, 对于 5-位报价 - 500。这是从大量的实验和测试中

This indicator is based on the classical indicator Parabolic SAR and will be helpful for those who love and know how to use not a visual, but digital representation of the indicator. All TimeFrames PSAR MT5 indicator shows values from each timeframe (M1, M5, M15, M30, H1, H4, D1, W1 and MN1). You will be able to change the main input parameters for each Stochastic from every TF. Example for M1: sTF1 = M1 pStep1 = 0.02 pMax1 = 0.2
Complete Pending Orders Grid System opens any combinations of Buy Stop, Sell Stop, Buy Limit and Sell Limit pending orders and closes all existing pending orders. You just need to drop this script on the chart of a desired currency pair. Before placing all pending orders, the input window is opened allowing you to modify all input parameters: DeleteAllPendings – if true , then all pending orders (for current currency) will be deleted. BuyStop – if true , BuyStop order is opened. SellStop – if tr

This indicator is based on the classical indicator STOCHASTIC and will be helpful for those who love and know how to use not a visual, but digital representation of the indicator. All TimeFrames Stochastic MT4 indicator shows values from each timeframe (M1, M5, M15, M30, H1, H4, D1, W1 and MN1). You will be able to change the main input parameters for each Stochastic from every TF. Example for M1: sTF1_____ = "M1"; K_Period1 = 5; D_Period1 = 3; S_Period1 = 3; Method1 = MODE_EMA.

This indicator is based on the classical indicator CCI (Commodity Channel Index) and will be helpful for those who love and know how to use not a visual but digital representation of the indicator. All TimeFrames CCI MT4 indicator shows values from each timeframe. You will be able to change the main input parameters for each CCI for every TF. Example for M1: sTF1_____ = "M1"; Period1 = 13; Price1 = PRICE_CLOSE.

BuyLimit_SellLimit_Grid script opens BuyLimit and SellLimit pending orders. You just need to drop this script on the chart with a desired currency pair. Before placing all pending orders, the input window is opened allowing you to modify all input parameters: LongPos - if TRUE, BuyLimit order is opened. ShortPos - if TRUE, SellLimit order is opened. InitLot - initial lot. LotCoeff - if 1, all pending orders will have the same lot size. InitStep - difference between two consecutive orders in poi

BuyStop_SellStop_Grid script opens BuyStop and SellStop pending orders. You just need to drop this script on the chart with a desired currency pair. Before placing all pending orders, the input window is opened allowing you to modify all input parameters: LongPos - if TRUE, BuyStop orderi is opened. ShortPos - if TRUE, SellStop order is opened. InitLot - initial lot. LotCoeff - if 1, all pending orders will have the same lot size. InitStep - difference between two consecutive orders in points.

The script allows you to close all opened positions for a given currency pair ( EURUSD by default, but it can be changed to any existing currency pair) when Sum of Profit from all opened positions (by chosen currency pair) is equal or greater than value of the input parameter: SumProfit .
Input Parameters sSymbol = EURUSD SumProfit = 100 Slippage = 2 You can change SumProfit to any positive value ( in dollars , not in points!). This script closes all positions for a given currency pair only.

Overview This is a very simple indicator that displays the relative strength values of the currencies on te current chart and timeframe. The strength is only calculated for the currencies: AUD - Australian Dollar CAD - Canadian Dollar CHF - Swiss Franc EUR - European Union Euro GBP - Great Britain Pound JPY - Japanese Yen NZD - New Zealand Dollar USD - United States Dollar
These are considered the major currencies in the world. There are 28 distinct combinations of major currency pairs. Other c

VR Trade Panel 是一款专业的交易面板,旨在提高交易便利性并降低交易风险。借助简洁的界面和详尽的指南,新手将更容易掌握交易基础并开始实践。 面板的主要原则:舒适、快速、功能全面。 說明: [ 如何安裝 ]、[ 如何使用 ]、[ 演示版 ]。 程序界面直观简洁,只需两次点击即可开立市价单或设置任何类型的挂单。 头寸和订单管理迈上了新台阶,您不仅可以移动水平的止损和止盈位,还能创建倾斜的价位。借助这一解决方案,止损、止盈位及挂单价格可按您指定的方向移动,或在设定条件下自动失效。 该交易面板旨在让交易者能提前为自己做好一切设置,从而快速舒适地交易。 为此,交易面板采用了以下先进解决方案: 五个手数按钮——让您无需在计算上浪费时间,能瞬间选择所需的交易量。同时,交易量可按存款百分比、指定金额或存款的倍数金额进行计算。 止损和止盈输入字段——您可按方便的方式指定规模:精确价格、精确点数、期望的利润或亏损金额。 注释输入字段——会保留此前输入的注释,无需您重新填写。 声音提示——帮助您了解交易指令的执行情况。 对于每个头寸或挂单,您可设置多达 10 个部分平仓价位,每个价位均可单独配置
FREE

Many indicators are based on the classical indicator Moving Average . The indicator All_TF_MA shows crossing of 2 MA from each TimeFrames . You will be able to change main input parameters for each MA for every TF. Example for M1 TF: Period1_Fast = 5 Method1_Fast = MODE_EMA Price1_Fast = PRICE_CLOSE Period1_Slow = 21 Method1_Slow = MODE_SMA Price1_Slow = PRICE_TYPICAL

The script allows to close all opened positions for a given currency pair (EURUSD by default, but it can be change to any existing currency pair). Input parameters sSymbol = "EURUSD"; PendingOrders = false; which will appear in the Inputs tab where you can change a working symbol and set PendingOrders to true to delete all pending orders for a given currency pair. This script will close and delete all positions for a given currency pair only. Keep in mind that you have to "Allow automated tradin

This script is designed and used to move StopLoss for all EURUSD positions (or any other available currency pairs) at once. The Stop Loss will be moved to a level: Bid - StopLevel (for Long position) Ask + StopLevel (for Short position). STOPLEVEL applies to distance between entry price and SL. Of course, this script will move the StopLoss only if: Bid > OrderOpenPrice() + StopLevel (for Long) and Ask < OrderOpenPrice() - StopLevel (for Short). When you put the script on the chart the Input Box

This multi-timeframe indicator is based on the idea of classical indicator CCI (Commodity Channel Index). As you know, CCI was developed to determine overbought and oversold levels. The CCI does this by measuring the relation between price and a moving average (MA), or, more specifically, normal deviations from that average. This particular indicator shows the modified CCI data from higher timeframe ordered by an input parameter "TF". Green rhombus on the chart represent an UP trend and Red rhom
您知道为什么MetaTrader市场是出售交易策略和技术指标的最佳场所吗?不需要广告或软件保护,没有支付的麻烦。一切都在MetaTrader市场提供。
