 MetaTrader 5
 专家
 指标
 程序库
 实用工具
 窗口小部件
 规则
适用于MetaTrader 4的新EA交易和指标 - 196
 EA交易自动执行市场交易,而指标可使您更准确地分析报价并预测价格行为。
通过这些应用程序,您将能够更明智地在MetaTrader 4执行交易,抓住更多的交易机会。

Time frame: M1
Leverage : Higher the better
Spread: Lower the better
Account type : All types
(EA may enter hedge positions, if you want to disable this feature deactivate either Buy, or Sell from the setting)
Please please do not take unnecessary risks. (Trading is risky, and there are no guarantees for winning)
We wish you successful trading. (Trading is risky, and there are no guarantees for winning

Hello all The expert works on the intersection of moving averages with a digital method of opening deals With closing deals on a profit of a number of points programmatically With opening deals with the trend and closing some deals together for a profit until all are closed together for a profit The expert works on regular candles. It is possible to experiment on the timing of five minutes, quarter-hour, half-hour or hour parameters:
Lot1: Manual Lot Size Auto_Lot: Set true to automatically ca

Time frame: M1
Leverage : Higher the better
Spread: Lower the better
Account type : All types
(EA may enter hedge positions, if you want to disable this feature deactivate either Buy, or Sell from the setting)
Please please do not take unnecessary risks. (Trading is risky, and there are no guarantees for winning)
We wish you successful trading. (Trading is risky, and there are no guarantees for winning

Sistema de trading automático adaptado a la volatilidad de la sesión de New York. Se basa en la ruptura de un rango de baja volatilidad con el objetivo de aprovechar diariamente el movimiento fuerte de la sesión americana. El sistema cuenta con parámetros de manejo de riesgo por porcentaje, parámetros de Stop Loss, Take Profit, Break Even, Tambien cuenta con parametro para cantidad de operaciones diarias y validación de entrada por cierre de vela o ruptura de precio.
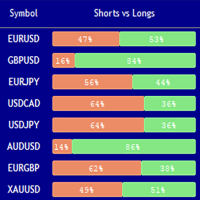
Market Sentiment Indicator Market Sentiment is a Trading Tool which allows you to see the positions of other currency traders. Until now, only institutional traders had access to such data which gave them a serious advantage over retail traders because of obvious reasons. With Market Sentiment, you too will finally know what other traders are doing which makes it easy to beat them on the forex battlefield.
Data comes from MyFxbook Community Outlook data feed and is based on up to 100 000 live

Simple Order Panel for calculating actual lot size with fixed risk amount. Working on both Market orders and pending orders. Notify Line Application when an order is opened or closed. Automatic set up Stoploss and Takeprofit with Risk Reward Ratio. Open one order with the risk(amount) per trade or separate the bet into three orders in one click. Involuntary modification Stopsloss to Breakeven when the Market takes the first or second-order profit. Filter button Buy or Sell when Moving Averate C
我为您带来唐·击 (Don hits) 激进交易专家,它是一个多向系统,涵盖所有时间和所有货币,具有回撤控制 这个系统使用我的马丁格尔逻辑之一,跟踪较短时间和较长时间发生的情况,也会决定是否有必要干预回撤,我知道很多人不喜欢马丁格尔 或者边缘系统,因为他们习惯了烧账,但相信我,我的系统是不同的,它是一个逻辑实现来覆盖错误并不断留在路上,这些系统可以有很高的DD,这就是为什么他们有一个内部 旨在控制这一点的系统,请记住,马丁家族是在市场上创造最多利润的家族
一种采用网格交易先进技术的激进系统,管理整个市场,可以通过唐点击进入,因为最先进的技术是控制进入和退出的保护,也就是说,我们将积极进入一个 但具有严格而复杂的不断累积防御系统
这些条目将受到多个内部指标的监控,以了解我们是否处于某些市场状况的边缘或底部。 此外,我们将知道如何以特殊的方式控制波动性,因为我们将拥有有关市场新闻的API信息。
我的策略 EA 有一段鲜活的历史
Don Hits 的设计初衷是让每日利润保持恒定
现场表演 如果您想要我的信号预设,请私下询问我,仅限我的客户
https://ww
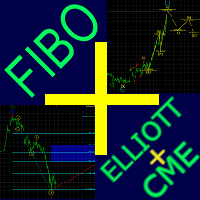
Fibo + Elliott + CME
The Expert Adviso r is designed as an assistant for manual trading. Ready-made trading system based on Elliott waves and Fibonacci retracement levels . It is simple and affordable. Display of the marking of Elliott waves (main or alternative option) on the chart. Construction of horizontal levels, support and resistance lines, a channel. Superposition of Fibonacci levels on waves 1, 3, 5, A Display data from CME (CME - Chicago Mercantile Exchange Chicago Mercantile Excha

KT Auto SL TP EA 为每一笔手动交易添加止损和止盈,然后将止损移动到保本位置并进行追踪。 在电脑或手机上开一笔交易。片刻之后,止损和止盈就已设置好,图表上的标签会显示当前使用的具体设置。该 EA 从不自行开仓或平仓。 功能 为市价交易和挂单添加您的止损和止盈,可以只管理图表品种,也可以在一个图表上管理所有品种。 只管理您的手动交易,不会触碰其他 EA 的交易。 大约每秒检查七次您的交易,而不仅仅在新报价到来时检查。 挂单的止损和止盈从挂单价格计算,因此挂单成交时保护已经就位。 如果距离小于经纪商的最小止损水平,会自动放宽到该最小值。 保本与追踪止损 当交易达到您设定的盈利时,EA 会将止损移动到开仓价。可选的偏移量可以锁定几个点的利润,而且保本止损永远不会被拉回原来的距离。追踪止损在保本移动之后启动,然后按照您选择的步长跟随价格。 如何设置 将 EA 加载到一个图表上并开启 Algo Trading。选择 Current Symbol 或 All Symbols,以及 Positions、Pending Orders 或 Both。以点数输入止损和止盈(在大多数 5 位小
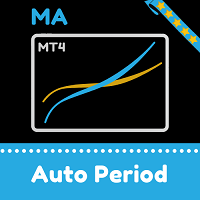
Moving averages change on the move. The indicator automatically selects the period for calculating moving averages. The more directional the movement, the longer the averaging period. When the trend slows down, the period of the moving averages decreases and they become faster. This allows you to react faster to a trend change.
The indicator works well in a trend or at a trend reversal point. In the sideways direction, the indicator can be used the other way around, for example, when a fast m
FREE

顾问工具,用于将交易从一个MT5帐户或MT4帐户复制到另一个MT4帐户。 Demo-version can be downloaded here .
您可以在净额结算和套期保值账户之间以任何组合复制头寸。 您可以通过仪器的名称和将被复制的位置的魔术数字来设置过滤器。 到目前为止,来源仅发送有关市场头寸的信息。 挂单在变成公开市场头寸时被处理.
在一个终端上,顾问以发送者模式(发送者)启动,在另一个终端上-在接收者模式(接收者)中启动。
终端必须在同一台服务器上工作,以便它们具有相同的共享数据文件夹,通过该文件夹交换数据。
安装程序
在发件人帐户的终端中,我们以发件人模式启动顾问,配置常规参数。 在接收器帐户的终端中,我们在接收器模式下启动顾问,为接收器配置常规参数和参数。
要复制MT4->MT5,请使用此产品作为发送者,另一个真实交易复制MT5产品作为接收者。
要复制MT5->MT4,请使用此产品作为接收方,另一个真实交易复制MT5产品作为发送方。 More detailed information in the post .

A unique Expert Advisor for processing reverse price divergence. The EA determines both trend direction and reversal patterns using reverse divergence. Divergence is the strongest signal of indicator analysis. Its essence lies in the formation of a new extremum in the price in the direction of the dominant trend if this extremum is not updated in the indicator. The price continues to move along the trend, while the indicator says that the trend has weakened and continues to move only by inertia,
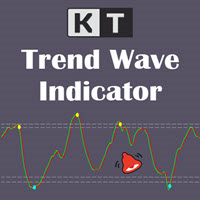
结合市场背景观察 Trend Wave 交叉 KT Trend Wave 将价格变化转换为一个清晰的振荡器,其中包含主波线和平滑信号线。指标显示在价格图表下方的独立窗口中,让趋势波、参考区域和交叉标记保持清楚,同时不会遮挡蜡烛图。 综合读取线条、区域和标记 亮绿色主线: 显示反应较快的趋势波。 红色信号线: 对趋势波进行平滑,便于比较方向变化。 浅蓝色向上标记: 当主线在下方参考区域向上穿过信号线时,标记多头交叉。 黄色向下标记: 当主线在上方参考区域向下穿过信号线时,标记空头交叉。 简洁调整振荡器反应 Wave Period 控制主波线对价格的反应速度,Avg. Period 控制应用于主波线的平滑程度,History Bars 限制处理的历史柱数量。这些设置帮助您在灵敏度、平滑度和历史深度之间取得平衡,无需处理冗长的技术参数。 选择已完成信号的通知方式 新柱开始时,提醒逻辑会检查已经完成的信号柱。您可以根据自己的流程组合使用弹窗、带可选文件的声音提醒、电子邮件和手机推送通知。 可将 MetaTrader 4 版 KT Trend Wave 用作视觉确认工具,结合您自己的市场分析来研
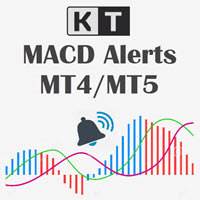
清晰的 MACD 动量信号 KT MACD Alerts 通过简洁的彩色 MACD 显示,帮助交易者识别市场方向和动量的变化。看涨与看跌交叉清晰易辨,图表垂直线和灵活的提醒方式可帮助您及时关注每一个新信号。 信号在蜡烛图收盘后得到确认,让您能够清晰、一致地查看图表中的 MACD 动量变化。 彩色显示看涨与看跌 MACD 状态。 清晰的垂直线,便于快速定位交叉信号。 可调整 MACD 周期和应用价格。 可自定义线条颜色、宽度、样式和图表延伸方式。 九周期 MACD 扫描器 内置面板可显示当前图表品种在九个时间周期上的 MACD 方向:M1、M5、M15、M30、H1、H4、D1、W1 和 MN1。每一行根据最新确认的数据显示 Bullish、Bearish 或 Neutral,让您能够快速比较短期动量与更广泛的市场方向。 扫描器直接读取每个时间周期的 MACD 信息,并在后台平稳刷新。随着市场历史数据可用,面板会自动更新为最新确认的方向。 灵活提醒与轻松自定义 弹窗、可选 WAV 声音、电子邮件和手机推送通知。 清晰的看涨与看跌交叉消息,并包含品种和时间周期。 可在设置中显示或隐藏多周期

KT Heiken Ashi Alert 基于标准的平均足蜡烛图绘制买入和卖出箭头,并发出交易提醒。对于希望将 Heiken Ashi 应用于交易策略的交易者来说,这是一个必备工具。 当 Heiken Ashi 从空头状态变为多头状态时,绘制买入箭头。 当 Heiken Ashi 从多头状态变为空头状态时,绘制卖出箭头。 支持手机通知、电子邮件、声音和弹窗提醒功能。
什么是 Heiken Ashi? 在日语中,“Heiken Ashi” 的意思是“平均蜡烛”。它用于使蜡烛图更加易于阅读和识别趋势。交易者可以使用 Heiken Ashi 进行进场和出场决策。颜色的变化通常代表市场方向的变化。
重要提示
不建议将 Heiken Ashi Alerts 作为单独使用的指标,应与其他技术指标结合使用以获得更准确的分析。 趋势的改变通常从一根具有上下影线的小蜡烛开始。 没有上影线的红色蜡烛表示强烈的下跌趋势。 没有下影线的蓝色蜡烛表示强烈的上涨趋势。
Heiken Ashi 计算公式 Heiken Ashi 蜡烛图与普通的日本蜡烛图类似,但计算方式不同。 开盘价 =(上一根蜡烛的开盘价 +

KT Pip Counter 是一款简洁而实用的指标,可在实时环境中向交易者呈现关键数据与数值,包括盈亏、点差及剩余时间等。借助这类及时而准确的信息,交易者即便在激烈的市场行情中也能保持清晰的判断,提高决策速度与操作信心,从而获得更佳的交易体验与风险控制。
功能
实时显示当前盈亏,可按货币、点数及百分比三种方式呈现。 展示最新点差,帮助评估交易成本。 提示本根K线结束前的剩余时间,方便把握节奏。 盈亏状态采用不同颜色方案,一目了然。 文本位置与排版完全可自定义,适应个人习惯。 占用 CPU 资源极低,确保平台流畅运行。
输入参数 Account P&L: 设为 true 时显示整个账户的盈亏;为 false 时仅显示当前品种盈亏。 可调节颜色与字体大小,满足视觉需求。 Show After Current Bar: 设为 true 时信息在当前K线结束后显示,否则固定在图表角落。 其余参数均为直观设置,易于理解与使用。

KT Pivot Points 会根据最新市场数据自动在图表上绘制每日、每周和每月的枢轴点位。这是外汇市场中广泛使用的技术分析工具之一,用于识别潜在的支撑和阻力区域。
功能特点
当价格触及枢轴点时发送提醒。 每种枢轴点类型都支持全面自定义。 无须复杂设置即可显示日线、周线和月线的枢轴点位。 占用 CPU 资源极少,计算速度快。 可与图表上的其他指标兼容使用。
什么是枢轴点 枢轴点是通过上一交易日(或交易周期)的最高价、最低价和收盘价计算出的平均值。 通过计算得出的枢轴点可以预测未来的支撑和阻力位,帮助判断价格在这些关键水平附近的走势。 通常认为,如果价格高于枢轴点,市场情绪偏多;反之,则偏空。
枢轴点计算公式
我们使用前一天、一周或一个月的最高价、最低价和收盘价来计算枢轴点水平。 P = (H + L + C) / 3 R1 = P + (P − L) = 2×P − L S1 = P − (H − P) = 2×P − H R2 = P + (H − L) S2 = P − (H − L) R3 = H + 2×(P − L) = R1 + (H − L) S3 =
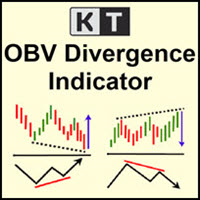
KT OBV Divergence 显示价格与 OBV(On Balance Volume)指标之间形成的常规和隐藏背离信号。
功能特点
为了提高准确性并减少图表杂乱,非对称背离信号将被自动忽略。 支持趋势反转和趋势延续两种交易策略。 完全兼容 Expert Advisor,可直接集成使用。 可用于设置入场点和出场点。 支持所有 MetaTrader 平台的提醒和通知功能。
什么是背离?
在技术分析中,如果价格创出新高,震荡指标也应创出新高;如果价格创出新低,指标也应跟随创出新低。当这种同步关系被打破时,说明价格与指标之间出现了背离。 背离主要分为两种类型: 常规看涨背离: 当价格创出新低,而 OBV 指标却形成更高的低点。 常规看跌背离: 当价格创出新高,而 OBV 指标却形成更低的高点。 隐藏看涨背离: 当价格形成更高的低点,而 OBV 指标却创出更低的低点。 隐藏看跌背离: 当价格形成更低的高点,而 OBV 指标却创出更高的高点。 “常规背离用于判断趋势反转,而隐藏背离则用于识别趋势延续。”

KT Currency Strength Meter(货币强弱指标)通过对主要外汇货币对应用聚合数学公式来衡量各个货币的强弱。 该指标通过计算固定周期内的多头与空头K线来判断强弱。系统会根据这些数据进行实时排序,从而确定哪些货币最强、哪些最弱,并持续更新它们的排名。
优势
通过避免买入强势货币对抗弱势货币的信号,即刻优化您的交易策略。 帮助避免无意的对冲和过度交易行为。 规避高风险的逆趋势交易,即不要买入最弱的货币对抗最强的货币,反之亦然。 有助于剔除会互相抵消的交易持仓。 指标通过实时数据持续更新,确保最新表现。 程序代码轻量,不占用CPU资源,不影响其他策略或指标的正常运行。 每种货币都有专属颜色,便于快速识别与区分。 参数设置简单直观,无需复杂配置。
专业建议 由于数据来源为当前时间框架,请避免在低周期中使用,容易产生频繁且不稳定的波动。 在重要新闻事件期间,请勿过度依赖指标,因为基本面优先于技术面。 建议作为确认工具使用,而非主要交易信号源。 想要结合货币相关性分析?欢迎查看我们的进阶版 货币强度与相关性指标 ,它将更高级的强度算法与相关矩阵结合。
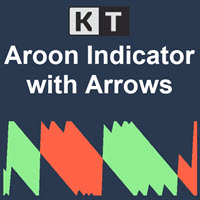
KT Aroon振荡器是对最初由Tushar Chande在1995年开发的原始Aroon振荡器的改进版本。它通过测量当前最高价和最低价之间的时间间隔,并根据该推断来计算市场趋势的方向和强度。 它基于这样一个理念:在上升趋势中,价格会连续创出新高;而在下降趋势中,则会不断创出新低。 买入信号: Aroon向上线穿越Aroon向下线时发出买入信号。
卖出信号: Aroon向下线穿越Aroon向上线时发出卖出信号。
功能特点
配有上下箭头,可在价格图表上标出Aroon信号。 有效展示市场趋势方向。 图表清晰简洁,没有任何杂乱。 支持所有Metatrader警报类型。
输入参数 周期: 用于计算Aroon Up和Aroon Down线的周期。 显示上下箭头: 设为True时,将在图表上显示每一个新信号的箭头。 警报设置: 可配置弹窗、声音、手机通知和邮件等多种警报方式。
关于Aroon的更多信息 Aroon振荡器与其他常见振荡指标不同,因为它结合了时间与资产价格。在日线图中,你可以这样理解它: Aroon Up: 表示自25日最高价以来过去的天数。
Aroon Down: 表示自2
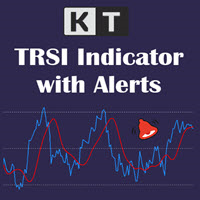
KT TRSI 是一种振荡器,由 RSI(相对强弱指数)、EMA(指数移动平均线)和 SMA(简单移动平均线)组合构建而成。与经典的 RSI 相比,TRSI 因为引入了 SMA 的平滑效果而减少了假信号的出现。此外,该指标支持所有类型的 MetaTrader 警报功能。
简单进场规则
买入:当蓝线(RSI)上穿红线(TRSI)。 卖出:当蓝线(RSI)下穿红线(TRSI)。
进阶进场规则 买入:当蓝线(RSI)跌破超卖区,然后再次上穿超卖区,同时红线(TRSI)出现多头交叉。 卖出:当蓝线(RSI)突破超买区后,再次跌破超买区,同时红线(TRSI)出现空头交叉。
使用 TRSI 时,建议配合其他指标和信号确认,以获得更稳健的交易决策。
TRSI 公式
三重 EMA = RSI 的三次 EMA。 TRSI = 三重 EMA 的 SMA,向右偏移 3 根 K 线。

直接在图表上监控每次布林带触碰 KT Bollinger Bands Alert 在图表上显示布林带上轨、中轨和下轨,并监控当前蜡烛是否触碰您选择的轨道。您可以启用符合自己交易方法的触碰事件,让指标在关键时刻提醒您,同时继续关注其他市场机会。 随时查看三条轨道的当前数值 可选价格标签会在图表上跟随上轨、中轨和下轨的实时数值。三条轨道均可独立设置颜色,便于在您的图表布局中清楚区分外部边界和中间基准线。 设置计算方式和提醒流程 布林带设置: 调整周期、偏差、位移和应用价格。 图表历史: 选择布林带显示的历史柱数量。 轨道选择: 分别开启或关闭上轨、中轨和下轨触碰提醒。 提醒间隔: 设置两次提醒之间的最少分钟数,以管理重复的触碰通知。 按需要选择通知方式 声音、弹窗、电子邮件和手机推送通知可任意组合使用,声音文件也可以选择。提醒消息会标明交易品种、时间周期和被触碰的轨道,便于快速返回相应图表。 无论您关注外轨测试、中轨附近的反应,还是波动边界的变化,KT Bollinger Bands Alert 都能围绕交易者熟悉的布林带提供清晰的图表显示和实用的提醒流程。

KT SuperTrend 在价格图表上提供一条清晰的方向线。处于上涨趋势时,线条以阶梯形式位于价格下方,可作为跟踪走势的参考。处于下跌趋势时,线条移动到价格上方并跟随市场下行。由于距离基于平均真实波幅计算,线条会随着波动率的扩大或收缩而自动适应。 当K线收盘穿过 SuperTrend 线时,方向会发生变化。收盘价位于线上方会标记上涨趋势信号,收盘价位于线下方则会标记下跌趋势信号。图表还会持续显示最近的信号方向和入场价格,因此您无需翻查旧K线也能了解当前状态。 分三步阅读图表 查看当前线条: 线条位于价格下方时支持上涨判断,位于价格上方时支持下跌判断。 比较不同周期: 内置扫描器显示从 M1 到月线的 SuperTrend 方向。您所交易的多个周期方向一致时,整体市场结构会更容易判断。 检查最近一次变化: 通过图表上的最近信号和入场价格,了解当前方向从何时开始,以及价格从那时起已经运行了多远。 控制线条的反应速度 周期决定波动率读数使用多少价格历史,乘数决定价格与线条之间的距离。较紧的设置反应更快,方向变化也更频繁。较宽的设置会给价格更多空间,并更关注较大的走势。您可以根据实际交易的品
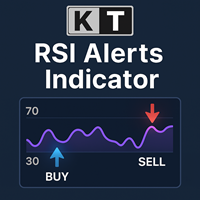
KT RSI Alerts 是对相对强弱指标(RSI)振荡器的个性化实现,能够在以下四种自定义事件中提供信号和提醒: 当 RSI 进入超买区域时。 当 RSI 离开超买区域时。 当 RSI 进入超卖区域时。 当 RSI 离开超卖区域时。
功能特点 非常适合关注 RSI 在超买/超卖区域中变动的交易者使用。 代码轻巧,不占用大量内存和资源,运行效率高。 实现了所有 MetaTrader 的提醒和通知功能。
相对强弱指数(RSI)的历史 RSI 由 J. Welles Wilder 开发,并于 1978 年首次发表于其著作《技术交易系统的新概念》和当年 6 月的《Commodities》杂志中。RSI 被归类为动量指标,它衡量价格变动的速度和幅度。RSI 的计算方法是将上涨收盘次数与下跌收盘次数的比值转换为指数值。

一眼掌握市场方向 KT Trend Filter 将改进的趋势分析方法转化为价格图表上的一条清晰彩色线。无需叠加多个指标,即可快速识别市场处于上涨、下跌还是横盘状态。默认 Trend Period 为 200,可提供较广泛的方向视角,同时让当前状态保持清晰可见。 把趋势方向变成清晰的视觉信息 蓝色 Uptrend: 突出显示看涨市场状态,帮助您专注于符合自己策略的做多机会。 鲑红色 Downtrend: 突出显示看跌市场状态,帮助您专注于符合自己策略的做空机会。 卡其色 Sideways: 当趋势条件不够清晰时,更容易识别盘整和混合方向。 在当前交易图表上,可将该线作为进场、持仓管理和多周期配合的快速视觉筛选工具。 通过九个时间周期掌握更完整的趋势画面 可选的 MTF Scanner 会显示 M1、M5、M15、M30、H1、H4、D1、W1 和 MN1 的 Uptrend、Downtrend 或 Sideways 状态。无需切换图表,即可将当前周期与更短和更长周期进行比较。只需要图表线时可以隐藏该面板。 已完成K线形成新的 Bullish、Bearish 或 Sideways 状态时

KT Forex Volume 以彩色柱状图的形式显示货币对的买入和卖出成交量。成交量由某一资产的买入和卖出交易构成。 在外汇市场中: 如果买入量大于卖出量,该货币对的价格通常会上涨。 如果卖出量大于买入量,该货币对的价格通常会下跌。
功能特点 通过使用点差成交量数据进行确认,避免不良交易。 帮助您跟随市场上的大资金参与者。 集成所有 Metatrader 警报提醒功能。
关于 Tick 成交量的使用 与其他市场不同,现货外汇市场是一个非集中式市场,因此零售交易者很难获得真实准确的成交量数据。 资深外汇交易员 Caspar Marney 于 2011 年提交的一份研究报告指出,Tick 成交量与实际成交量之间存在高度相关性和准确性。
柱状图计算公式
KT Forex Volume 指标基于 Chaikin 振荡器计算得出。该振荡器由 Marc Chaikin 提出,通过测量快速和慢速移动平均线之间的累积/分布关系来构建。
N = [(收盘价 - 最低价) - (最高价 - 收盘价)] / (最高价 - 最低价) M = N * 成交量(周期) ADL = M(前一周期) + M
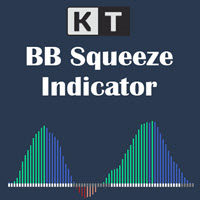
在动量扩张前看见波动率收缩 KT BB Squeeze 将波动状态与动量方向集中在一个清晰的振荡器中。它比较 Bollinger Bands 与 Keltner Channels,显示市场处于压缩还是扩张阶段,同时用零轴上下的柱状图呈现动量的发展。 灰色圆点: Bollinger Bands 位于 Keltner Channels 内部,表示挤压或收缩阶段。 白色圆点: Bollinger Bands 位于 Keltner Channels 外部,表示扩张阶段。 围绕零轴读取四种动量状态 彩色柱状图将方向和强弱分开呈现,便于判断多头或空头动量是在增强还是开始减弱。 绿色柱: 多头动量位于零轴上方并继续增强。 蓝色柱: 多头动量仍在零轴上方,但正在减弱。 红色柱: 空头动量位于零轴下方并继续增强。 鲑红色柱: 空头动量仍在零轴下方,但正在减弱。 标记扩张信号并跟踪动量减弱 当挤压之后出现白色扩张圆点,而且零轴上方或下方的动量正在增强时,指标可以在价格图表上绘制多头或空头垂直线。记录信号后,可选的动量减弱提醒会在当前走势发生变化时再次提示您。 从实用的默认视图开始 预设的 Momentum
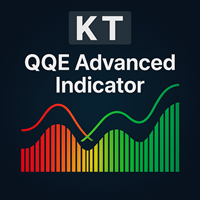
KT QQE Advanced 是对经典 QQE 振荡指标的改良版本,通过彩色柱状图配合快线与慢线 Trailing Line(TL)更直观、更精细地呈现市场动向,让交易者在瞬息万变的行情中也能一眼捕捉强弱转换、动能变化与潜在买卖区间。
与传统 QQE 不同,KT QQE Advanced 采用柱状体并附带超买/超卖水平,使过度延伸的行情一目了然,有助于及时做出高概率决策。
应用场景
借助多周期(MTF)扫描器,跨越所有时间周期快速捕捉买卖信号。 更精准地判断趋势方向,避免逆势操作。 及时识别超买/超卖状态,规避追高杀跌风险。 直观展示价格动能强弱,辅助顺势加仓或减仓。
输入参数 RSI 周期 平滑周期 MTF 扫描器 提醒设置
QQE 究竟是什么? QQE 全称 Quantitative Qualitative Estimation(定量定性估测)。它基于超平滑 RSI 与 ATR 的结合,既保留 RSI 的动量属性,又通过波动率因子过滤噪音。 不同于普通 RSI,QQE 采用 Wilder RSI,并用改良的指数移动平均进行平滑处理。 Wilder 平滑公式:前一 MA

Magic Night is an automated trading system that uses a channel indicator and candlestick patterns to open and close trades.
Trades every day at a specific time.
Doesn't use grid, martingale or other dangerous money management methods.
Timeframe М5, currency pairs EURAUD, EURCAD, GBPCAD, GBPUSD Minimum deposit 70 usd.
Live signal https://www.mql5.com
Instructions for installing https://Blogs Magic Night
Download set files https://Sets Magic Night
Settings EA Order_Comment - Order com

Bitsgap scalping bot is a fully automatic scalping trading system. This robot automatically analyzes the market using the ATR indicator. Then the robot automatically opens and closes orders. The robot automatically calculates the lot of opened trades to achieve maximum efficiency with minimal drawdown.
Recommendations: run the robot on an ECN account. minimum deposit 200$ currency pair GBPUSD timeframe H1
Robot Advantages: does not use martingale. does not use a grid. does not use hedging. do

Trading with the help of the MACD indicator has become even more convenient. Flexible settings will help you choose what you really need in your trading. Use the strategy that you need - the indicator uses 3 strategies. Download the demo right now! I recommend watching my advisor - Night Zen EA Subscribe to my telegram channel, link in my profile contacts - my profile See also my other products on mql5.com - my products Advantages of the indicator: In this indicator, the interpretation of th
FREE

Displays time lines based on your custom time zone offset (Note: 30-minute offsets are not supported). It also displays price lines at clean, round intervals (e.g., 100.000, 100.010, 100.020). By default, MT4 displays grid lines based on the broker's server time and price, which often results in awkward, uneven placements that can be highly confusing. This indicator solves that by drawing grid lines exactly where you want them—at intuitive time offsets and price levels. It is highly optimized an

EA SCALPER GHOST PRO
This is single Entry type EA. It use smart alghoritme to detect market movement. It also use Stop loss and take profit . EA will not use any dangerous system like martingale, grid, averaging etc which can cause account blown in a second Tis EA use More than one pair to reduce risk. Right now im using 13 pair at the same time
Settings Options: TF M5 Pair : Please use all pairs together (7 PAIRS) USDCHF, EURUSD, , AUDUSD, EURGBP, EURAUD, AUDCAD, EURCAD
USE SETFILE ON EACH
MACD Divergence Scanner is a multi-timeframe and multi-symbol dashboard and alert that checks all timeframes and symbols to find regular and hidden divergences between price chart and MACD indicator. This divergence scanner is integrated with support and resistance zones so you can check the MACD divergences in the most important areas of the chart to find trend reversals in the price chart. Download demo version (works on M 1,M5,M30,W1 timeframes) Full description of scanner parameters ->

Place Forex trades in different Metatrader accounts at the same time with Local Trade Copier software.
Become a private and independent account manager!
CopyTrade System will allowed you to managment account as Profissional...
Open two separate metatrader accounts, place same EA in experts folder... Reboot MT4 platforms, place EA Master on one Platform, and EA Slave on another platform.
How to use: - Place manual trades on Master account, they will be copied on Slave account. If deal w

This Expert Advisor is used in tandem with the FiboMagic Pro indicator https://www.mql5.com/ru/market/product/64978?source=Site +Profile
The FiboMagic Pro indicator shows you:
1) Which way to trade 2) Clear entry point criteria for breaking the counter-trend line in the Fibonacci structure 3) Clear exit criteria based on levels
The FiboMagic Auto Expert Advisor provides you with automatic trading based on the signals of the FiboMagic Pro indicator, namely:
- analyzes the breakout of the cou
A really simple strategy for be trading using M15 for EURUSD. Really impressive results... you just need to care your risk managment according to your account balance. Just one order at once... We suggest London and US opening hours. As you will see we are using GMT-3 for our operations... and a little volume and price action with Average True Range indicator in order to make decisions. Any additional question, just let me know.
Simple indicator that supports decision makers. You will have the candles directions for different timeframes on your screen. That will allowed you to be one more scenario to analyze before you open your orders. In case you would like to have more details, just let me know.. so we can add it to the chart. Multicurrency that in inform you the directions for multi-timeframes!

It is a new indicator that frames the price movement and tracks it. It consists of oscillation channel and its center line CL . For its calculation it is only necessary to introduce the amplitude of the channel. Because of this, it is a non-lagging indicator as it is not calculated based on a number of previous candlesticks. It removes any level of noise , showing the underlying price movement cleanly via the center line . It allows you to easily identify the beginnings and ends of the trend ,

The programmable signal panel analyzes the charts of all available symbols and timeframes and sends a notification about the appearance of a trading signal. You can program all the necessary signals using the free binding indicator "Signal Collection". The binding indicator is provided with open source code. Thus, it is possible to program all the necessary signals for subsequent use in conjunction with the signal panel. The signal panel can not only analyze charts, but also manage these chart
FREE
The key level supply and demand indicator is the first supply and demand indicator with options to change settings to show different zones, giving you the choice to pick the zones you see are being respected the most and saving the settings.
Advantages
The key level supply and demand DOES NOT REPAINT unlike other supply and demand currently in the market. This gives you a massive advantage to scroll back and see how price reacted on previous levels. The key level supply and demand has the opt
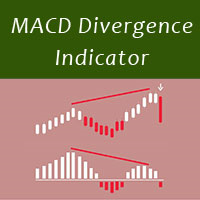
MACD divergence indicator finds divergences between price chart and MACD indicator and informs you with alerts (popup, mobile notification or email). Its main use is to find trend reversals in the chart. Always use the divergence indicators with other technical assets like support resistance zones, candlestick patterns and price action to have a higher possibility to find trend reversals. Three confirmation type for MACD divergences: MACD line cross zero level Price returns to previous H/L Creat
FREE

Run the robot on GBPUSD, H1 timeframe, minimum balance of $500 or more, ECN account type, leverage 1:100. The larger the balance, the smaller the drawdown will be. This robot analyzes the market using two indicators: ATR and Momentum. With the help of these two indicators, the robot finds points for opening trades. After the robot has opened trades, it starts to analyze them constantly. When the trade reaches the desired profit or loss, the robot closes it.
Recommendations for trading: ECN acc

Renko HMA Channel is a professional EA the uses Renko charts in combination with the Hull Moving Average.
Time Frame : This expert advisor works on all timeframes;
Account balance: it doesn't matter, but I recommend at least 1000 EUR or 1500 USD; Currency pair : Doesn't matter ; Warning! Do not use the default settings, always use optimization option in strategy tester to find the best settings for your broker, preferred chart and timeframe!
- Multiple user options, for finetuning

Currency Pair Information
Useful indicator to have the following information on the chart: 1. Asset Name 2. Current Spread 3. Current ATR of the actual time frame 4. Time to close of the candle
It is located at the top right of the chart. If you request it, I can add the parameterization of the location of the information.
Other tools:
AMS Forex System
hockfx Price Alert Pro
hockfx
FREE

About the Lyne indicator
Lyne is a Metatrader 4 (MT4) indicator, the essence of which is to transform the accumulated historical data.
The Lyne indicator makes it possible to detect various features and patterns in price dynamics that are invisible to the naked eye.
Based on this information, traders can anticipate further price movement and adjust their strategy accordingly.
This indicator has proven itself in the scalping strategy. The indicator works without repainting.

The Week7D indicator helps traders identify the day of the week on a price chart. It simply marks each period or each candle as the day of the week at the start of a new trading day. This allows traders to watch how prices move on any given day.
The Week7D indicator has several customization options that traders can use to change the visual representation of the indicator.
The variable "BarCount" changes the number of days during which the indicator will indicate the day of the week in each d
FREE

Levels Pro System рассчитывает канал движения цены, учитывая волатильность инструмента, бары и тренд, - и на основании расчетных данных показывает тренд и чертит уровни поддержки/сопротивления в очень удобном визуальном представлении. В индикатор встроена система определения критических точек (критических баров), которая позволяет трейдеру значительно проще выявлять истинный пробой уровня, ложный пробой, отскок от уровня, возможный сигнал на ранней стадии движения цены итд. Таким образом, торгов

Grid trading is executed when orders are placed above or below a set price, creating a grid of orders with rising and falling prices. Our patented trader makes it possible to open new grids at the average price, thereby increasing the chances of recovering a negative floating balance.
Unlike other trading strategies, our focus is on decreasing Bollinger bands. This means that if the market has abruptly moved into a region and is weakening, it is more vulnerable to a reversal. This innovative a
Этот индикатор является уникальным в своём роде, больше всего подходит для скальпинга на XAUUSD а также для торговли на более старших таймфреймах!
Уведомление сообщит самые важные точки входа, поэтому следует торговать по тренду. Идеален для скальпинга! The Best Trend Signals - трендовый мультивалютный индикатор, может использоваться на любых финансовых инструментах валюта, криптовалюта, металлы, акции, индексы. Рекомендуемый тайм-фрейм M15, M30, H1, H4, D1.
Как торговать с помощью индикатора
FREE

KT Average Daily Range(ADR) shows the upper and lower levels using the average daily range covered by the currency pair or the instrument. The average daily range is calculated using the chosen period in the input settings. ADR High: ADR upper level is found by adding the average daily range value to the current day's low.
ADR Low: ADR lower level is found by subtracting the ADR value from the current day's high.
Features
It shows the ADR levels with several other helpful information benefici

Simple Strategy Checklist Panel, as its name suggests, is a panel that works as a checklist, and can place up to twenty lines of text. This was created for traders who want to have their trading plan or to-do list at hand, a simple but useful product for many.
I will write this pointless paragraph since Metatrader asks me to put a minimum of 6300 characters, so I also explain that the list can also be used to make purchases from the supermarket! Example bread, milk, flour and much more... Enjo
FREE
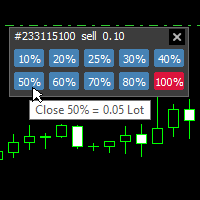
With this tool, you can easily and quickly close part of the trade . Click near the trade to display the closing panel. There are ten preset values for partial closing, but you can set your own values. You can also resize the panel according to Windows settings (125%, 150% ...) See the animation below for how it works. **********************************************************
Note: This tool does not work in the tester.

Minimum deposit is 1000$ , or 1000 Cent = 10$. (Recommended 1500$) Every 1000$ = 0.01 Lot. Please stick to the rules, as we want you to win, win and win! (Trading is risky, and there are no guarantees for winning)
Time frame: M1
Leverage : Higher the better
Spread: Lower the better
Account type : All types
(EA may enter hedge positions, if you want to disable this feature deactivate either Buy, or Sell

This indicator detects trade direction and sends notification to your mobile phone so that you can enter/exit a trade without having to be seated in front of desktop computer all day and night. Although you have to execute/send an order yourself, you can setup rules through the setting made available for proper lots size base on the available balance/fund you are trading with. The opportunity to take a profit at the right time and set reasonable stop loss that will not be overwhelming and gett

DayNight HighLow is base on support and resistance levels, as well as averages of highs and lows. It detects trade direction and sends notification to your mobile phone so that you can enter/exit a trade without having to be seated in front of desktop computer all day and night. Although you have to execute/send an order yourself, you can setup rules through the setting made available for proper lots size base on the available balance/fund you are trading with. The opportunity to take a profit

DayNight moving averages along with support and resistance make a remarkable difference if properly utilized This indicator detects trade direction and sends notification to your mobile phone so that you can enter/exit a trade without having to be seated in front of desktop computer all day and night. Although you have to execute/send an order yourself, you can setup rules through the setting made available for proper lots size base on the available balance/fund you are trading with. The opport

Minimum deposit is 1000$ , or 1000 Cent = 10$. (Recommended 1500$) Every 1000$ = 0.01 Lot. Please stick to the rules, as we want you to win, win and win! (Trading is risky, and there are no guarantees for winning)
Time frame: M1
Leverage : Higher the better
Spread: Lower the better
Account type : All types
(EA may enter hedge positions, if you want to disable this feature deactivate either Buy, or Sell f

Time frame: M1
Leverage : Higher the better
Spread: Lower the better
Account type : All types
(EA may enter hedge positions, if you want to disable this feature deactivate either Buy, or Sell from the setting)
Please please do not take unnecessary risks. (Trading is risky, and there are no guarantees for winning)
We wish you successful trading. (Trading is risky, and there are no guarantees for winning

KT Fisher Transform is an advanced version of the original Fisher Transform oscillator equipped with divergence detection, crossover alerts, and many more features. Originally it was developed by John F. Ehlers. It converts the asset's price into a Gaussian normal distribution to find the local extremes in a price wave.
Features
A light-weighted oscillator that efficiently identifies the upward and downward crossovers and marks them using vertical lines. It also finds regular and hidden diverg

Time frame: M1
Leverage : Higher the better
Spread: Lower the better
Account type : All types
(EA may enter hedge positions, if you want to disable this feature deactivate either Buy, or Sell from the setting)
Please please do not take unnecessary risks. (Trading is risky, and there are no guarantees for winning)
We wish you successful trading. (Trading is risky, and there are no guarantees for winning)
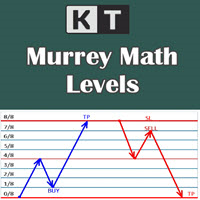
It shows the Murrey Math levels on chart and also provides an alert when price touch a particular level. T. Henning Murrey, in 1995, presented a trading system called Murrey Math Trading System, which is based on the observations made by W.D Gann.
Applications
For Murrey Math lovers, this is a must-have indicator in their arsenal. There is no need to be present on the screen all the time. Whenever the price touches a level, it will send an alert. Spot upcoming reversals in advance by speculatin

Only 1 copies left at a price of $99. Next price $199!
actual .set files (click me)
interactive panel manual (click me)
Version for MT5: Smart Start Smart Start is a smart trading system, the indicators of which allow it to be used both for trading with small deposits (fast acceleration) and for conservative trading. is a modernized trading indicator system that uses the MACD indicator to analyze the market. To analyze entry points, smart start takes into account the historical indica
KT Candle Timer shows the remaining time in the closing of the current bar. You can use the bar closing time for multiple purposes, including time and trade management during the trading hours.
Features
It also shows the Symbol spreads along with the remaining time. It offers two convenient timer display positions, i.e., chart corner or next to the current bar. From colors to text size, it offers full customization according to user preferences. It is optimized to work without using extensive c

KT Bullish Bearish shows the bullish/bearish regime of the market in the form of a colored histogram representing both of the market states alternately. Bull Market (Blue Histogram): A bull market indicates an uptrend when an instrument price rises over a continued period like days, months, or years. Bear Market (Red Histogram): A bear market indicates a downtrend when an instrument price rises over a continued period like days, months, or years.
Applications
It prevents trading against the big
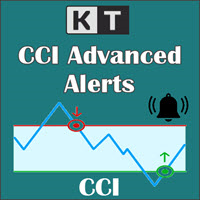
KT CCI Alerts is a personal implementation of the Commodity Channel Index (CCI) oscillator that provide signals and alerts on four custom events: When CCI enter in an overbought zone. When CCI exit from an overbought zone. When CCI enter in an oversold zone. When CCI exit from an oversold zone.
Features A perfect choice for traders who speculate the CCI movements within an overbought/oversold zone. Lightly coded without using extensive memory and resources. It implements all Metatrader alerts.

The Vortex Indicator was first presented by Douglas Siepman and Etienne Botes in January 2010 edition of Technical Analysis of Stocks & Commodities. Despite its based on a complex implosion phenomenon, the vortex is quite simple to interpret. A bullish signal is generated when +VI line cross above the -VI line and vice versa. The indicator is mostly used as a confirmation for trend trading strategies. The Vortex was inspired by the work of Viktor Schauberger, who studied the flow of water in tur

Time frame: M1
Leverage : Higher the better
Spread: Lower the better
Account type : All types
(EA may enter hedge positions, if you want to disable this feature deactivate either Buy, or Sell from the setting)
Please please do not take unnecessary risks. (Trading is risky, and there are no guarantees for winning)
We wish you successful trading. (Trading is risky, and there are no guarantees for winning
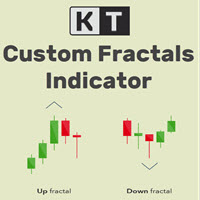
KT Custom Fractals is a personal implementation of the Fractal indicator first introduced by Bill Williams. With KT Custom Fractals you can choose a custom number of bars to allow to the left and right side of the fractal. For example, you can display the fractals that have "three" successive bars with the highest high in the middle and one lower high on both sides , or you can display the fractals that have "Eleven" consecutive bars with the lowest low in the middle and five higher lows on bot

KT Fractal Channel Breakout draws a continuous channel by connecting the successive Up and Down fractals. It provides alerts and also plots the Up and Down arrows representing the bullish and bearish breakout of the fractal channel.
Features
If you use Bill Williams fractals in your technical analysis, you must also include it in your trading arsenal. It can be very effective and useful for stop-loss trailing. A new market trend often emerges after a fractal channel breakout in a new direction.
MetaTrader 市场 - 在您的交易程序端可以直接使用为交易者提供的自动交易和技术指标。
MQL5.community 支付系统 提供给MQL5.com 网站所有已注册用户用于MetaTrade服务方面的事务。您可以使用WebMoney,PayPal 或银行卡进行存取款。
