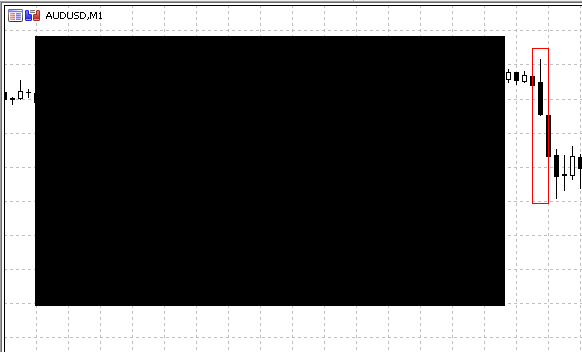
当我试图使用CGraphic时。创造,我得到一个马列维奇广场。

//+------------------------------------------------------------------+
//| RECTANGLE_to_csv.mq5 |
//| Copyright © 2016, Vladimir Karputov |
//| http://wmua.ru/slesar/ |
//+------------------------------------------------------------------+
#property copyright "Copyright © 2016, Vladimir Karputov"
#property link "http://wmua.ru/slesar/"
#property version "1.001"
#property script_show_inputs
#include <Graphics/Graphic.mqh>
//---
input string rectangle_name="RECTANGLE"; // rectangle name
input int sleeping=15000; // sleep (milliseconds)
//---
CGraphic m_graphic;
//+------------------------------------------------------------------+
//| Script program start function |
//+------------------------------------------------------------------+
void OnStart()
{
//---
int result_find=ObjectFind(0,rectangle_name);
Print("result_find: ",result_find);
if(result_find!=-1)
{
datetime from = (datetime)ObjectGetInteger(0,rectangle_name,OBJPROP_TIME,0);
datetime to = (datetime)ObjectGetInteger(0,rectangle_name,OBJPROP_TIME,1);
MqlTick tick_array_range[]; // массив для приема тиков
ResetLastError();
CopyTicksRange(Symbol(),tick_array_range,COPY_TICKS_INFO,(ulong)from*1000,(ulong)to*1000);
Print("Error: ",GetLastError());
if(GetLastError()!=0)
return;
double arr_ask[];
int size=ArraySize(tick_array_range);
ArrayResize(arr_ask,size);
for(int i=0;i<size;i++)
arr_ask[i]=tick_array_range[i].ask;
m_graphic.Create(0,"Deals",0,30,30,500,300);
m_graphic.CurveAdd(arr_ask,1);
Print("Цвет фона перед \"Update\": ",m_graphic.BackgroundColor());
m_graphic.Update();
Print("Цвет фона после \"Update\": ",m_graphic.BackgroundColor());
Sleep(sleeping);
m_graphic.Destroy();
}
}
//+------------------------------------------------------------------+
2016.12.11 09:06:02.528 Terminal MetaTrader 5 x64 build 1495 started (MetaQuotes Software Corp.)
2016.12.11 09:06:02.531 Terminal Windows 10 Pro (x64 based PC), IE 11.00, UAC, Intel Core i3-3120 M @ 2.50 GHz, RAM: 4882 / 8077 Mb, HDD: 357683 / 476372 Mb, GMT+02:00
2016.12.11 09:06:02.531 Terminal C:\Users\barab\AppData\Roaming\MetaQuotes\Terminal\D0E8209F77C8CF37AD8BF550E51FF075
2016.12.11 09:06:02.531 Terminal Windows 10 Pro (x64 based PC), IE 11.00, UAC, Intel Core i3-3120 M @ 2.50 GHz, RAM: 4882 / 8077 Mb, HDD: 357683 / 476372 Mb, GMT+02:00
2016.12.11 09:06:02.531 Terminal C:\Users\barab\AppData\Roaming\MetaQuotes\Terminal\D0E8209F77C8CF37AD8BF550E51FF075
在 "专家 "和 "杂志 "中都没有错误。
附加的文件:
RECTANGLE_to_csv.mq5
5 kb
o_O:
你没有在Update()之前做Redraw()。
你没有在Update()之前做Redraw()。
完成了,画出了一个图框,轴。没有图表本身。
还补充说,这是它的绘制方式。
....
m_graphic.Create(0,"Deals",0,30,30,500,300);
CCurve* curve = m_graphic.CurveAdd(arr_ask,CURVE_LINES);
curve.Color(clrBlack);
curve.Visible(true);
Print("Цвет фона перед \"Update\": ",m_graphic.BackgroundColor());
m_graphic.Redraw();
m_graphic.Update();
....
m_graphic.Create(0,"Deals",0,30,30,500,300);
CCurve* curve = m_graphic.CurveAdd(arr_ask,CURVE_LINES);
curve.Color(clrBlack);
curve.Visible(true);
Print("Цвет фона перед \"Update\": ",m_graphic.BackgroundColor());
m_graphic.Redraw();
m_graphic.Update();
....
***
Alexey Volchanskiy:
完成了,画出了一个图框,轴。没有图表本身。
还补充说,它是这样画的。
....
m_graphic.Create(0,"Deals",0,30,30,500,300);
CCurve* curve = m_graphic.CurveAdd(arr_ask,CURVE_LINES);
curve.Color(clrBlack);
curve.Visible(true);
Print("Цвет фона перед \"Update\": ",m_graphic.BackgroundColor());
m_graphic.Redraw();
m_graphic.Update();
....
m_graphic.Create(0,"Deals",0,30,30,500,300);
CCurve* curve = m_graphic.CurveAdd(arr_ask,CURVE_LINES);
curve.Color(clrBlack);
curve.Visible(true);
Print("Цвет фона перед \"Update\": ",m_graphic.BackgroundColor());
m_graphic.Redraw();
m_graphic.Update();
....
***
谢谢你!
工作版本(版本 "1.003")。
//+------------------------------------------------------------------+
//| RECTANGLE_to_csv.mq5 |
//| Copyright © 2016, Vladimir Karputov |
//| http://wmua.ru/slesar/ |
//+------------------------------------------------------------------+
#property copyright "Copyright © 2016, Vladimir Karputov"
#property link "http://wmua.ru/slesar/"
#property version "1.003"
#property script_show_inputs
#include <Graphics/Graphic.mqh>
//---
input string rectangle_name="RECTANGLE"; // rectangle name
input int sleeping=15000; // sleep (milliseconds)
//---
CGraphic m_graphic;
//+------------------------------------------------------------------+
//| Script program start function |
//+------------------------------------------------------------------+
void OnStart()
{
//---
ResetLastError();
int result_find=ObjectFind(0,rectangle_name);
if(result_find<0)
{
Print("ObjectFind Error: ",GetLastError());
return;
}
datetime from = (datetime)ObjectGetInteger(0,rectangle_name,OBJPROP_TIME,0);
datetime to = (datetime)ObjectGetInteger(0,rectangle_name,OBJPROP_TIME,1);
MqlTick tick_array_range[]; // массив для приема тиков
ResetLastError();
CopyTicksRange(Symbol(),tick_array_range,COPY_TICKS_INFO,(ulong)from*1000,(ulong)to*1000);
if(GetLastError()!=0)
return;
double arr_ask[];
int size=ArraySize(tick_array_range);
ArrayResize(arr_ask,size);
for(int i=0;i<size;i++)
arr_ask[i]=tick_array_range[i].ask;
m_graphic.Create(0,"Deals",0,30,30,500,300); // создает графический ресурс, привязанный к объекту чарта
CCurve *curve=m_graphic.CurveAdd(arr_ask,1); // создает и добавляет кривую (CCurve) на график
curve.Visible(true); // отображает кривую
m_graphic.Redraw(); // redraw grahic
m_graphic.Update(); // отображает на экране сделанные изменения
Sleep(sleeping);
m_graphic.Destroy(); // удаляет с чарта график и уничтожает графический ресурс
}
//+------------------------------------------------------------------+

附加的文件:
RECTANGLE_to_csv.mq5
5 kb
//--- trim the name
m_canvas.FontSizeSet(m_history.name_size);
if(m_canvas.TextWidth(name)>m_history.name_width)
{
while(m_canvas.TextWidth(name+"...")>m_history.name_width)
name=StringSubstr(name,0,StringLen(name)-1);
name+="...";
}
m_canvas.FontSizeSet(m_history.name_size);
if(m_canvas.TextWidth(name)>m_history.name_width)
{
while(m_canvas.TextWidth(name+"...")>m_history.name_width)
name=StringSubstr(name,0,StringLen(name)-1);
name+="...";
}
发现一个错误--当m_history.name_width较小时,无限次的while循环。
如何完全禁用右侧的 "历史"?
就我而言。
ǞǞǞ | 将所有曲线点的X坐标写入一个数组中 |
我应该把图形上所有绘制的点的 "x "坐标--以像素为单位的坐标--放入一个数组中?
检查。
//+------------------------------------------------------------------+
//| RECTANGLE_to_csv.mq5 |
//| Copyright © 2016, Vladimir Karputov |
//| http://wmua.ru/slesar/ |
//+------------------------------------------------------------------+
#property copyright "Copyright © 2016, Vladimir Karputov"
#property link "http://wmua.ru/slesar/"
#property version "1.000"
#property script_show_inputs
#include <Graphics/Graphic.mqh>
//---
input int m_width=500; // ширина
input int m_height=300; // высота
input int sleeping=15000; // sleep (milliseconds)
//---
CGraphic m_graphic;
//+------------------------------------------------------------------+
//| Script program start function |
//+------------------------------------------------------------------+
void OnStart()
{
//---
double arr_example[15]={1,2,3,4,5,6,7,8,9,10,11,12,13,14,15};
m_graphic.Create(0,"Example",0,30,30,m_width,m_height); // создает графический ресурс, привязанный к объекту чарта
CCurve *curve=m_graphic.CurveAdd(arr_example,1); // создает и добавляет кривую (CCurve) на график
curve.Visible(true); // отображает кривую
m_graphic.Redraw(); // redraw grahic
double arr_get_x[];
curve.GetX(arr_get_x); // записываем координаты X для всех точек кривой в массив
ArrayPrint(arr_get_x); // распечатываем массив
m_graphic.Update(); // отображает на экране сделанные изменения
Sleep(sleeping);
m_graphic.Destroy(); // удаляет с чарта график и уничтожает графический ресурс
}
//+------------------------------------------------------------------+
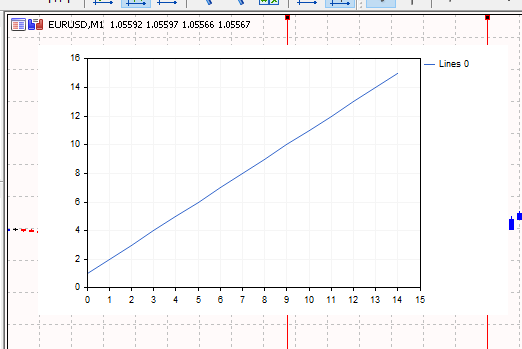
图是画出来的。

这是数组的打印结果--原来它包含绘制图表的数据,但不包含像素的 "x "坐标。
2016.12.11 19:03:09.691 GetX (EURUSD,M1) 0.0 1.00000 2.00000 3.00000 4.00000 5.00000 6.00000 7.00000 8.00000 9.00000 10.00000 11.00000 12.00000 13.00000 14.00000
附加的文件:
GetX.mq5
4 kb
Vladimir Karputov:
我必须把图形上所有绘制的点的 "x "坐标--以像素为单位的坐标--输入一个数组?
我并没有说什么 "像素"。
你只提交了一个Y阵列。所以x是一个简单的序数。GetX是正确的。
寻找新函数的应用 - 特别是Grahic 库(科学图)。
例如,我们用一个矩形对象在图形上选择一个区域并运行脚本。
//| RECTANGLE_to_csv.mq5 |
//| Copyright © 2016, Vladimir Karputov |
//| http://wmua.ru/slesar/ |
//+------------------------------------------------------------------+
#property copyright "Copyright © 2016, Vladimir Karputov"
#property link "http://wmua.ru/slesar/"
#property version "1.00"
#property script_show_inputs
#include <Graphics/Graphic.mqh>
//---
input string rectangle_name="RECTANGLE"; // rectangle name
input int sleeping=15000; // sleep (milliseconds)
//---
CGraphic m_graphic;
//+------------------------------------------------------------------+
//| Script program start function |
//+------------------------------------------------------------------+
void OnStart()
{
//---
int result_find=ObjectFind(0,rectangle_name);
Print("result_find: ",result_find);
if(result_find!=-1)
{
datetime from = (datetime)ObjectGetInteger(0,rectangle_name,OBJPROP_TIME,0);
datetime to = (datetime)ObjectGetInteger(0,rectangle_name,OBJPROP_TIME,1);
MqlTick tick_array_range[]; // массив для приема тиков
ResetLastError();
CopyTicksRange(Symbol(),tick_array_range,COPY_TICKS_INFO,(ulong)from*1000,(ulong)to*1000);
Print("Error: ",GetLastError());
if(GetLastError()!=0)
return;
double arr_ask[];
int size=ArraySize(tick_array_range);
ArrayResize(arr_ask,size);
for(int i=0;i<size;i++)
arr_ask[i]=tick_array_range[i].ask;
GraphPlot(arr_ask,1);
m_graphic.Destroy();
Sleep(sleeping);
ObjectsDeleteAll(0,"Graphic",0,OBJ_BITMAP_LABEL);
ChartRedraw();
}
}
//+------------------------------------------------------------------+
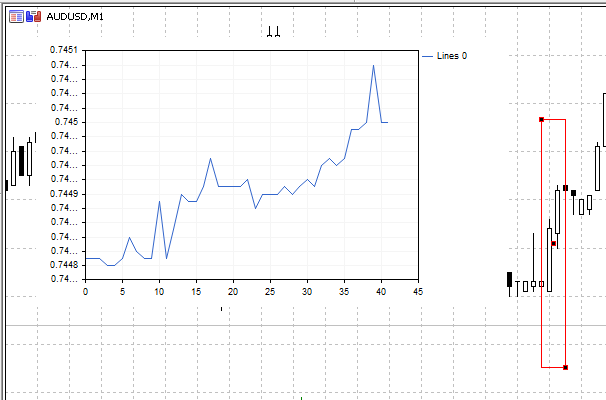
结果是,我们看到了一个按刻度绘制的图表,按Ask。