JCStatistics
- Göstergeler
- Hai Dong Zhang
- Sürüm: 5.0
- Güncellendi: 28 Haziran 2023
JCStatistics
简繁数据统计
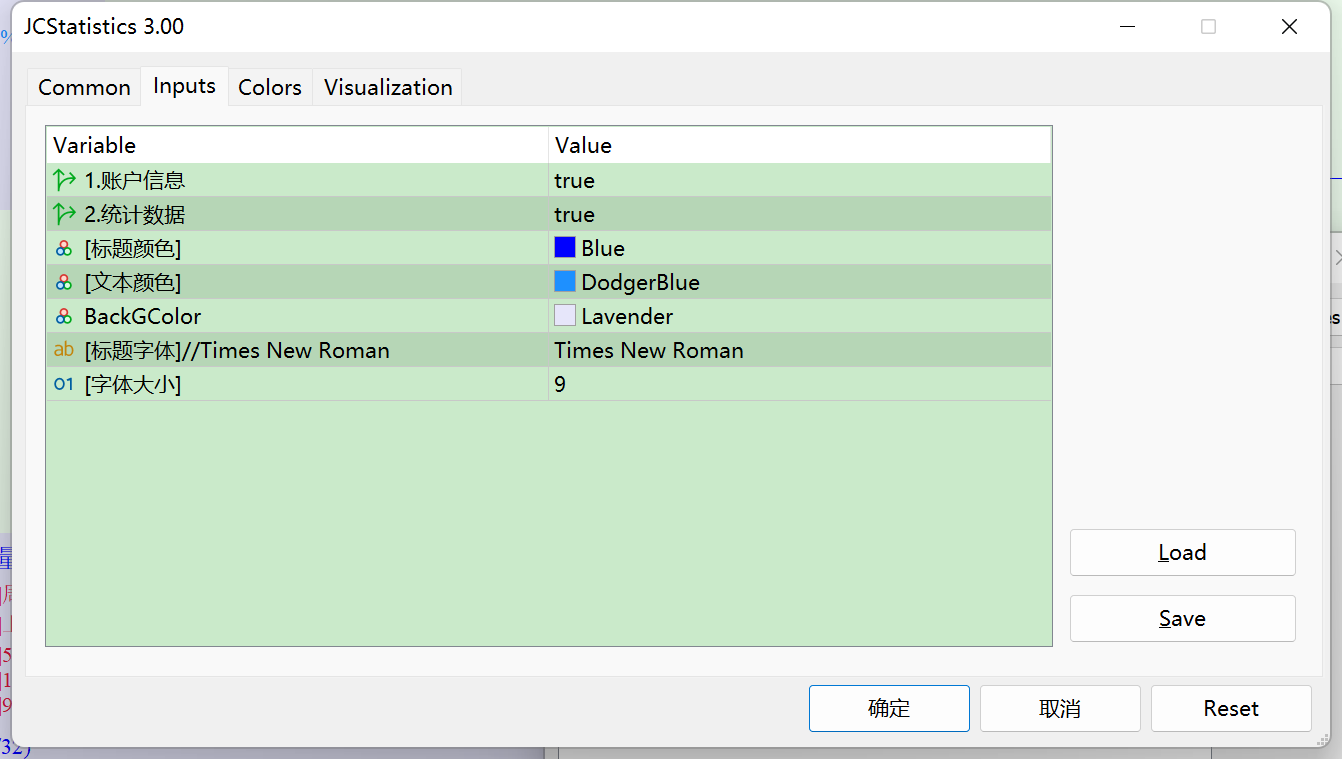
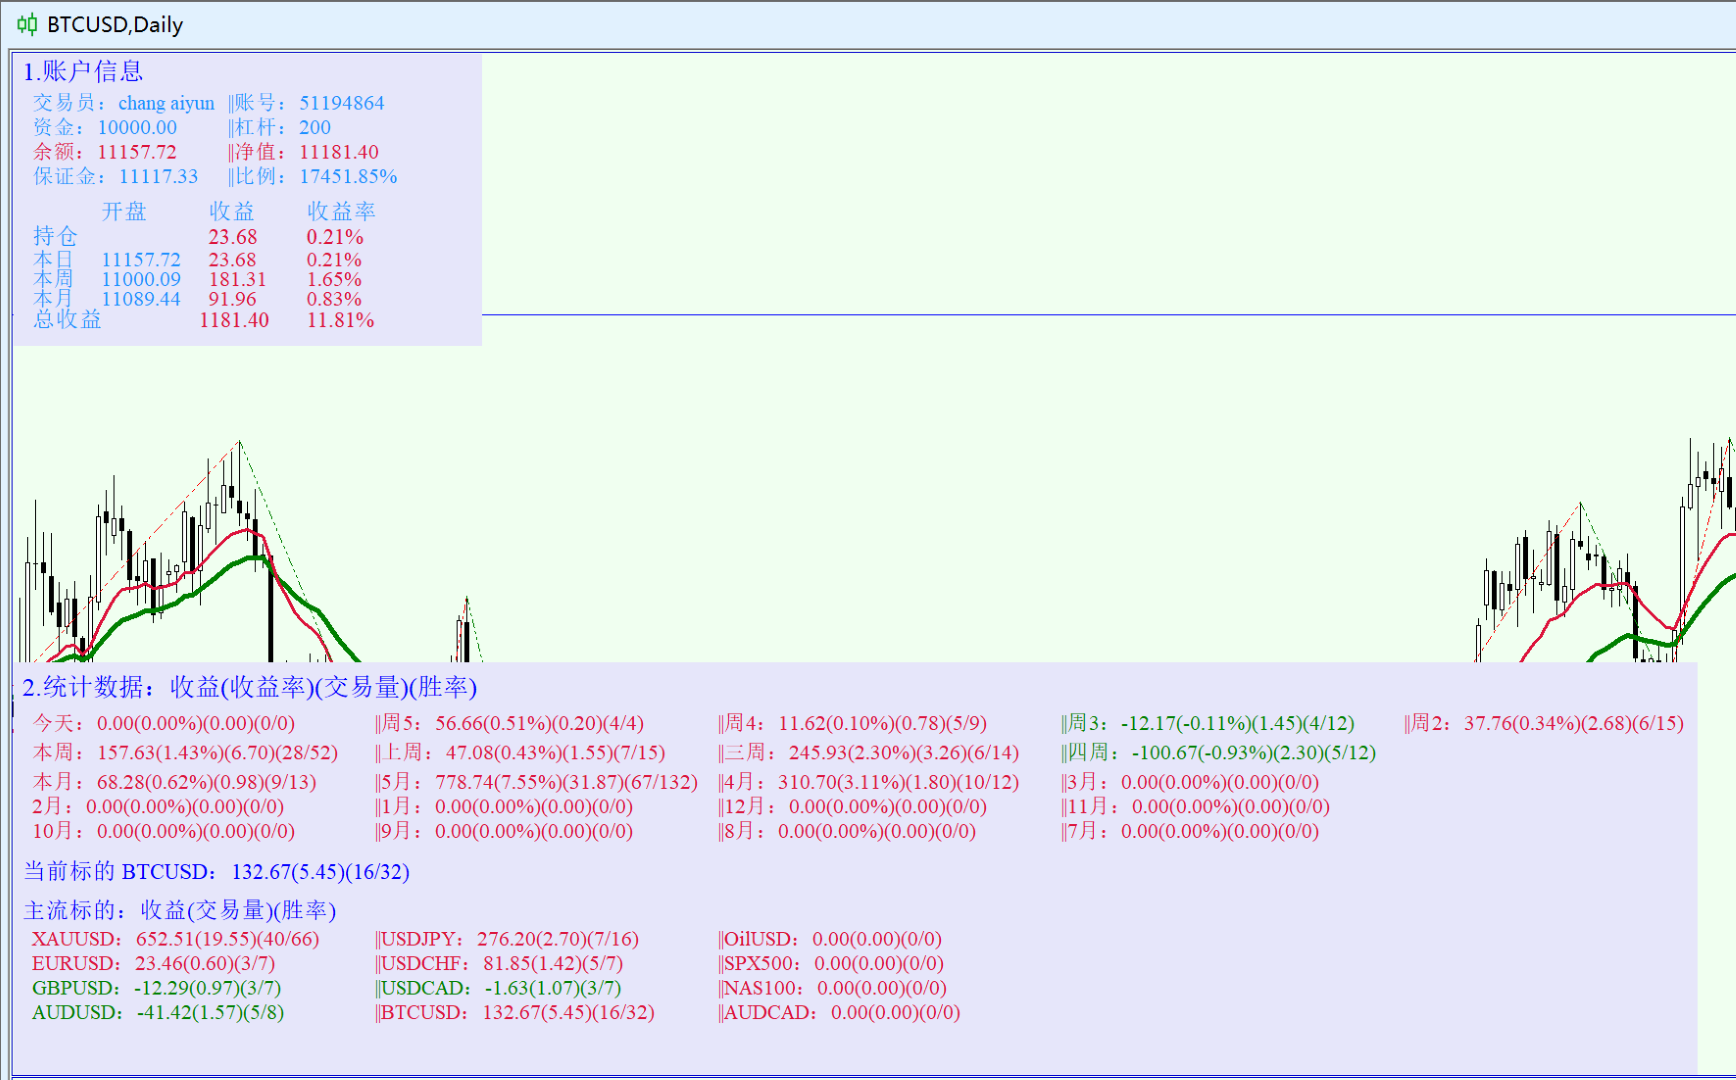
1.显示账户信息:内容显示
交易员、账号、本金、杠杆、保证金、保证金比例、余额、净值;
日周月开盘余额、持仓收益、日收益、周收益、月收益;
收益为正时显示红色字体,收益为负时显示绿色字体;
日收益低于-5%时显示CircuitBreak;
总收益低于-10%时显示MarginCall;
2.显示统计数据:收益(收益率)(交易量)(胜率)
5日数据;4周数据;12月数据;
3.当前标的统计:Symbol()收益(交易量)(胜率)
4.主流标的统计:收益(交易量)(胜率)
可以选择性显示账户信息、数据信息,调整显示颜色,调整字体,调整字体大小。
指标删除后自动删除桌面文字及背景。
备注:如遇使用问题,请联系邮箱:16692618587@qq.com.