Msht Price Pattern MT4

Instantly spot simple candlestick patterns with MSHT Price Pattern

MSHT PRICE PATTERN can automatically detect more than 200 different candlestick patterns, including multi-candle patterns. This makes it easy for you to see if what you care about is present on a chart or not at a glance, and reduces the amount of time you have to stare at charts to check off items on your investment checklist. Candlestick Pattern Recognition is supported on charts, alerts, in scanners and smart checklists.


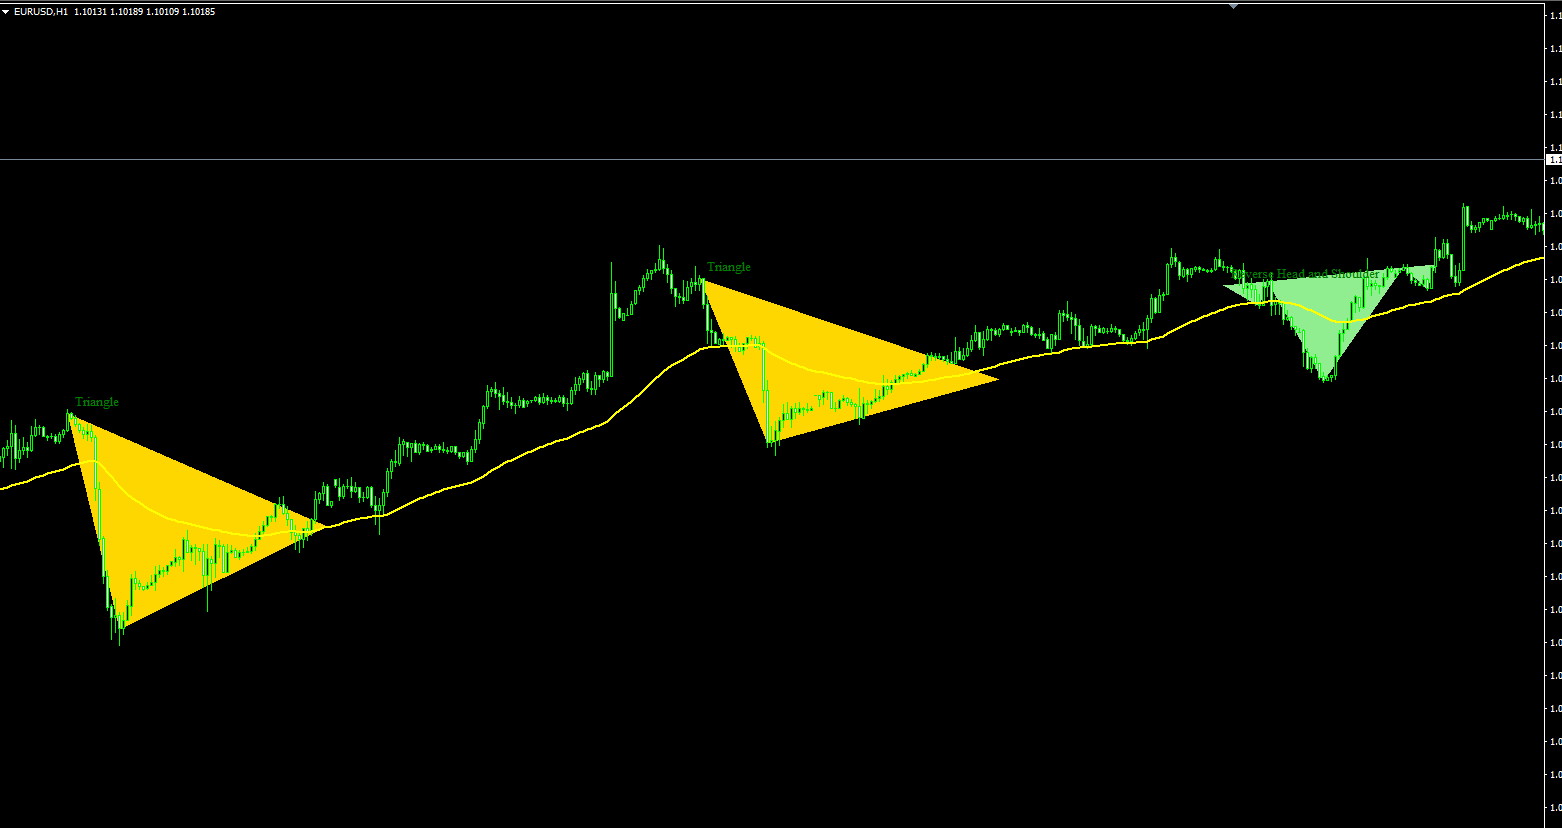
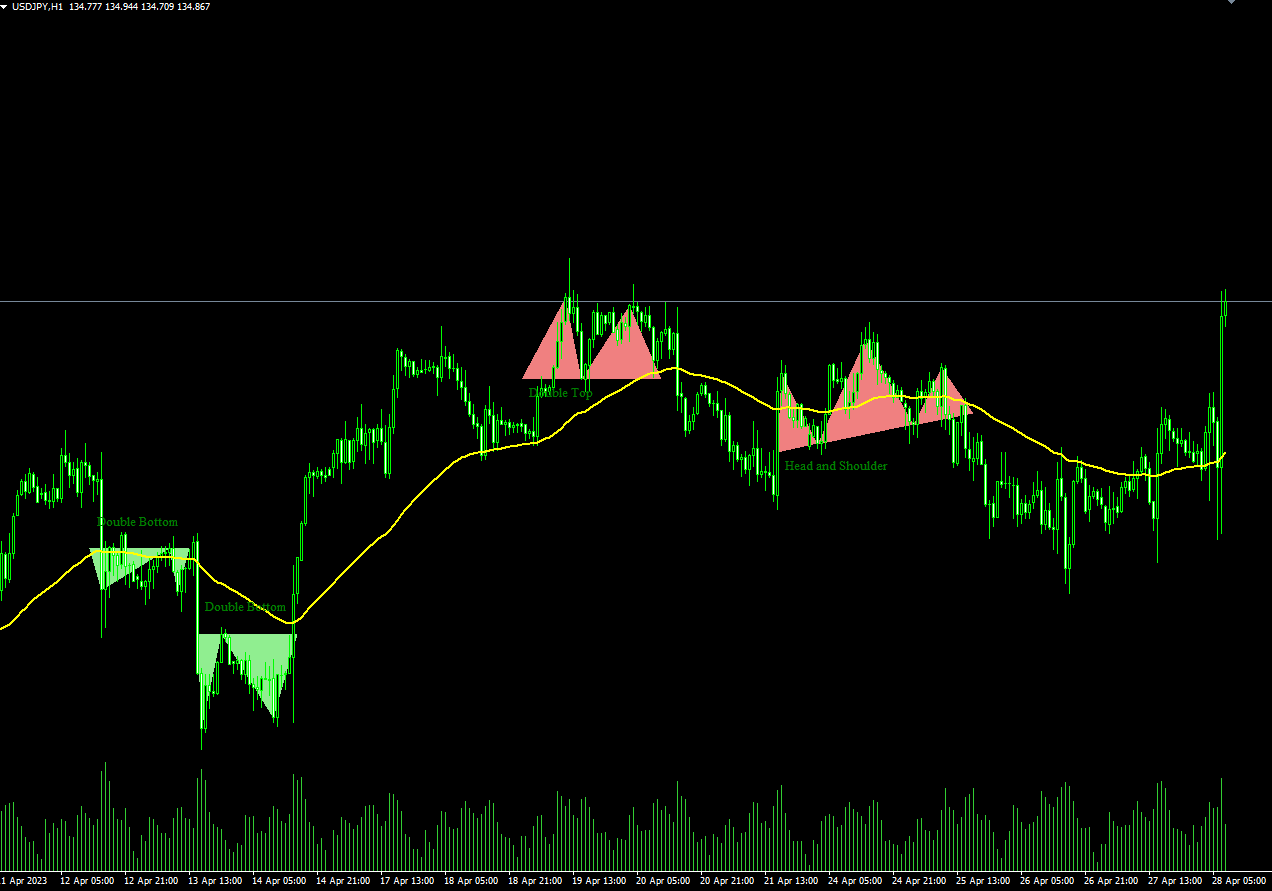
All new Chart Pattern Recognition brings MSHT PRICE PATTERN's automated analysis capabilities to a new level. Here, you can identify charts for complex, fuzzy-logic based multi-factored chart patterns such as ascending triangles, double tops, double bottoms, and more, fully automatically. Not only that, but you can also scan for complex patterns and even utilize them in your Smart Checklists.

  • Triangles
  • Double Tops and Bottoms
  • Channels (Rising, Falling, Horizontal)
  • Head & Shoulders (and inverse) 
  • Wedges (Rising and Falling) 
  • Saucers (and inverse)
  • Cup & Handle (and inverse)

Önerilen ürünler
BinaryScalping
Andrey Spiridonov
BinaryScalping is a professional indicator for trading binary options and scalping. The algorithm of the indicator is based on the calculation of pivot points for each time period separately, the location of the price of the trading instrument relative to the pivot points is analyzed and the probability of a trading operation is calculated. The indicator has a built-in filter of trading signals based on the global trend. The indicator is installed in the usual way and works with any trading inst
Limitless MT4
Dmitriy Kashevich
Limitless MT4 is a universal indicator suitable for every beginner and experienced trader. works on all currency pairs, cryptocurrencies, raw stocks Limitless MT4 - already configured and does not require additional configuration And now the main thing Why Limitless MT4? 1 complete lack of redrawing 2 two years of testing by the best specialists in trading 3 the accuracy of correct signals exceeds 80% 4 performed well in trading during news releases Trading rules 1 buy signal - the ap
BinaryUniversal is a signal indicator for binary options and Forex. In its work, the indicator uses a complex algorithm for generating signals. Before forming a signal, the indicator analyzes volatility, candlestick patterns, important support and resistance levels. The indicator has the ability to adjust the accuracy of the signals, which makes it possible to apply this indicator for both aggressive and conservative trading. The indicator is set in the usual way, it works on any time period and
NostradamusMT4
Andrey Spiridonov
1 (1)
NostradamusMT4 is a powerful indicator from the set of professional trader. The indicator is based on Andrei Spiridonov's original price calculation method (ESTIMATED PRICE) for the current candle price. Advantages The indicator does not redraw. It works on any timeframes. Works with any trading instruments. Perfectly suitable for scalping and trading binary options. Parameters Color - color of the ESTIMATED PRICE FUTURE line. How to work with the indicator The indicator forms the ESTIMATED P
Smart Reversal Signal  is a professional indicator for the MetaTrader 4 platform; it has been developed by a group of professional traders. This indicator is designed for Forex and binary options trading. By purchasing this indicator, you will receive: Excellent indicator signals. Free product support. Regular updates. Various notification options: alert, push, emails. You can use it on any financial instrument (Forex, CFD, options) and timeframe. Indicator Parameters Perod - indicator calculat
Fxland Price Reversal Zones (MT4) FXLAND Smart Reversal Indicator is a professional technical analysis tool designed to help traders identify potential price reversal zones and key market turning points with clarity and precision. The best reversal indicator and price return by choosing only one ceiling or floor in each time frame A masterpiece of combining mathematics and Gann, fractal matrix, Fibonacci, movement angle and time. Completely intelligent Key Features Detects potential pr
This indicator is designed for scalping on low timeframes (M1-M15) in volatile markets like major forex pairs (e.g., EURUSD, GBPUSD). It generates non-repainting buy (green up arrow) and sell (red down arrow) signals based on EMA crossover confirmed by RSI momentum and MACD crossovers, minimizing false signals in ranging markets. How to Use: Attach the indicator to your MT4 chart. Look for arrows on the chart: Buy on green up arrow, Sell on red down arrow. Signals appear at the open of the new
Towers
Yvan Musatov
Towers - Trend indicator, shows signals, can be used with optimal risk ratio. It uses reliable algorithms in its calculations. Shows favorable moments for entering the market with arrows, that is, using the indicator is quite simple. It combines several filters to display market entry arrows on the chart. Given this circumstance, a speculator can study the history of the instrument's signals and evaluate its effectiveness. As you can see, trading with such an indicator is easy. I waited for an a
WanaScalper MT4
Isaac Wanasolo
1 (1)
A scalping indicator based on mathematical patterns, which on average gives signals with relatively small SL, and also occasionally helps to catch big moves in the markets (more information in the video) This indicator has three main types of notifications: The first type warns of a possible/upcoming signal on the next bar The second type indicates the presence of a ready signal to enter the market/open a position The third type is for SL and TP levels - you will be notified every time price re
Powerful Binary Options
Ellan Dirgantara Tholkhah
This is the binary options signal you all have been looking for. This in a modified version of the Garuda Scalper, that has been modified for Binary Options traders. Signals are very unique! Why this is so effective for binary options is because  it is a trend following system, it understands that the trend is your friend. It takes advantage of the buying/selling after the pullback in continuation of the current trend wave.  Because  signals are generated after the pullback,   you can place shor
Scalping Entry Points - fiyat hareketlerine uyum sağlayabilen ve yeniden çizmeden alım satımları açmak için sinyaller verebilen manuel bir alım satım sistemidir. Gösterge, merkezi destek ve direnç seviyesine göre trendin yönünü belirler. Nokta göstergesi, girişler ve çıkışlar için sinyaller sağlar. Manuel gün içi ticaret, ölçeklendirme ve ikili opsiyonlar için uygundur. Tüm zaman dilimlerinde ve ticaret enstrümanlarında çalışır. Gösterge birkaç türde uyarı verir. ürün nasıl kullanılır Mavi çiz
It will be the best tool for you to make a profit! Through unique algorithms You're going to see an amazing amount of right trading signals Make huge profits every day and realize more possibilities!   Like the car no money to buy it, the love of the girls dare not to pursue?Or the credit card bill is not paid, the rent does not have the extra money to settle?Or are you fed up with being bossed around by your boss and Hope to get more people's respect?Can't afford to buy the things you want ? wa
BB Reversal Arrows Teknik Ticaret Sistemi, perakende kararları almak için ters noktaları tahmin etmek için geliştirilmiştir. Mevcut pazar durumu gösterge ile analiz edilir ve çeşitli kriterler için yapılandırılır: ters anlar beklentisi, potansiyel dönüm noktaları, satın alma ve satış sinyalleri. Gösterge fazla bilgi içermez, tüccarların makul kararlar vermesine izin veren görsel anlaşılabilir bir arayüze sahiptir. Tüm oklar mumu kapatıyor gibi görünüyor, yeniden çizim yapmadan, birkaç uyarı tür
Price Grid Navigator Göstergesi Price Grid Navigator, yatırımcıların temel destek ve direnç seviyelerini dinamik olarak belirlemelerine yardımcı olmak için tasarlanmış güçlü ve sezgisel bir işlem aracıdır. Potansiyel giriş noktaları, çıkış noktaları ve geri dönüş bölgeleri için net görsel ipuçları sağlayarak, her seviyeden yatırımcı için vazgeçilmez bir araçtır. Bu seviyeleri dinamik olarak hesaplayıp çizerek, gösterge yatırımcılara potansiyel giriş noktaları, çıkış noktaları ve geri dönüş bölg
FREE
Alpha Trend sign has been a very popular trading tool in our company for a long time. It can verify our trading system and clearly indicate trading signals, and the signals will not drift. Main functions: Based on the market display of active areas, indicators can be used to intuitively determine whether the current market trend belongs to a trend market or a volatile market. And enter the market according to the indicator arrows, with green arrows indicating buy and red arrows indicating se
Nostradamix
Andrey Kozak
5 (1)
The "Nostradamix" indicator is designed to analyze short-term market movements on lower timeframes (e.g., M1), while simultaneously considering trend direction on higher timeframes (e.g., M30). This tool identifies key trend reversal points, displays volatility levels, and generates buy/sell signals based on market dynamics. The indicator automatically plots: Current trend lines. Volatility bands to assess movement strength. Visual markers (arrows) for entry signals. Forecast Accuracy and Mathem
Güvenilmez ikili opsiyon göstergelerinden sıkıldınız mı? Yalan sinyaller vererek kayıplara ve hayal kırıklığına neden olan? O zaman aradığınız şey, MT4 işlem platformu için mevcut olan en iyi ikili opsiyon göstergesi olan CLOCK GÖSTERGESİ'nden başka bir şey değil! Gelişmiş algoritması ve güçlü teknik analiz araçlarıyla CLOCK GÖSTERGESİ, hem yeni başlayanlar hem de deneyimli işlemciler için en üst düzey ticaret aracıdır. Piyasa trendlerini doğru bir şekilde tahmin eder ve karlı işlem fırsatları
Breakout Pro Scalper Çözümü Bu gösterge, RPTrade Pro Solutions sistemlerinin bir parçasıdır. Breakout Pro Scalper Solution, Fiyat Hareketi, Dinamik Destek ve Dirençleri kullanan günlük bir trend göstergesidir. Herkes tarafından kullanılmak üzere tasarlanmıştır, ticarete yeni başlayanlar bile kullanabilir. ASLA yeniden boyamaz. Endikasyonlar yakından kapana doğru verilmiştir. Tek başına kullanılmak üzere tasarlanmıştır, başka bir göstergeye gerek yoktur. Günün başında size trend ve potansiyel T
This advisor enters the market at the opening of   London Market . It has a automatic function that give buy (arrow up green) and sell (arrow down red) signal when the indicator met high probabilities requirements.Once the signal is generated it is the trader discretions to start the order button and do trade manually. Stop loss are base on ATR. Recommended Take profit is 20pips.  The trading system is suitable for both experienced traders and beginners.  Timeframe is  M5 . Minimum account bal
Gösterge, tarihsel olanlarla karşılaştırılabilecek güncel teklifler oluşturur ve bu temelde bir fiyat hareketi tahmini yapar. Gösterge, istenen tarihe hızlı navigasyon için bir metin alanına sahiptir. Seçenekler: Sembol - göstergenin göstereceği sembolün seçimi; SymbolPeriod - göstergenin veri alacağı dönemin seçimi; GöstergeRenk - gösterge rengi; Ters - doğru tırnakları tersine çevirir, yanlış - orijinal görünüm; Sonraki, tarihi girebileceğiniz ve 'enter' tuşuna basarak hemen atlayab
MT4 için Crypto_Forex Göstergesi "Scalping_Channel". - Scalping Kanalı, ATR tabanlı oynaklık sınırlarına sahiptir. - Scalping ticareti için kullanmak harikadır: - Orta çizgide düzenleme bekleyen limit emri yoluyla işlemlere girin. - Yeşil sabit yukarı kanal gerçekleştiğinde ve en az 1 mum üst sınırın üzerinde kapandığında Boğa girişlerini düşünün (resimlere bakın). - Kırmızı sabit aşağı kanal gerçekleştiğinde ve en az 1 mum alt sınırın altında kapandığında Ayı girişlerini düşünün (resimlere ba
User Manual Download link: https://ontrd.com/our-books/ For all who are asking about indicator  ON Trade Numerology Station It obtain about 16 numerology strategies it make together completed unit control your trading . Basic strategies to work with it are 3 strategies statistics about them are the following : 1. RBA levels success rate more then 95%. 2. FF more then 96%  3.RBA SUN 98% We will not say 100 % as they are .. Ratio rates as following :  1.Rba levels more then 1/3 to 1/6 . 2.FF MORE
Trend PA
Mikhail Nazarenko
5 (3)
The Trend PA indicator uses   Price Action   and its own filtering algorithm to determine the trend. This approach helps to accurately determine entry points and the current trend on any timeframe. The indicator uses its own algorithm for analyzing price changes and Price Action. Which gives you the advantage of recognizing, without delay, a new nascent trend with fewer false positives. Trend filtering conditions can be selected in the settings individually for your trading style. The indicator
Market Maestro: Your Ideal Partner for Automated Forex Trading If you're looking for a reliable assistant for trading in the currency market, Market Maestro is exactly what you need. This modern Forex bot is built using the latest technologies and algorithms, allowing it to effectively analyze market data and make informed trading decisions in real-time. Key Features of Market Maestro 1. Multicurrency Capability for Broad Opportunities Market Maestro can work with a wide range of currency pairs,
Mast
Sergei Zakhariia
The MT4 trend arrow indicator is a powerful tool for technical analysis that will help traders determine the direction of the trend in financial markets. This indicator is based on the use of several mathematical algorithms and methods of price analysis, which allows you to give accurate and transparent signals to enter the market. The working timeframe is H1.  The description of the indicator includes up and down arrows that indicate the future direction of price movement. In addition, the i
BinaryIndicator is a highly accurate indicator for trading binary options. It shows excellent results in scalping. This indicator is based in multifactor analysis of trend indicators, as well as confirmation oscillators, which in the end gives an increased accuracy of signals. Advantages of the indicator Increased accuracy of signals. Excellent results when trading binary options with a short expiration time from M30 to M1 . It works on any timeframes. Works with any trade symbols. Parameters
The Hurricane Cave Indicator shows different trade areas based on price action. It looks in the past and works out patterns that can enforce support and resistance as targets. When price breaks out of a trade area you can target just inside the next trade area. If you can't see the target just go to a slower time frame, it means the price hasn't been there for a long time. The Hurricane Cave Indicator is designed to be an add on to The Hurricane Forex Indicator also available in the Meta Trader
FREE
Septermber OFFER 85% OFF next price for unlimited version will be 2500$. This is the only time you can get this institutional and professional indicator at this price for unlimited version. Don't dare to miss this. The tool I am about to introduce to you you can't compare it with other tools due to its strategy and accuracy level in predicting the next price directional movement. This tool is designed for serious traders who have decided to make a difference through trading. Be the next person t
Dear Traders this is my another tool called " Swing Master Indicator ". As the name above the indicator is designed to help you in swing trading by capturing the low and highs of the price. You may us this tool with any trading strategy and style from scalping to position trading. It is made for level of traders including newbies and advanced traders even prop-firms, hedge funds and banks to help them make sold market analysis. I create tools for serious traders who want to make a difference in
PZ Swing Trading
PZ TRADING SLU
5 (3)
Protect against whipsaws: revolutionize your swing trading approach Swing Trading is the first indicator designed to detect swings in the direction of the trend and possible reversal swings. It uses the baseline swing trading approach, widely described in trading literature. The indicator studies several price and time vectors to track the aggregate trend direction and detects situations in which the market is oversold or overbought and ready to correct. [ Installation Guide | Update Guide | Tro
Bu ürünün alıcıları ayrıca şunları da satın alıyor
Pulse Scalping Line - an indicator for identifying potential pivot points. Based on this indicator, you can build an effective Martingale system. According to our statistics, the indicator gives a maximum of 4 erroneous pivot points in a series. On average, these are 2 pivot points. That is, the indicator shows a reversal, it is erroneous. This means that the second signal of the indicator will be highly accurate. Based on this information, you can build a trading system based on the Martingale
Miraculous Göstergesi – Gann Dokuz Kareye Dayalı %100 Tekrarlamayan Forex ve İkili Araç Bu video, Forex ve İkili Opsiyon traderları için özel olarak geliştirilmiş son derece doğru ve güçlü bir ticaret aracı olan Miraculous Göstergesi 'ni tanıtıyor. Bu göstergeyi benzersiz kılan, efsanevi Gann Dokuz Karesi ve Gann Titreşim Yasası 'na dayanmasıdır; bu da onu modern ticarette mevcut en hassas tahmin araçlarından biri yapmaktadır. Miraculous Göstergesi tamamen tekrarlamaz ; yani mum kapandıktan son
Rtc ML Ai | Predictor CORE MACHINE LEARNING ENGINE Adaptive ML Market Predictor – Multi-Bar Trend & Candle Forecast What This Indicator Does This indicator is a  real-time market prediction engine  designed to analyze price behavior and estimate  future market tendencies . Unlike conventional indicators, this system  does not rely on static parameters or historical curve-fitting , but adapts its internal state dynamically during live market operation. Instead of using static rules, the indic
FFx Engulfing Setup Alerter gives trade suggestions with Entry, Target 1, Target 2 and StopLoss. Below are the different options available: Entry suggestion - pips to be added over the break for the entry 3 different options to calculate the SL - by pips, by ATR multiplier or at the pattern High/Low 3 different options to calculate the 2 TPs - by pips, by ATR multiplier or at Risk/Reward Offset the dashboard - any place on the chart Remove the suggestion once the price reached the SL line Lines
FFx InsideBar Setup Alerter gives trade suggestions with Entry, Target 1, Target 2 and StopLoss. Below are the different options available: Entry suggestion - pips to be added over the break for the entry Minimum candle size - to avoid too close buy/sell entry suggestions 3 different options to calculate the SL - by pips, by ATR multiplier or at the pattern High/Low 3 different options to calculate the 2 TPs - by pips, by ATR multiplier or at Risk/Reward Offset the dashboard - any place on the c
FFx OutsideBar Setup Alerter gives trade suggestions with Entry, Target 1, Target 2 and StopLoss. Below are the different options available: Entry suggestion - pips to be added over the break for the entry. 3 different options to calculate the SL - by pips, by ATR multiplier or at the pattern High/Low. 3 different options to calculate the 2 TPs - by pips, by ATR multiplier or at Risk/Reward. Offset the dashboard - any place on the chart. Remove the suggestion once the price reached the SL line.
FFx PinBar Setup Alerter gives trade suggestions with Entry, Target 1, Target 2 and StopLoss. Below are the different options available: Entry suggestion - pips to be added over the break for the entry Minimum candle size - to avoid too small candles 3 different options to calculate the SL - by pips, by ATR multiplier or at the pattern High/Low 3 different options to calculate the 2 TPs - by pips, by ATR multiplier or at Risk/Reward Offset the dashboard - any place on the chart Remove the sugges
The purpose of this new version of the MT4 standard indicator provided in your platform is to display in a sub-window multiple timeframes of the same indicator with its divergences. See the example shown in the picture below. But the display isn't like a simple MTF indicator. This is the real display of the indicator on its timeframe. Here's the options available in the FFx divergences indicator: Select the timeframes to be displayed (M1 to Monthly) Define the width (number of bars) for each tim
The purpose of this new version of the MT4 standard indicator provided in your platform is to display in a sub-window multiple timeframes of the same indicator with its divergences. See the example shown in the picture below. But the display isn't like a simple MTF indicator. This is the real display of the indicator on its timeframe. Here's the options available in the FFx divergences indicator: Select the timeframes to be displayed (M1 to Monthly). Define the width (number of bars) for each ti
The FFx Dashboard MTF alerter will show you on a single chart all the timeframes (M1 to Monthly) with their own status for the indicator. 2 Alert Options: Single timeframe: each selected timeframe alert separately when a signal occurs Multi timeframes: all selected timeframes must agree for an alert to be triggered Both options have an input to select the timeframes to be used for the alert(s). How to Understand the Status: Green/Red square: histogram above/below 0 line Green square + Red bord
The FFx Dashboard MTF alerter will show you on a single chart all the timeframes (M1 to Monthly) with their own status for the indicator. 2 Alert Options: Single timeframe: each selected timeframe alert separately when a signal occurs Multi timeframes: all selected timeframes must agree for an alert to be triggered Both options have an input to select the timeframes to be used for the alert(s). How to understand the status: Green/Red square: RSI above/below 50 line Green square + Red border: R
The FFx Dashboard MTF alerter will show you on a single chart all the timeframes (M1 to Monthly) with their own status for the indicator. 2 Alert Options: Single timeframe: each selected timeframe alert separately when a signal occurs Multi timeframes: all selected timeframes must agree for an alert to be triggered Both options have an input to select the timeframes to be used for the alert(s). How to understand the status: Green/Red square: Stoch above/below 50 line Green square + Red border:
The FFx Dashboard MTF alerter will show you on a single chart all the timeframes (M1 to Monthly) with their own status for the indicator. 2 Alert Options: Single timeframe: each selected timeframe alert separately when a signal occurs Multi timeframes: all selected timeframes must agree for an alert to be triggered Both options have an input to select the timeframes to be used for the alert(s). How to understand the status: Green/Red square: Price above/below Cloud (Kumo) Green square + Red bo
The FFx Dashboard MTF alerter will show you on a single chart all the timeframes (M1 to Monthly) with their own status for the indicator. 2 Alert Options: Single timeframe: each selected timeframe alert separately when a signal occurs Multi timeframes: all selected timeframes must agree for an alert to be triggered Both options have an input to select the timeframes to be used for the alert(s). How to understand the status: Green/Red square: MA pointing Up/Down Green square + Red border: MA po
The FFx Dashboard MTF alerter will show you on a single chart all the timeframes (M1 to Monthly) with their own status for the indicator. 2 Alert Options: Single timeframe: each selected timeframe alert separately when a signal occurs. Multi timeframes: all selected timeframes must agree for an alert to be triggered. Both options have an input to select the timeframes to be used for the alert(s). How to understand the status: Green square: Price above PSAR Red square: Price below PSAR Options
The FFx Dashboard MTF alerter will show you on a single chart all the timeframes (M1 to Monthly) with their own status for the indicator. 2 Alert Options: Single timeframe: each selected timeframe alert separately when a signal occurs Multi timeframes: all selected timeframes must agree for an alert to be triggered Both options have an input to select the timeframes to be used for the alert(s). How to understand the status: Green/Red square: CCI above/below levels (ie. 100/-100) Grey square: C
The FFx Dashboard MTF alerter will show you on a single chart all the timeframes (M1 to Monthly) with their own status for the indicator. 2 Alert Options: Single timeframe: each selected timeframe alert separately when a signal occurs Multi timeframes: all selected timeframes must agree for an alert to be triggered Both options have an input to select the timeframes to be used for the alert(s). How to understand the status: Green/Red square: ADX above level Grey square: ADX below level Red bor
The FFx Dashboard MTF alerter will show you on a single chart all the timeframes (M1 to Monthly) with their own status. 2 Alert Options: Single timeframe: each selected timeframe alert separately when a signal occurs Multi timeframes: all selected timeframes must agree for an alert to be triggered Both options have an input to select the timeframes to be used for the alert(s). How to understand the status: Green/Red square: bullish/bearish candle Options available in the FFx Dashboard Alerter
The [GRAFF] III manual trading system is based on multiple MetaTrader (MT4) indicators. Together, the entire PACK of GRAFF III indicators makes an advanced trading tool. The system consists of over 20 different custom-built indicators which have been carefully selected and tested in the long term to produce strong and efficient trading signals. The particular indicators are based on different mathematical formulas, so the entire system is calibrated to remove false signals from its own indicator
FFx Universal Strength Meter PRO is more than a basic strength meter. Instead of limiting the calculation to price, it can be based on any of the 19 integrated strength modes + 9 timeframes. With the FFx USM, you are able to define any period for any combination of timeframes. For example, you can set the dashboard for the last 10 candles for M15-H1-H4… Full flexibility! Very easy to interpret... It gives a great idea about which currency is weak and which is strong, so you can find the best pai
Pan PrizMA CD Phase is an analogue of the МetaТrader 5 indicator , and is an option based on the Pan PrizMA indicator. Details . Averaging by a quadric-quartic polynomial increases the smoothness of lines, adds momentum and rhythm. Extrapolation by the sinusoid function near a constant allows adjusting the delay or lead of signals. The value of the phase - wave status parameter (which is close in meaning to the trigonometric phase or the angle of the radius-vector rotation in the trigonometric p
Green Wall Arrows
Daniel Luchinger
1 (1)
The Name Green Wall : Arrows hits a lot of TP, by changing the idea of non using SL as something bad, but instead use Small TP and a lot of free Margin and Patience. Use micro TP and a lot of Free Margin with this indicator on Forex. It also can be used with Binary Options. This strategy is intended to be traded Manually. This Indicator runs on Open Bar, arrows will delete when price are against it. The only Indicator Parameter is Alerts true/false, all the rest is included inside the code. Arro
Golden Monowave is monowave indicator, the monowave theory is one of Elliott wave approach and one of most complicate and accurate method. Golden Monowave can shortcut many major steps to identify and describe the monowave. It works on any timeframe and with any trading instrument, including currencies, indices, futures, etc. Input Parameters initial_Bars - set the initial number of bars to calculate. wave_color - select the color of the wave. label_color - select the color of labels. temp_labe
Ticks Size
Viktor Kolmakov
This indicator displays in a separate window the difference between the number of points which increased the price, and the number of points that decreased the price during the time interval specified in the settings. The time interval for calculation is expressed as the number of bars of the chart the indicator is attached to. This approach allows you to evaluate the movement direction (growth or fall) of the instrument's price, the strength of the movement and the size of the movement in point
MetaTrader 5 version available here : https://www.mql5.com/en/market/product/24882 FFx Basket Scanner is a global tool scanning all pairs and all timeframes over up to five indicators among the 16 available. You will clearly see which currencies to avoid trading and which ones to focus on. Once a currency goes into an extreme zone (e.g. 20/80%), you can trade the whole basket with great confidence. Another way to use it is to look at two currencies (weak vs strong) to find the best single pairs
MetaTrader 5 version available here: https://www.mql5.com/en/market/product/25794 FFx Pivot SR Suite PRO is a complete suite for support and resistance levels. Support and Resistance are the most used levels in all kinds of trading. Can be used to find reversal trend, to set targets and stop, etc. The indicator is fully flexible directly from the chart 4 periods to choose for the calculation: 4Hours, Daily, Weekly and Monthly 4 formulas to choose for the calculation: Classic, Camarilla, Fibonac
This is the FXTraderariel PowerTrend . It compute a trendfollowing system based on it own algorithm. It gives you a buy or sell signal based on the trend. It based on the Supertrend, but our Version is not repainting. Furthermoore we added some Improvements and you can get an Arrow, Push or Alert when the trend changes. Depending on the settings it and trading style, it can be used for scalping or long-term trading . The indicator can be used on every time frame , but we advise to use it on H1
Yazarın diğer ürünleri
MSHT Head&Shoulders indicator for MT4 automatically scans the chart for head and shoulders candlestick patterns. Obviously, the scanner shows the Symbol, Timeframe, Direction, Pattern Name, Age, and Chart time frame in which the head and shoulders pattern is identified. Furthermore, the scanner displays the inverted head and shoulders pattern also. So, forex traders can BUY or SELL based on the head and shoulders candlestick pattern. Additionally, the indicator also scans and plots emerging head
Filtrele:
İnceleme yok
İncelemeye yanıt