Versus USD MT5
- Göstergeler
- Vonjinirina Alfred Randrianiaina
- Sürüm: 1.10
- Güncellendi: 5 Mayıs 2023
- Etkinleştirmeler: 10
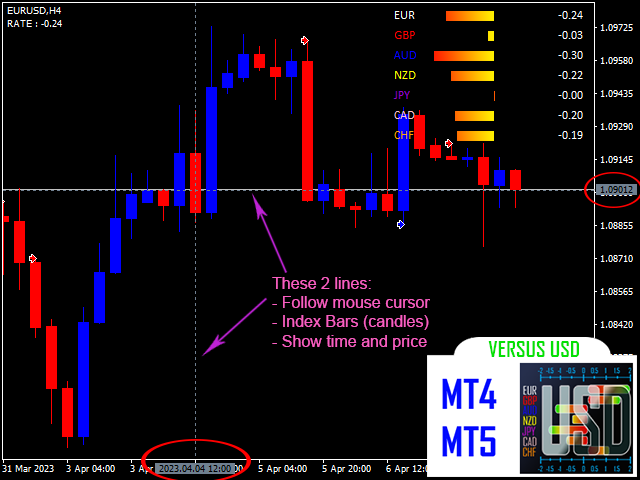
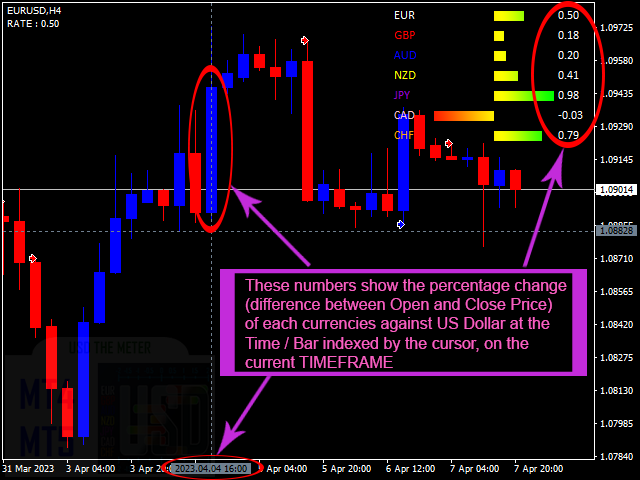
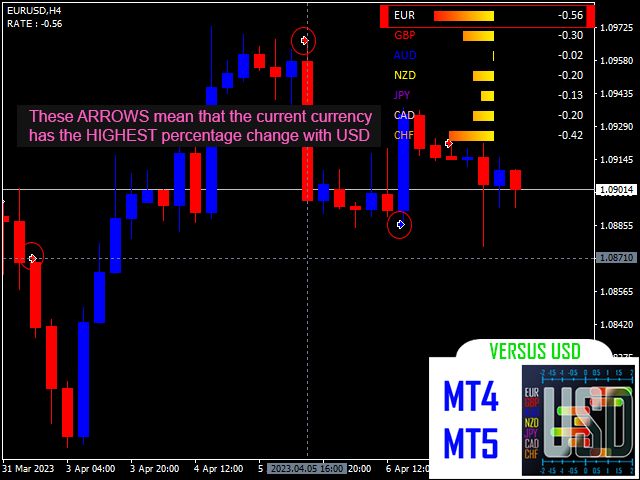
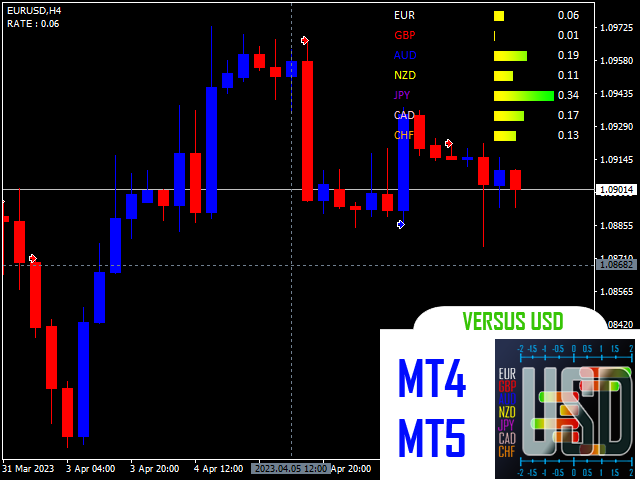
Versus USD, her bir ana para biriminin USD karşısındaki fiyat değişimini hesaplar ve grafikteki her çubuk ya da periyot, imleç tarafından belirlenen mevcut zaman diliminde performanslarının net ve karşılaştırmalı bir görünümünü, ilerleme çubukları ile gösterir. Ek olarak, diğer para birimlerine karşı USD'ye karşı en yüksek veya en düşük fiyat değişimini yaşadığı çubuk/dönemde, söz konusu para biriminin performansının daha hassas bir ölçüsünü sağlamak için bir ok işareti ile işaretler.
Amerikan Doları, döviz piyasasındaki her bir ana para biriminin performansını ölçmek için kullanılan temel para birimidir çünkü uluslararası işlemlerde en likit ve en yaygın kullanılan para birimidir. Ayrıca, çoğu forex işlemi temel olarak Amerikan Doları ya da alıntı para birimi olarak Amerikan Doları içerdiğinden, diğer para birimlerinin performansını karşılaştırmak ve değerlendirmek daha kolay hale gelir.
Forex ticaretindeki deneyim seviyeniz ve ticaret tarzınız ne olursa olsun, zaten kârlı bir stratejiniz olsun ya da olmasın, bu gösterge becerilerinizi hızla artırabilir. Ek olarak, aşağıdaki özelliklere sahip olduğundan kullanımı kolaydır:
- Tüm 28 ana para çiftiyle uyumlu
- Tüm zaman dilimleriyle (M1 - MN) çalışır
- Yapılandırmaya ihtiyaç yok, her şey otomatiktir
- MT4 ve MT5'te mevcuttur
GEREKSINIMLER:
1. Göstergeyi doğru şekilde kullanmak için, yedi ana çiftin tarihsel verileri senkronize edilmeli ve güncellenmeli ve bu çiftlerden biriyle göstergeyi kullanmasanız bile bu çiftlerin grafiklerini açmanız önerilir.
Bu 7 ana çift şunlardır:
- EURUSD
- GBPUSD
- AUDUSD
- NZDUSD
- USDJPY
- USDCAD
- USDCHF
2. Gösterge ile kullanılan diğer sembollerin tarihsel verilerinin de yedi ana çiftin verileriyle güncel ve senkronize olması son derece önemlidir.
ÖNERILER:
- Kullanıcıların JPY içeren para çiftleriyle göstergenin kullanılmasını kesinlikle öneriyorum, çünkü bu çiftlerle çok daha güvenilir ve doğru.
- Potansiyel hatalardan kaçınmak için, Versus USD'yi grafiklerinize eklemeye önce 7 ana para çiftinin (USD içeren) tarihsel verilerinin ve göstergeyi kullanacağınız çiftin tarihsel verilerinin güncel ve senkronize olduğundan emin olun.
- Gösterge hata ile karşılaşırsa, başka bir zaman dilimine geçmenizi, sonra istenen zaman dilimine geri dönmenizi öneririm.
Join the Versus USD chat if you have questions or reports or something else about the indicator.
Versus USD MT4 : https://www.mql5.com/fr/market/product/97127