• Genel bakış
  • İncelemeler
  • Yorumlar
  • Yenilikler

Supertrend MetaTrader 5

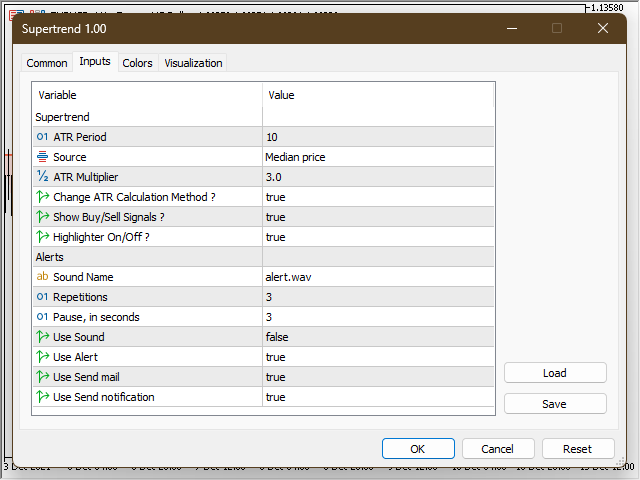
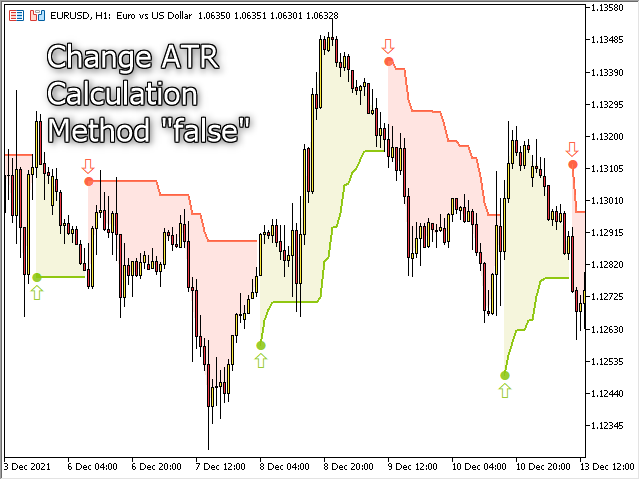
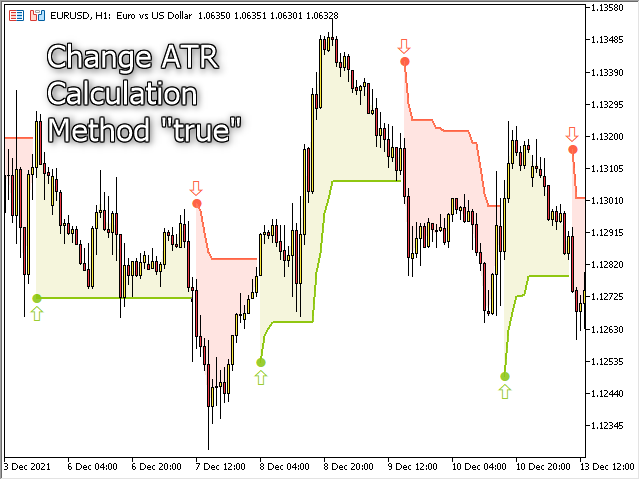
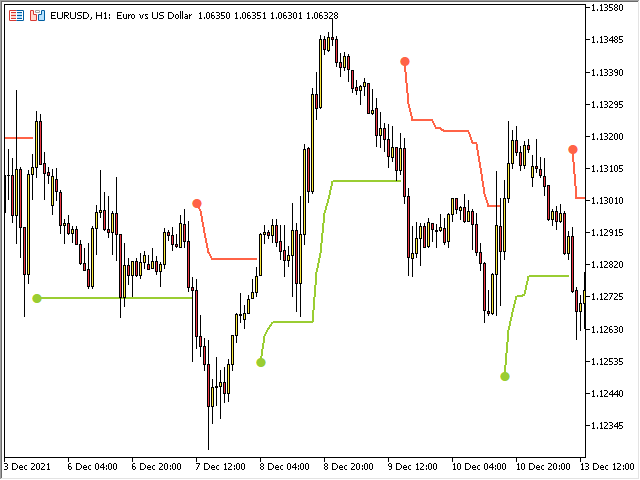
'Supertrend MetaTrader 5' göstergesi, en basit trend ticaret sisteminin temelidir. Ve yine de çok etkili olmaya devam ediyor. Gösterge herhangi bir zaman diliminde çalışır (mevcut grafiğin zaman diliminde). Adından, bu göstergenin trendi takip ettiğini ve trend değiştiğinde göstergenin trendin değişme noktasını doğru bir şekilde gösterdiğini görebilirsiniz. 'Supertrend MetaTrader 5'in temeli, fiyat ve 'Average True Range göstergesi' değerlerinin bir çarpanla çarpılmasıdır (ayrıca 'ATR' yerine 'True Range'e göre hesaplanan 'Hareketli Ortalama'yı kullanma seçeneği de vardır) .

Gösterge, trend olan pazar alanlarında ve 10 ve 3 parametreleriyle ('ATR Dönemi' 10'a eşittir ve 'ATR Çarpanı' 3'e eşittir) en iyi sonuçları gösterir. D1 zaman diliminde, onaylayıcı göstergelerin kullanılması tavsiye edilir.

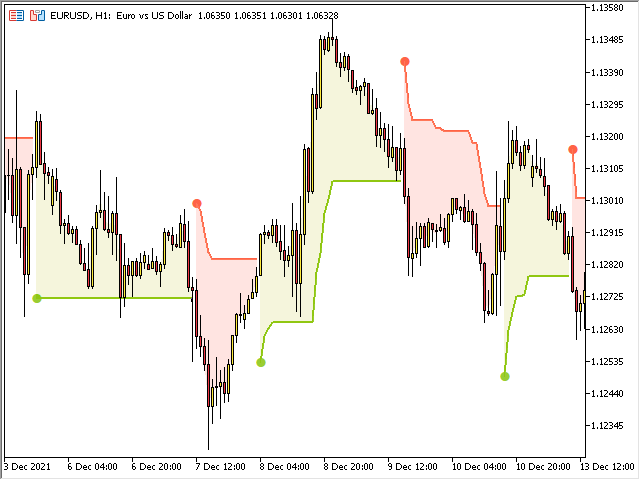
Parametrelerde gösterge tipini 'ATR' veya 'Hareketli Ortalama' olarak ayarlayabilirsiniz (bundan 'ATR Hesaplama Yöntemini Değiştir ?' parametresi sorumludur), 'Al' ve 'Sat' sinyal oklarını etkinleştirebilir/devre dışı bırakabilirsiniz. ('Alış/Satış Sinyallerini Göster ?') ve trend dolgusunu etkinleştirebilir/devre dışı bırakabilirsiniz ('Vurgulayıcı Açık/Kapalı ?' parametresi).

Ayrıca, "Uyarılar" bloğunda, sinyallerin görünümü hakkında uyarılar ayarlayabilirsiniz (DİKKAT! gösterge mevcut çubukta aktif olarak çalışmaktadır ve bu nedenle mevcut çubuktaki sinyal görünebilir veya kaybolabilir).


Önerilen ürünler
Follow The Line MT5
Oliver Gideon Amofa Appiah
4.4 (30)
This indicator obeys the popular maxim that: "THE TREND IS YOUR FRIEND" It paints a GREEN line for BUY and also paints a RED line for SELL. (you can change the colors). It gives alarms and alerts of all kinds. IT DOES NOT REPAINT and can be used for all currency pairs and timeframes. Yes, as easy and simple as that. Even a newbie can use it to make great and reliable trades. NB: For best results, get my other premium indicators for more powerful and reliable signals. Get them here: https://www.m
FREE
Important Lines
Terence Gronowski
4.88 (26)
This indicator displays Pivot-Lines, preday high and low, preday close and the minimum and maximum of the previous hour. You just have to put this single indicator to the chart to have all these important lines, no need to setup many single indicators. Why certain lines are important Preday high and low : These are watched by traders who trade in a daily chart. Very often, if price climbs over or falls under a preday low/high there is an acceleration in buying/selling. It is a breakout out of
FREE
What is this indicator? This indicator is the MACD (Moving Average Convergence/Divergence) supporting Virtual Trading mode of  Knots Compositor . When the mode is turned on, the indicator will be recalculated based on the displayed candlesticks. When the mode is turned off, the indicator will be recalculated based on the original chart candlesticks. Types of the applied price - Close - Open - High - Low - Median Price (HL/2) - Typical Price (HLC/3) - Weighted Price (HLCC/4) KC-Indicators
FREE
Are you tired of drawing trendlines every time you're analyzing charts? Or perhaps you would like more consistency in your technical analysis. Then this is for you. This indicator will draw trend lines automatically when dropped on a chart. How it works Works similar to standard deviation channel found on mt4 and mt5. It has 2 parameters: 1. Starting Bar 2. Number of bars for calculation The   starting bar   is the bar which drawing of the trend lines will begin, while the   number of bars for c
FREE
Rainbow MT5
Jamal El Alama
4.33 (3)
Description : Rainbow MT5 is a technical indicator based on Moving Average with period 34 and very easy to use. When price crosses above MA and MA changes color to green, then this is a signal to buy. When price crosses below MA and MA changes color to red, then this is a signal to sell. The Expert advisor ( Rainbow EA MT5 ) based on Rainbow MT5 indicator is now available here . MT4 version is available here .
FREE
LT Donchian Channel
Thiago Duarte
4.75 (4)
Donchian Channel is an indicator created by Richard Donchian. It is formed by taking the highest high and the lowest low of the last specified period in candles. The area between high and low is the channel for the chosen period. Its configuration is simple. It is possible to have the average between the upper and lower lines, plus you have alerts when price hits one side. If you have any questions or find any bugs, please contact me. Enjoy!
FREE
The indicator identifies when a divergence occurs between price and an indicator or oscillator. It identifies both regular and hidden divergences. Combined with your own rules and techniques, this indicator will allow you to create (or enhance) your own powerful system. Features Can detect divergences for the following oscillators/indicators:   MACD, OsMA, Stochastics, RSI, CCI, RVI, Awesome, ADX, ATR, OBV, Composite index, MFI and Momentum. Only one oscillator/indicator can be selected. Draws
FREE
This indicator is especially for the binary trading. Time frame is 1 minutes and exp time 5 or 3 minutes only. You must be use martingale 3 step. So you must put lots size is 10 % at most. You should use Mt2 trading platform to connect with my indicator to get more signal without human working. This indicator wining rate is over 80% but you may get 100% of profit by using martingale 3 step. You should use MT2 Trading Platform to connect meta trader platform and binary platform . You can get mt2
FREE
What is this indicator? This indicator is the RSI (Relative Strength Index) supporting Virtual Trading mode of  Knots Compositor . When the mode is turned on, the indicator will be recalculated based on the displayed candlesticks. When the mode is turned off, the indicator will be recalculated based on the original chart candlesticks. Types of the applied price - Close - Open - High - Low - Median Price (HL/2) - Typical Price (HLC/3) - Weighted Price (HLCC/4) KC-Indicators -   KC-MA   (M
FREE
HMA Color with Alerts MT5
Pavel Zamoshnikov
4.73 (51)
Hull Moving Average (HMA) is well-deservedly popular among traders because of the effective averaging of market noise and a relatively small delay. The current MetaTrader 5 version changes its color when the movement direction changes. Sound and text signals are available. It also supports sending email and push messages. It is possible to trigger a signal on the current incomplete bar, although such a signal may be canceled before completion if conditions are no longer appropriate. One of the p
FREE
Mitimom
Danil Poletavkin
The indicator is based on Robert Miner's methodology described in his book "High probability trading strategies" and displays signals along with momentum of 2 timeframes. A Stochastic oscillator is used as a momentum indicator. The settings speak for themselves period_1 is the current timeframe, 'current' period_2 is indicated - the senior timeframe is 4 or 5 times larger than the current one. For example, if the current one is 5 minutes, then the older one will be 20 minutes The rest of the
FREE
Donchian Channel DC is the indicator of Donchian Channels, that plots maximum and minimum values of a specific period, besides mean value line. It´s possible to configure simple period for analysis and the indicator will plot all three values. You can trade with this indicator as trend or reversal, according to each strategy. Do not let to test others indicators as soon as others expert advisors.
Free automatic Fibonacci is an indicator that automatically plots a Fibonacci retracement based on the number of bars you select on the BarsToScan setting in the indicator. The Fibonacci is automatically updated in real time as new highest and lowest values appears amongst the selected bars. You can select which level values to be displayed in the indicator settings. You can also select the color of the levels thus enabling the trader to be able to attach the indicator several times with differe
FREE
Trend Yakalayıcı: Alarm İndikatörü ile Trend Yakalayıcı Stratejisi, piyasa trendlerini ve potansiyel giriş ve çıkış noktalarını belirlemede yardımcı olan çok yönlü bir teknik analiz aracıdır. Piyasa koşullarına uyum sağlayarak trend yönünün net görsel temsili için dinamik bir Trend Yakalayıcı Stratejisi sunar. Tüccarlar tercihlerine ve risk toleranslarına göre parametreleri özelleştirebilirler. Gösterge, trendleri tanımlamaya yardımcı olur, potansiyel ters dönüşleri sinyaller, trailing stop m
FREE
Reversal Candles MT5
Nguyen Thanh Cong
5 (2)
Introduction Reversal Candles is a cutting-edge non-repainting   forex indicator designed to predict price reversals with remarkable accuracy through a sophisticated combination of signals. Signal Buy when the last closed candle has a darker color (customizable) and an up arrow is painted below it Sell when the last closed candle has a darker color (customizable) and a down arrow is painted above it
FREE
TradeQL
Abdiel Aviles Jimenez
The TradeQL Indicator is a customizable tool that highlights specific trading patterns on candlestick charts. Users can define patterns through TradeQL queries, which the indicator then applies to the chart, visually representing matches and captured groups. Ideal for identifying complex trade setups in real-time. TradeQL queries are specified using the TradeQL Language. See https://github.com/abdielou/tradeql for more details. This language is expressed as a regular expression. The language a
FREE
This indicator is a zero-lag indicator and displays  strength of trend change . True Trend  Oscillator Pro works best in combination with True Trend Moving Average Pro that displays exact trend as is. Oscillator value is exact price change in given direction of the trend. True Trend Moving Average Pro: https://www.mql5.com/en/market/product/103586 If you set PERIOD input parameter to 1 this indicator becomes a sharpshooter for binary options. Developers can use True Trend Oscillator in E
FREE
Multi-timeframe trend indicator based on the ADX / ADXWilder indicator with Fibonacci levels The indicator shows trend areas using ADX or ADXWilder indicator data from multiple timeframes. The impulse mode of the indicator allows you to catch the beginning of a trend, and several "Screens" with different timeframes allow you to filter out market noise. Fibonacci levels are added to the price chart, which have flexible settings. How the indicator works: if PDI is greater than NDI, then   it`
FREE
PZ Penta O MT5
PZ TRADING SLU
4 (6)
The Penta-O is a 6-point retracement harmonacci pattern which usually precedes big market movements. Penta-O patterns can expand and repaint quite a bit. To make things easier this indicator implements a twist: it waits for a donchian breakout in the right direction before signaling the trade. The end result is an otherwise repainting indicator with a very reliable trading signal. The donchian breakout period is entered as an input. [ Installation Guide | Update Guide | Troubleshooting | FAQ | A
FREE
Automatic Trendlines
Pasi Hakamaki
4.63 (49)
The indicator draws trendlines on chart. This indicator has six inputs. User can specify alternative labels for both lines. If multiple instances of the indicator are used, the labels must differ. User can set width and color of the lines and depth which specifies what significant peaks should be used. For example, Depth=10 sets trendlines using the current peaks and valleys that have at least 10 bars to the right and to the left and that have highs/lows less/greater than the peak's high/low. In
FREE
LT Rainbow Trend
Thiago Duarte
5 (1)
Do you, like me, like to trade with the trend? Then this indicator will help you! Rainbow Trend is a trend indicator, which uses several Moving Averages on the chart. It measures different trend strenght zones for different periods: very long term, long term, mid term, short term and very short term. Each zone has its color, and it is possible to have sound alert when the prices leaves a zone and enters another. Its configuration is very simple. If you find any bug or have any suggestions, co
Cumulative Delta MT5
Evgeny Shevtsov
4.47 (57)
The indicator analyzes the volume scale and splits it into two components - seller volumes and buyer volumes, and also calculates the delta and cumulative delta. The indicator does not flicker or redraw, its calculation and plotting are performed fairly quickly, while using the data from the smaller (relative to the current) periods. The indicator operation modes can be switched using the Mode input variable: Buy - display only the buyer volumes. Sell - display only the seller volumes. BuySell -
FREE
Show Pips for MT5
Roman Podpora
4.61 (18)
This information indicator will be useful for those who always want to be aware of the current situation on the account. - More useful indicators The indicator displays data such as profit in points, percentage and currency, as well as the spread for the current pair and the time until the bar closes on the current timeframe. There are several options for placing the information line on the chart: - To the right of the price (runs behind the price); - As a comment (in the upper left corner
FREE
This indicator is an automated version of the Fibonacci retracement (Fib) indicator. Deciding the best areas to use when drawing the fib can be tricky and this  indicator was made with that in mind. When you drop it on the chart it will automatically choose the best points to draw the fib with, but in case you aren't satisfied with those regions, you can adjust it as you wish.
FREE
Dual RSI
Paul Conrad Carlson
Indicator alerts for Dual Relative strength index rsi. Large rsi preset at 14 is below 30 small rsi preset at 4 is below 10 for buy bullish signals . Large rsi preset are 14 is above 70 small rsi preset at 4 is above 90 for sell bearish signals . Includes mobile and terminal alerts. draws lines when alerts. This indicator can help identify extremes and then the tops or bottoms of those extremes .
FREE
Indicator measures strength of each currency in your list. Main idea: It simply iterates through all combinations of pairs and adds difference between open and close in percent. Parameters: List of currencies - what currencies will be calculated (maximum is 8) Calculation type - from which data will be strength calculated Calculation data input - used as input related to calculation type Symbol suffix - used in case of suffix on symbols, e.g: when your symbols look like EURUSDm, EURUSDmicro et
FREE
Half ma
Artem Svistunov
The Half ma arrow indicator for the MetaTrader 5 trading terminal is a simple but effective tool that gives a signal about a change in the current trend. The Half ma indicator looks like a solid dynamic line that changes color at the points where the trend changes. At these points, the indicator draws arrows of the corresponding color and direction.The Half ma arrow indicator for the MT5 terminal is not an independent source of input signals. It will be most effective to use it as a trend filte
This is a free version of the indicator, the period between the vertical lines is always 30 bars. In the paid version the period can be set by user, so a configuration with many ThreePointsChannel indicators with different periods is possible. The principle of construction - on top of any number of bars set by the user, a channel is constructed with maximum and minimum lines so that the bars touch the maximum and minimum of the channel at exactly three points. The name of the indicator follows
FREE
RenkoExpert
Andrey Goida
3.67 (3)
Renko Expert Advisor based on Renko bar simulation.    The EA has two options for building Renko bars. Classic and ATR. In the classic version, renko bars are marked with areas on the main chart; in the ATR version, renko bars are modeled and drawn in the indicator window. Modeling renko bars inside the EA allows you to optimize the robot better than drawing renko bars offline.      Telegramm channel   Set file Our second robot RENKOTREND Does not use martingale!  Trades opened by the robot co
FREE
DALA Forecast
Grigorii Matsnev
About the indicator: DALA Forecast is a universal tool for predicting the dynamics of time series of any nature. For prediction, modified methods of nonlinear dynamics analysis are used, on the basis of which a predictive model is built using machine learning methods.  To get the trial version of the indicator, you can contact me in private messages. How to use the indicator: Apply the indicator to your chosen financial instrument or indicator with the settings you need. The prediction will b
FREE
Bu ürünün alıcıları ayrıca şunları da satın alıyor
Öncelikle, bu Ticaret Sistemi'nin Non-Repainting, Non-Redrawing ve Non-Lagging Göstergesi olduğunu vurgulamak önemlidir, bu da hem manuel hem de robot ticareti için ideal hale getirir. "Smart Trend Trading System MT5", yeni ve deneyimli tüccarlar için özelleştirilmiş kapsamlı bir ticaret çözümüdür. 10'dan fazla premium göstergeyi birleştiriyor ve 7'den fazla sağlam ticaret stratejisi sunuyor, bu da çeşitli piyasa koşulları için esnek bir seçim yapar. Trend Takip Stratejisi: Trendleri etkili bir
Atomic Analyst MT5
Issam Kassas
4.82 (11)
Öncelikle belirtmek gerekir ki bu Ticaret Göstergesi Yeniden Çizim Yapmaz, Gecikmez ve Gecikme Göstermez, bu da hem manuel hem de robot ticareti için ideal hale getirir. Atom Analisti, Piyasada Daha İyi Bir Avantaj Bulmak İçin Fiyatın Gücünü ve Momentumunu Kullanan PA Fiyat Hareketi Göstergesidir. Gürültüleri ve Yanlış Sinyalleri Kaldırmaya ve Ticaret Potansiyelini Artırmaya Yardımcı Olan Gelişmiş Filtrelerle Donatılmıştır. Birden fazla katmanlı karmaşık göstergeler kullanarak, Atom Analisti
FX Volume MT5
Daniel Stein
4.94 (17)
Sabah Brifingimiz aracılığıyla ayrıntılar ve ekran görüntüleri ile günlük piyasa güncellemenizi alın burada mql5 ve on Telegram ! FX Volume, bir brokerin bakış açısından piyasa duyarlılığı hakkında GERÇEK bir fikir veren İLK ve TEK hacim göstergesidir. COT raporlarından çok daha hızlı bir şekilde, brokerlar gibi kurumsal piyasa katılımcılarının Forex piyasasında nasıl konumlandıklarına dair harika bilgiler sağlar. Bu bilgileri doğrudan grafiğinizde görmek, ticaretiniz için gerçek oyun değiştir
Quantum Trend Sniper
Bogdan Ion Puscasu
5 (37)
Tanıtım       Kuantum Trend Keskin Nişancı Göstergesi   , trend tersine dönmeleri belirleme ve ticaret yapma şeklinizi değiştiren çığır açan MQL5 Göstergesi! 13 yılı aşkın ticaret tecrübesine sahip deneyimli tüccarlardan oluşan bir ekip tarafından geliştirilmiştir.       Kuantum Trend Keskin Nişancı Göstergesi       trend dönüşlerini son derece yüksek doğrulukla belirlemenin yenilikçi yolu ile ticaret yolculuğunuzu yeni zirvelere taşımak için tasarlanmıştır. ***Kuantum Trend Keskin Nişancı Gö
Trend Screener Pro MT5
STE S.S.COMPANY
4.89 (61)
Trend Göstergesi, Trend Alım Satım ve Filtreleme için Çığır Açan Benzersiz Çözüm, Tüm Önemli Trend Özellikleriyle Tek Bir Araç İçinde Yerleştirildi! Forex, emtialar, kripto para birimleri, endeksler ve hisse senetleri gibi tüm sembollerde/araçlarda kullanılabilen %100 yeniden boyamayan çoklu zaman çerçevesi ve Çoklu para birimi göstergesidir. Trend Screener, grafikte noktalarla ok trend sinyalleri sağlayan etkili bir trend trend göstergesidir. Trend analizörü göstergesinde bulunan özellikler: 1.
Öncelikle, bu Ticaret Aracının Non-Repainting, Non-Redrawing ve Non-Lagging Gösterge olduğunu vurgulamakta fayda var, bu da onu profesyonel ticaret için ideal hale getiriyor. Akıllı Fiyat Hareketi Kavramları Göstergesi, hem yeni hem de deneyimli tüccarlar için çok güçlü bir araçtır. İleri ticaret fikirlerini, Inner Circle Trader Analizi ve Smart Money Concepts Ticaret Stratejileri gibi 20'den fazla kullanışlı göstergeyi bir araya getirerek bir araya getirir. Bu gösterge, büyük kurumların tica
Top indicator for MT5   providing accurate signals to enter a trade without repainting! It can be applied to any financial assets:   forex, cryptocurrencies, metals, stocks, indices .  Watch  the video  (6:22) with an example of processing only one signal that paid off the indicator! MT4 version is here It will provide pretty accurate trading signals and tell you when it's best to open a trade and close it. Most traders improve their trading results during the first trading week with the help of
FX Power MT5 NG
Daniel Stein
5 (4)
Sabah Brifingimiz burada mql5 ve on Telegram! FX Power MT5 NG , uzun zamandır çok popüler olan döviz gücü ölçerimiz FX Power'ın yeni neslidir. Peki bu yeni nesil güç ölçer ne sunuyor? Orijinal FX Power hakkında sevdiğiniz her şey PLUS GOLD/XAU güç analizi Daha da hassas hesaplama sonuçları Ayrı ayrı yapılandırılabilir analiz dönemleri Daha da iyi performans için özelleştirilebilir hesaplama limiti Özel çokluDaha fazlasını görmek isteyenler için örnek ayarlar Her grafikte en sevdiğiniz renkler i
RelicusRoad Pro MT5
Relicus LLC
4.82 (22)
Şimdi 147 $ (birkaç güncellemeden sonra 499 $ 'a yükseliyor) - Sınırsız Hesaplar (PC'ler veya Mac'ler) RelicusRoad Kullanım Kılavuzu + Eğitim Videoları + Özel Discord Grubuna Erişim + VIP Durumu PİYASAYA BAKMAK İÇİN YENİ BİR YOL RelicusRoad, forex, vadeli işlemler, kripto para birimleri, hisse senetleri ve endeksler için dünyanın en güçlü ticaret göstergesidir ve yatırımcılara kârlı kalmaları için ihtiyaç duydukları tüm bilgileri ve araçları sağlar. Başlangıç ​​seviyesinden ileri seviyey
Auto Order Block with break of structure based on ICT and Smart Money Concepts Futures Break of Structure ( BoS )             Order block ( OB )            Higher time frame Order block / Point of Interest ( POI )    shown on current chart           Fair value Gap ( FVG ) / Imbalance   ,  MTF      ( Multi Time Frame )    Volume Imbalance     ,  MTF          vIMB Gap’s Equal High / Low’s     ,  MTF             EQH / EQL Liquidity               Current Day High / Low           HOD /
XQ Indicator MetaTrader 5
Marzena Maria Szmit
5 (1)
Step into the realm of Forex trading with confidence and precision using XQ, a cutting-edge Forex indicator designed to elevate your trading game to unprecedented heights. Whether you're a seasoned trader or just stepping into the world of currency exchange, XQ Forex Indicator empowers you with the insights and signals needed to make informed trading decisions. The signal conditions are a combination of three indicators, and XQ Forex Indicator only display  medium and long-term trends . The ind
Blahtech Supply Demand MT5
Blahtech Limited
4.57 (14)
Was: $299  Now: $99   Supply Demand uses previous price action to identify potential imbalances between buyers and sellers. The key is to identify the better odds zones, not just the untouched ones. Blahtech Supply Demand indicator delivers functionality previously unavailable on any trading platform. This 4-in-1 indicator not only highlights the higher probability zones using a multi-criteria strength engine, but also combines it with multi-timeframe trend analysis, previously confirmed swings
Advanced Supply Demand MT5
Bernhard Schweigert
4.53 (15)
Herhangi bir Acemi veya Uzman Tüccar için En İyi Çözüm! Bu gösterge benzersiz, yüksek kaliteli ve uygun fiyatlı bir ticaret aracıdır çünkü bir dizi tescilli özelliği ve yeni bir formülü bir araya getirdik. Bu güncelleme ile çift zaman dilimi dilimlerini gösterebileceksiniz. Yalnızca daha yüksek bir TF gösteremeyeceksiniz, aynı zamanda TF grafiğini ve ARTIK daha yüksek TF'yi de gösterebileceksiniz: YUVARLAK BÖLGELERİ GÖSTERMEK. Tüm Arz Talebi tüccarları buna bayılacak. :) Önemli Bilgiler Açıkland
ICT, SMC, SMART MONEY CONCEPTS, SMART MONEY, Smart Money Concept, Support and Resistance, Trend Analysis, Price Action, Market Structure, Order Blocks, BOS/CHoCH,   Breaker Blocks ,  Momentum Shift,   Supply&Demand Zone/Order Blocks , Strong Imbalance,   HH/LL/HL/LH,    Fair Value Gap, FVG,  Premium  &   Discount   Zones, Fibonacci Retracement, OTE, Buy Side Liquidity, Sell Side Liquidity, BSL/SSL Taken, Equal Highs & Lows, MTF Dashboard, Multiple Time Frame, BigBar, HTF OB, HTF Market Structure
Gann Kare Göstergesi, W.D. Gann tarafından yazılan "Piyasa Tahminleri için Matematiksel Formül" makalesine dayalı güçlü bir piyasa analizi aracıdır. Bu araç, piyasa analizi için matematiksel ve Gann teorilerini kullanarak hassas analizler gerçekleştirir. 144, 90, 52 karelerini ve ayrıca 9 karesini kullanır. Ayrıca, ın 9 karesi ve bu kareyle ilişkili kanallar ve yıldız modelleri için yöntemini içerir. Kullanıcı Kılavuzu ve Uygulama: Bu göstergeleri kullanmadan önce, kullanıcı kılavuzunu okumanız
AW Trend Predictor MT5
AW Trading Software Limited
4.76 (54)
Tek bir sistemde trend ve kırılma seviyelerinin kombinasyonu. Gelişmiş bir gösterge algoritması piyasa gürültüsünü filtreler, trendi, giriş noktalarını ve olası çıkış seviyelerini belirler. Gösterge sinyalleri, sinyal geçmişinin etkinliğini gösteren en uygun enstrümanların seçilmesine izin veren bir istatistiksel modüle kaydedilir. Gösterge Kâr Al ve Zararı Durdur işaretlerini hesaplar. Kılavuz ve talimatlar ->   BURAYA   / MT4 versiyonu ->   BURAYA Gösterge ile nasıl ticaret yapılır: Trend Pre
Fiyat tersine döndükçe ve geri çekildikçe piyasa yapısından elde edilen kâr değişir. Piyasa yapısını tersine çevirme uyarısı göstergesi, bir trendin veya fiyat hareketinin ne zaman tükenmeye yaklaştığını ve tersine dönmeye hazır olduğunu tanımlar. Genellikle bir geri dönüş veya büyük bir geri çekilme meydana gelmek üzereyken meydana gelen piyasa yapısındaki değişiklikler konusunda sizi uyarır. Gösterge, olası bir tükenme noktasının yakınında her yeni yüksek veya düşük oluştuğunda, başlangıçta
The Volume by Price Indicator for MetaTrader 5 features Volume Profile and Market Profile TPO (Time Price Opportunity). Get valuable insights out of currencies, equities and commodities data. Gain an edge trading financial markets. Volume and TPO histogram bar and line charts. Volume Footprint charts. TPO letter and block marker charts including split structures. Versatile segmentation and compositing methods. Static, dynamic and flexible ranges with relative and/or absolute visualizations. Lay
Tanıtım       Quantum Breakout PRO   , Breakout Bölgeleri ile ticaret yapma şeklinizi değiştiren çığır açan MQL5 Göstergesi! 13 yılı aşkın ticaret tecrübesine sahip deneyimli tüccarlardan oluşan bir ekip tarafından geliştirilmiştir.       Kuantum Breakout PRO       yenilikçi ve dinamik koparma bölgesi stratejisiyle ticaret yolculuğunuzu yeni zirvelere taşımak için tasarlanmıştır. Kuantum Breakout Göstergesi, size 5 kar hedefi bölgesi ile kırılma bölgelerinde sinyal okları ve kırılma kutusuna
TrendLine PRO MT5
Evgenii Aksenov
4.78 (49)
The Trend Line PRO indicator is an independent trading strategy. It shows the trend change, the entry point to the transaction, as well as automatically calculates three levels of Take Profit and Stop Loss protection Trend Line PRO is perfect for all Meta Trader symbols: currencies, metals, cryptocurrencies, stocks and indices Advantages of Trend Line PRO Never redraws its signals The possibility of using it as an independent strategy It has three automatic levels Take Profit and Stop Loss lev
Owl Smart Levels MT5
Sergey Ermolov
4.47 (36)
MT4 versiyonu  |  FAQ Owl Smart Levels Indicator , Bill Williams'ın gelişmiş fraktalları , piyasanın doğru dalga yapısını oluşturan Valable ZigZag ve kesin giriş seviyelerini gösteren Fibonacci seviyeleri gibi popüler piyasa analiz araçlarını içeren tek gösterge içinde eksiksiz bir ticaret sistemidir. pazara ve kar elde edilecek yerlere. Stratejinin ayrıntılı açıklaması Gösterge ile çalışma talimatı Baykuş Yardımcısı ticaretinde Danışman Yardımcısı Kullanıcıların özel sohbeti -> Satın aldıktan
Gartley Hunter Multi
Siarhei Vashchylka
5 (5)
Gartley Hunter Multi - An indicator for searching for harmonic patterns simultaneously on dozens of trading instruments and on all classic timeframes: (m1, m5, m15, m30, H1, H4, D1, Wk, Mn). Manual (Be sure to read before purchasing) | Version for MT4 Advantages 1. Patterns: Gartley, Butterfly, Shark, Crab. Bat, Alternate Bat, Deep Crab, Cypher 2. Simultaneous search for patterns on dozens of trading instruments and on all classic timeframes 3. Search for patterns of all possible sizes. Fr
Trend Line Map Pro MT5
STE S.S.COMPANY
4.67 (9)
Trend Line Map indicator is an addons for   Trend Screener Indicator . It's working as a scanner for all signals generated by Trend screener ( Trend Line Signals ) . It's a Trend Line Scanner based on Trend Screener Indicator.  If you don't have Trend Screener Pro Indicator,   the Trend Line Map Pro will not work.     LIMITED TIME OFFER : Trend Line Map Indicator is available for only 50 $ and lifetime. ( Original price 125$ ) By accessing to our MQL5 Blog,  you can find all our premium indica
TrendDecoder Premium MT5
Christophe, Pa Trouillas
5 (1)
Aralıkları ve bir sonraki olası hamleleri belirleyin     |    Trendlerin en erken sinyallerini ve gücünü alın     |    Geri dönüşten önce net çıkışlar alın     |    Fiyatın test edeceği Fibo seviyelerini tespit edin   |  Gecikmesiz, takip edilmeyen gösterge - manuel ve otomatik ticaret için ideal - tüm varlıklar ve tüm zaman birimleri için uygun 50 İNDİRİM   - lansman için sonra tekrar   >>   149 $ Satın aldıktan sonra, kişiselleştirilmiş ayarlar için   bu kanaldan benimle iletişime geçin . MT4
MetaBands M5
Vahidreza Heidar Gholami
4.67 (3)
MetaBands uses powerful and unique algorithms to draw channels and detect trends so that it can provide traders with potential points for entering and exiting trades. It’s a channel indicator plus a powerful trend indicator. It includes different types of channels which can be merged to create new channels simply by using the input parameters. MetaBands uses all types of alerts to notify users about market events. Features Supports most of the channel algorithms Powerful trend detection algorith
TPSpro TRENDPRO  - is a trend indicator that automatically analyzes the market and provides information about the trend and each of its changes, as well as giving signals for entering trades without redrawing! The indicator uses each candle, analyzing them separately. referring to different impulses - up or down impulse. Exact entry points into transactions for currencies, crypto, metals, stocks, indices!  -  Version MT4                  DETAILED DESCRIPTION        /       TRADING SETUPS       
Was: $249  Now: $99   Market Profile defines a number of day types that can help the trader to determine market behaviour. A key feature is the Value Area, representing the range of price action where 70% of trading took place. Understanding the Value Area can give traders valuable insight into market direction and establish the higher odds trade. It is an excellent addition to any system you may be using. Inspired by Jim Dalton’s book “Mind Over Markets”, this indicator is designed to suit the
Grafiğinizde otomatik olarak destek ve direnç seviyeleri PLUS itici mum boşlukları çizin, böylece fiyatın nereye gidebileceğini ve / veya potansiyel olarak tersine dönebileceğini görebilirsiniz. Bu gösterge, web sitemde (The Market Structure Trader) öğretilen pozisyon ticareti metodolojisinin bir parçası olarak kullanılmak üzere tasarlanmıştır ve hedefleme ve potansiyel girişler için temel bilgileri görüntüler. MT4 Version:  https://www.mql5.com/en/market/product/97246/ Göstergede 2 TEMEL öze
Golden Spikes Detector
Batsirayi L Marango
5 (1)
Golden Spikes Detector This indicator is based on an advanced strategy primarily for trading spikes on Boom and Crash Indices. Complex algorithms were implemented to detect high probability entries only. It alerts on potential Buy and Sell entries. To trade spikes on the Deriv or Binary broker, only take Buy Boom and Sell Cash alerts. It was optimised to be loaded on 5-minute timeframe although multiple timeframe analysis is done in the background. Features ·             Desktop pop up and sound
IX Power MT5
Daniel Stein
5 (2)
IX Power   nihayet FX Power'ın rakipsiz hassasiyetini Forex dışı sembollere getiriyor. En sevdiğiniz endeksler, hisse senetleri, emtialar, ETF'ler ve hatta kripto para birimlerindeki kısa, orta ve uzun vadeli eğilimlerin yoğunluğunu doğru bir şekilde belirler. Terminalinizin sunduğu   her şeyi analiz   edebilirsiniz. Deneyin ve işlem yaparken   zamanlamanızın   nasıl   önemli ölçüde iyileştiğini   deneyimleyin. IX Power Temel Özellikler 100 hassas, yeniden boyanmayan hesaplama sonuçları -
Yazarın diğer ürünleri
Trend ticaret stratejisi "Süper Trend Esnek Uyarısı EA", aynı adı taşıyan "Süper Trend Esnek Uyarısı" göstergesi üzerine inşa edilmiştir. Danışman göstergedeki tüm bilgileri kullanır, dolayısıyla danışmanın yalnızca üç parametresi vardır, bunlar: "Çalışma zaman dilimi" - çalışma zaman dilimini, göstergenin oluşturulduğu zaman dilimini ve ayrıca "OHLC" verilerinin alındığı zaman dilimini belirtir. "Zararı Durdur", "puan" cinsinden ölçülen zararı durdurmanın sabit boyutudur ("Artı, Ctrl+F" aracın
Tanım: "Piyasa Yapısı HH HL LH LL" göstergesi, finansal piyasalardaki fiyat dinamiklerini analiz etmek için güçlü ve aynı zamanda basit bir araçtır. Bu gösterge, yatırımcıların ve yatırımcıların trendlerdeki değişiklikleri tespit etmelerine ve fiyat zaman serilerindeki önemli noktaları tespit etmelerine yardımcı olur. Göstergenin temel bileşenleri: HH (Yüksek Yüksek): Fiyatın bir önceki yüksek tepenin üzerinde kapandığı tepe. HH güçlenen bir yükseliş trendine işaret ediyor. HL (Yüksek Düş
Trend göstergesi "   Süper Trend Esnek Uyarısı   " minimum ayara sahiptir. Bu gösterge, kullanımı mümkün olduğunca kolay olacak şekilde tasarlanmıştır. Gösterge, ana renkli bir çizgiyle eğilimi gösterir ("Veri Pencereleri" penceresinde görebileceğiniz ("SuperTrend" satırı). Ayrıca, trendin değiştiği yerlerde, gösterge renkli okları gösterir ( "Veri Pencereleri" penceresinde görebileceğiniz   "STBuy" ve "   STSell" simgeleri       ). Trendin değiştiği yerlerde, gösterge bir sinyal vermez: bir ses
Gösterge yükseliş ve düşüş eğilimi gösteriyor. Göstergenin kendisi (normal stokastik gibi) bir alt pencerede görüntülenir. Grafik arayüzü   : Ana pencerede, "Düşük" fiyattan "Düşük" fiyata (yükseliş farklılığı için) ve "Yüksek" fiyattan "Yüksek" fiyata (düşüş eğilimi sapması için) kadar üretilen "trend çizgisi" grafik nesneleri oluşturulur. ). Gösterge, penceresinde yalnızca grafik tamponlarını kullanarak çizer: “Ana”, “Sinyal”, “Nokta”, “Al” ve “Satış”. "Al" ve "Satış" tamponları farklılık gös
The Candle Length Indicator Alarm generates a sound alert, sends a push notification and an email when the size of the current candlestick changes. The size of the current candlestick can be measured in two ways: The first method: the size of the candlestick is measured from the beginning of the candlestick (from the OPEN price). The second method: the size of the candlestick is measured from current price. The indicator has the following settings: sound — a sound file from the folder: "...\Meta
The Buy Sell Color Background indicator changes the background color depending on position direction. It has three settings: Background color for BUY - background color for a Buy position Background color for SELL - background color for a Sell position Default background color - background color with no open position After you detach the indicator from a chart, its background color changes to Default background color .
The calculator of signals operates directly from the MetaTrader 5 terminal, which is a serious advantage, since the terminal provides a preliminary selection and sorts out signals. This way, users can see in the terminal only the signals that ensure a maximum compatibility with their trading accounts. The calculator of signals gives the answer to the one of the questions most frequently asked by users of the Signals service: "Will I be able to subscribe to the signal NNN, and what volume of the
Arrow Signal
Vladimir Karputov
Bu gösterge "Stokastik" kategorisine aittir. Gösterge kontrolünü mümkün olduğunca basitleştirmeye çalıştım, bu nedenle giriş parametrelerinde minimum ayarlar gösteriliyor: bu, sinyal okları için bir simge seçimidir. "Satın Al" sinyali '   Al Ok kodu   ' parametresi ile, "Sat" sinyali ise '   Ok Sat kodu   ' parametresi ile kodlanır. Sinyaller için sinyal ok kodları (lütfen 32 ile 255 arasındaki değerleri kullanın) Wingdings yazı tipinden alınmıştır. Gösterge her tik üzerinde çalışır ve mevcut çu
An Expert Advisor based on the custom indicator. Search for a signal at every tick. Positions are closed by an opposite signal. No trailing. There is no stop loss. There is no take profit. Has a minimum of settings Money management: Lot OR Risk   - type Money management The value for "Money management"   - Money management value Deviation   - admissible slippage Buy Arrow code   (font Wingdings) - character code from 'Wingdings' font for BUY signals Sell Arrow code   (font Wingdings) - characte
Ma Dema Alert
Vladimir Karputov
Gösterge üç çizgi görüntüler ve iki tür kavşağı izler. Göstergenin üç satırı: "   MA   " - yavaş gösterge "Hareketli Ortalama", "   DEMA Yavaş   " - yavaş gösterge "   Çift Üstel Hareketli Ortalama" ve "   DEMA Hızlı   " - hızlı gösterge "Çift Üstel Hareketli Ortalama". İki tür kavşak       : "   MA Uyarı Fiyatı   " - fiyat   "MA" çizgisini geçiyor ve   "   Alert DEMA DEMA   " - çizgiler kesişiyor       "DEMA Yavaş" ve   "DEMA Hızlı   ". Karşıdan karşıya geçerken aşağıdaki seçenekler mevcuttur:
Bu Uzman Danışman, manuel ve yarı otomatik ticaret için yardımcı programlar sınıfına aittir. "   Günün uç   noktalarında bekleyen emir " EA, bir önceki günün uç noktalarında bekleyen iki emir verir. Parametre "   Bekleyen Emirler: ...       ", bekleyen emirlerin türünü seçmenizi sağlar: "   Alış Durdurma ve Satış Durdurma   " veya "   Alış Limiti ve Satış Limiti   "   .       aşırılık       'Düşük' ofset aşağı doğru yapılır). "   Yeni beklemede -> öncekileri sil   " "   true   " olarak ayarlandı
"Panel Kısmi Kapatma" yardımcı programı paneli, kâr getiren bir pozisyonun hızlı bir şekilde kısmen kapatılması için tasarlanmıştır. Yalnızca iki parametresi vardır: "   Kısmi kapatma #1   " ve "   Kısmi kapatma #2   ". Herhangi bir sembol ve herhangi bir 'Sihirli sayı' için çalışır - yani, yardımcı program öncelikle manuel ticaret için tasarlanmıştır. Nasıl çalışır: Örneğin, "EURUSD", "Jump 100 Index" ve "XAUUSD" (altın) üzerinde çeşitli pozisyonlarınız var. Yardımcı program en yüksek karı olan
MQL5 "Günlük direnç ve destek" göstergesi - günlük destek ve direnç çizgilerini çizer. Çizim yalnızca grafik nesnelerin (trend çizgileri) yardımıyla gerçekleştirilir - bu göstergede gösterge tamponları kullanılmaz. Göstergenin herhangi bir ayarı yoktur - seviye araması "D1" zaman aralığından son 500 barda gerçekleştirilir ve bu parametre kodun içinde fiziksel olarak bağlanmıştır. Manuel ticaret: Manuel alım satım yaparken, bu göstergenin "M10" ile "H1" arasındaki zaman dilimlerinde kullanılması
"   Çoklu Sembol İzleme   " yardımcı programı, halihazırda açık olan tüm pozisyonlar için Kaybı Durdur'u hareket ettirir (çoklu sembol izleme). Öncelikle manuel ticarete yardımcı olmayı amaçlamaktadır. Yardımcı program için döviz çiftinin adına veya bireysel tanımlayıcıya (Sihirli sayı) göre herhangi bir kısıtlama yoktur - yardımcı program kesinlikle şu anda açık olan tüm pozisyonları işler. "   Trailing Stop   " ve "   Trailing Step   " parametrelerinin ölçü birimi puandır (1.00055 fiyatı ile
"Trend İki Hareketli Ortalama" trend göstergesi, hesaplama sonuçlarını görüntülemek için iki tür Ok kullanır - bunlar "Trend UP" ve "Trend DN".       Oklar "Trend Yukarı"       çizilir       İle       fiyat       'Düşük'       çubuk   ,       A       Oklar "Trend DN" -       İle       fiyat       'yüksek'. Trend arama algoritması, bir çubuğun fiyatının analizine ve iki 'Hareketli Ortalama' göstergesinin değerlerine dayanır. Trend yönü, mevcut (sıfır) çubuğunda hesaplanır. Bu nedenle, 1 numaralı
Üç Zaman Çerçevesi gösterge paneli. Gösterge, CAppDialog sınıfına dayalı bir panel şeklinde yapılır. Panel, fare kullanılarak simge durumuna küçültülebilir veya geçerli grafikte hareket ettirilebilir. Gösterge, paneldeki mevcut sembolün üç zaman dilimini gösterir. Mevcut sürümde, göstergenin minimum sayıda ayarı vardır - bunlar üç zaman diliminin parametreleridir: "Daha genç zaman dilimi", "   Orta   zaman dilimi   " ve "   Daha eski   zaman dilimi   ". Başlatıldığında, gösterge paneli mevcut ta
"   Piyasa Seans Süreleri   " göstergesi dört işlem seansının süresini gösterir: Asya, Avrupa, Amerika ve Pasifik. Ticaret seanslarının süresi   şu formatta   ayarlanır:       GMT ve dolayısıyla ticaret sunucusuna hiç bağlı değildir. Aşağıdaki veriler kullanılır: Ticaret Seansı Şehir GMT Asya Tokyo Singapur Şanghay 00:00−06:00 01:00−09:00 01:30−07:00 Avrupa Londra Frankfurt'ta 07:00−15:30 07:00−15:30 Amerika New York Chicago 13:30−20:00 13:30−20:00 Pasifik Wellington Sidney 20:00−
Çeşitli ticaret işlemleri için ticaret sistemi. Belirli indirim görevleri veya benzerleri için kullanılan bakiyeyi sıfır civarında dolaşacak şekilde ayarlamanıza olanak tanır. Riskten korunma   hesaplarıyla çalışacak şekilde yapılandırılmıştır.   Piyasada birden fazla pozisyon bulunamaz   . Genel bir ayar olan "   Adım, Zararı Durdur, Kar Al   " parametresi puan cinsinden ölçülür (EURUSD için örnek: 1.00055-1.00045 = 10 puan). Danışman,   pozisyon yerleştirirken marj eksikliğiyle karşılaşırsa ti
Gösterge daha yüksek zaman dilimindeki Fraktalları gösterir. İki tür Fraktal görüntülemek mümkündür: 'Normal Fraktal' ve 'BW Fraktal'. Fraktal 'UP' oluşumunu düşünün. 'Düzenli Fraktal', her bir sonraki 'yüksek' fiyatın (orta çubuğun solunda ve sağında) daha küçük olduğu çok katı bir Fraktaldır. Oysa 'BW Fractal'da tek bir koşul vardır: Merkezi çubuğun (fiyatı 'yüksek') en yüksek olması gerekir. Görsel olarak bu iki mod arasındaki fark diyagram 1'de görülebilir. 'Daha Yüksek Zaman Çerçevesi' par
Yapay Zeka Desteği Direnci Bu, “Destek” ve “Direnç” satırlarını arayan bir göstergedir. Arama, sayısal analiz ve veri işlemeye yönelik bir algoritma kullanılarak gerçekleştirilir. Üç arama seçeneği mevcuttur (“mod #1”, “mod #2” ve “mod #3”). Bu seçeneklerin her biri kendi dahili algoritmasında farklılık gösterir (şu anda bunlar tamamen dahili ayarlardır, kullanıcı tarafından kullanılamaz). Bu seçeneklerin aramanın ciddiyetine göre farklılık gösterdiğini söyleyebiliriz. Sınırlama: Şu anda gösterg
Yardımcı program "       Zaman Yöneticisini Aç       " belirli bir zamanda bir pozisyon açar ve ardından klasik takibi etkinleştirir. Zaman ("       Şimdi       ":"       dakika       ") her zaman GMT zaman diliminde bir GMT Farkı ile ayarlanır. ' tuşunu kullanarak bir pozisyon açmak için üç seçenek seçebilirsiniz.       Ticaret Modu       ': '       ELDE ETMEK       ' '       SATMAK       ' '       AL ve SAT (aynı anda)       ' '       KAPALI (değişim yok, yalnızca son çalışmalar)       ' Dörd
Gösterge       "Destek" ve "Direnç" çizgilerini gösterir (bu çizgiler DRAW_LINE çizim stili kullanılarak çizilmiştir - yani bunlar grafik nesneleri değildir). "Sinyal çubuğunun" solunda ve sağında yeni minimum ve maksimumlar için bir arama gerçekleştirilir - "sinyal çubuğu" her yeni yapının geleneksel ortasıdır. Göstergenin adında neden Esnek kelimesi geçiyor? Çünkü "sinyal çubuğunun" solunda ('Sol Çubuklar') ve sağında ('Sağ Çubuklar') farklı sayıda çubuk belirtme olanağımız var. Gösterge çizgi
Kontrol paneli iki göstergenin okumalarını tarar: 'MACD' ve 'Stokastik'. Sinyalleri üç sütunda görüntüler: MACD için, Stokastik için ve sonuç sütunu (sinyal her iki gösterge için de aynıysa). Tarama bir veya daha fazla zaman diliminde seçilebilir. Tüm zaman aralıklarını devre dışı bırakırsanız kontrol paneli yine de yüklenir, ancak bu tür durumlara özel ayarlar bulunur. Sinyaller her zaman göstergenin sıfır çubuğu (sıfır çubuğu grafikte en sağdaki çubuktur) açısından kontrol edilir. Parametreler
ATR Bantları Uyarısı, kanal genişliğinin sabit bir çarpan ("Çarpan") ve "Ortalama Gerçek Aralık" göstergesinin değeri olarak hesaplandığı bir kanal göstergesidir. Bollinger Bantlarından farklı olarak bant genişliği çok sık değişmez; ATR Bant Uyarısı göstergesinde bantlar genellikle uzun düz çizgilere sahiptir. ATR Bantları Uyarısının yorumlanması, fiyatın çoğu zaman bantların içinde olduğu gerçeğine dayanmaktadır ve fiyatın sınırlardan birine ulaşması bir trend değişikliğine işaret edebilir.
Filtrele:
İnceleme yok
İncelemeye yanıt
Sürüm 1.11 2023.03.05
Small error in the code