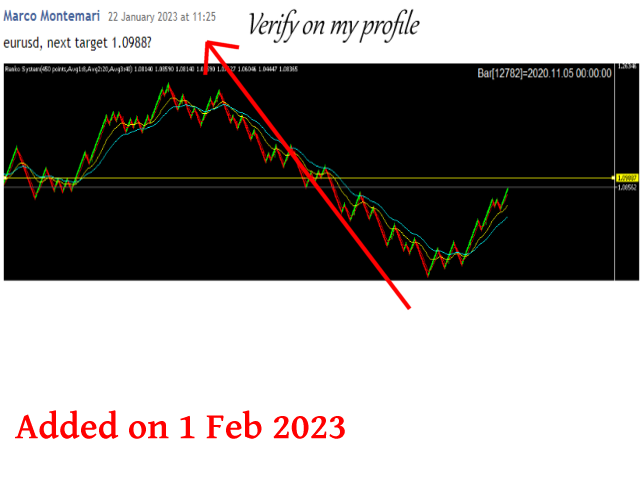
Renko system lit
- Göstergeler
- Marco Montemari
- Sürüm: 1.0
This indicator can be considered as a trading system.
It offers a different view to see the currency pair: full timeless indicator, can be used for manual trading or for automatized trading with some expert advisor. When the price reaches a threshold a new block is created according to the set mode.
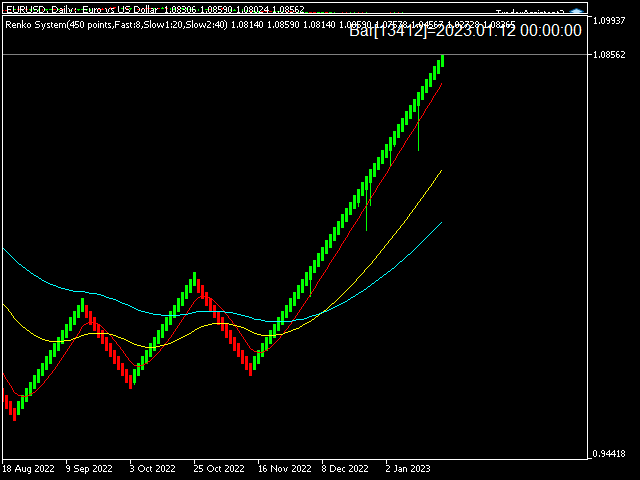
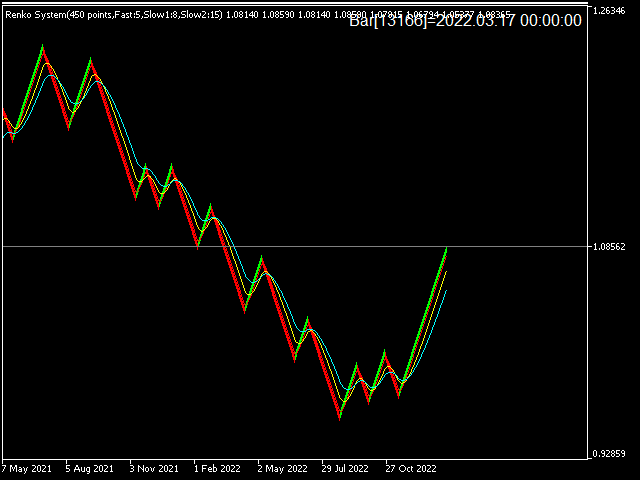
The indicator beside the Renko bars, shows also 3 moving averages.
Features
- renko mode
- median renko
- custom median renko
- 3 moving averages
- wicks
- datetime indicator for each block
- custom notifications to pc and to phone when a new bars is created and/or a cross between moving averages shows up
- raise event for using with an EA when a new bars is created and/or a cross between moving averages shows up
How to use
This is the lite version of Renko System
The only limitations of this version are some parameters can not set (read only). In this way the user can start to appreciate the Renko visualization and how this indicator can be very powerful and simple at the same time.
Renko charts are based on bricks with a fixed value that filters out smaller price movements.
First thing to do is deciding the brick height. It depends of the duration we want to stay in the market, the volatilty of the market. A good choice could be using the ATR indicator to check the average value of candles in the TF we want to operate.
Time frame should be low( depending of brick height) to have a good representation of historical bars, otherwise the user should adapt the timeframe related to brick height set. MT5 builds bars using OHLC (open, high,low,close)
Strongly raccomanded to switch TF before starting (for example if you are in 30M switch to 15M and then 30M again) to allow refreshing data at the beginning otherwise a wrong graph can be showed. The issue can happens if we have MT5 open and we put in standby or hybernation the computer. When awake again the graph will not be updated correctly.
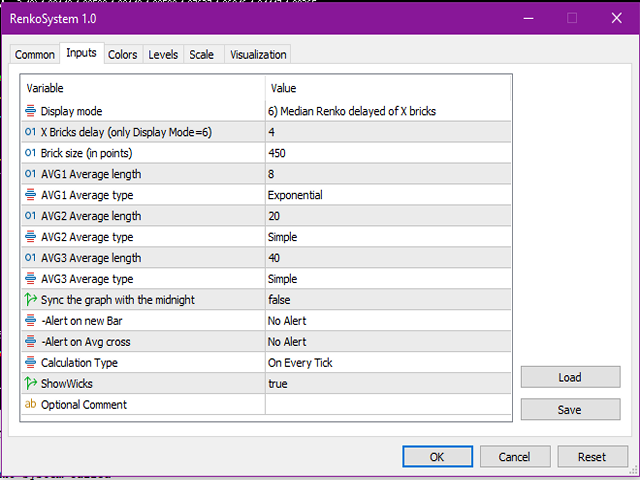
INPUT parameters
DisplayMode: RenkoAdv, True Renko, Median Renko
The difference is :
-With RenkoAdv, every brick has drawn after a number of points set in BoxSize parameters.
-With TrueRenko on inversion of trend, the price must be distant the double of BoxSize before drawing the bricks. When the double is reached, 2 bricks are drawn. It is less noisy of RenkoAdv mode but it has more delay when changing trend occurs.
-With Median Renko we have a smoother price movement.
-Other mode have been created for allowing the customization of the delay.
Brick size (in Points): the thickness of the renko bar in points
Calculation Type: how to calculate a new renko bar. We can decide to update the graph only at the beginning of a new bar, it is a time dependency.
AVGx Average length: length for the x moving average
AVGx Average type: simple or exponential for the x moving average
Alert on new bar: computer or phone notification is available
Alert on Avg cross: computer or phone notification is available
Show wicks: it will show wicks on the graphic
Optional comment: on push notification and events, the optional comment is sent too.
Sync graph with midnight: Renko is not dependent by the time, so if you close the metatrader and open it again in few hours, the graph could be a little different by today. With this feature the graph will start to be drawn by the first candle starting at midnight.
Common problem
- For receiving phone notification you need to have installed MT5 on your phone and follow the procedure to enable push notification. If you have problems feel free to contact me.
- if nothing is displayed, try the following:
- -turn off the Sync feature
- -check also the brick size, it could be too much big or too much small
- -in the mt5 tools, option, charts, set 100000 for max bars in chart.
Using with an EA
if you want to use this indicator with your EA just contact me.
PS: please rate this indicator and leave a comment.