BarEndTime by MMD MT5
- Göstergeler
- Mariusz Maciej Drozdowski
- Sürüm: 1.0
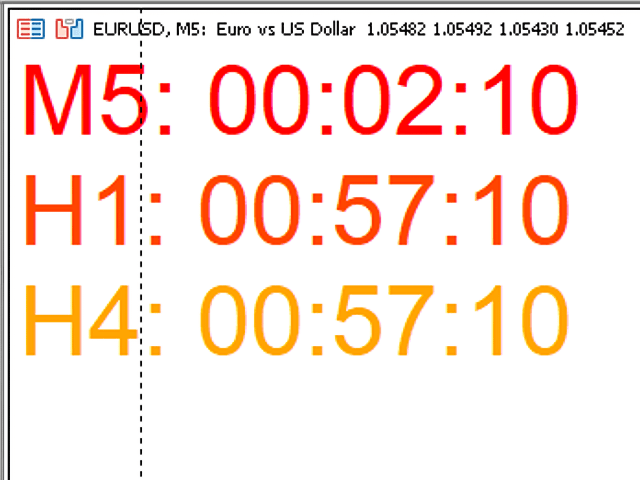
MMD'nin Zaman Sonu çubuğu, seçilen üç aralıkta kalan saniye sayısını gösteren basit bir göstergedir.
MMD metodolojisine göre yönlü bir fiyat hareketinin meydana geldiği an önemlidir. Bu gösterge, Forex ve Vadeli İşlem ticaretinde bu ilişkiyi daha etkin bir şekilde kullanmanızı sağlar.
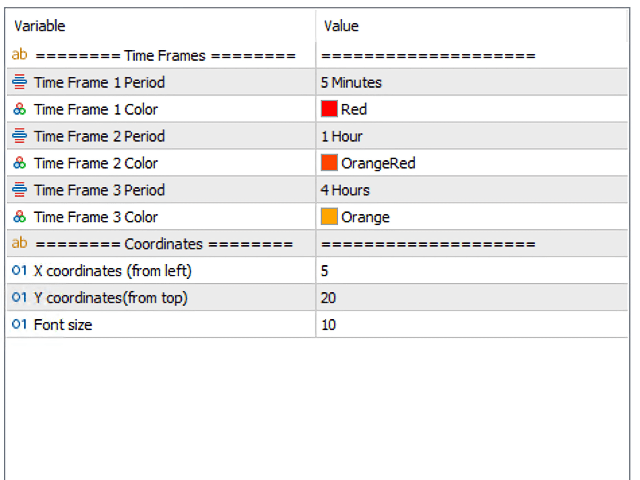
İşlevsellik açıklaması:
Zaman Çerçevesi 1 Periyodu - ilk zaman aralığını tanımlama
Zaman Çerçevesi 1 Renk - ilk zaman aralığı için rengi belirleme
Zaman Çerçevesi 1 Periyodu - ikinci zaman aralığını tanımlar
Zaman Çerçevesi 1 Rengi - ikinci zaman aralığı için rengi belirleme
Zaman Çerçevesi 1 Periyodu - üçüncü zaman aralığını tanımlar
Zaman Çerçevesi 1 Renk - üçüncü zaman aralığı için rengi belirleme
Grafikte görüntülenen verilerin konumu:
X koordinatları - grafiğin sol tarafından nokta sayısı
Y koordinatları - grafiğin üstünden nokta sayısı
Yazı tipi boyutu - yazı tipi boyutu