• Genel bakış
  • İncelemeler
  • Yorumlar

Z Score Plus MT5

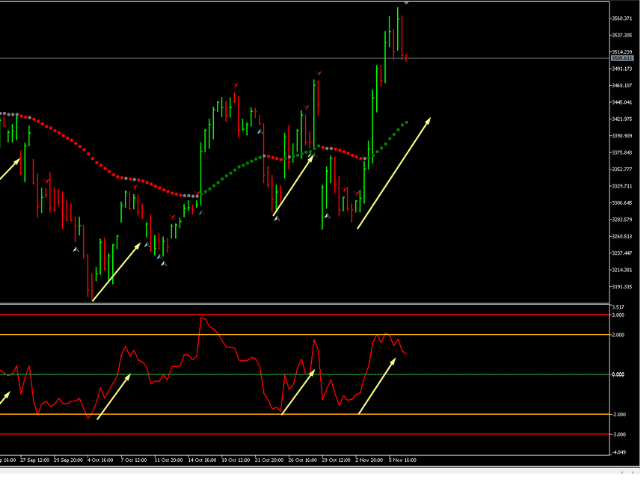
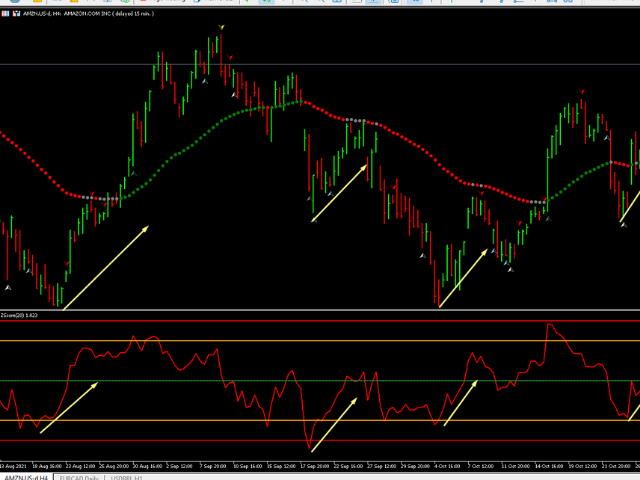
Finansta Z Puanları, bir gözlemin değişkenliğinin ölçüleridir ve tüccarlar tarafından piyasa oynaklığının belirlenmesine yardımcı olmak için kullanılabilir. Z puanları, Traders'a bir puanın belirli bir veri kümesi için tipik mi yoksa atipik mi olduğunu söyler. Z puanları aynı zamanda analistlerin birden fazla veri kümesinden alınan puanları uyarlayarak birbirleriyle daha doğru bir şekilde karşılaştırılabilecek puanlar oluşturmasını sağlar. # Pratikte, sıfır noktalı ZScore'umuz ve ultra yüksek noktalar için 2 ile 3 arasındaki salınımlar ve ultra yüksek düşük noktalar için -2 ile -3 arasındaki salınımlar var. Bu uçlar alım satım noktalarıdır ve bu noktalar bugün hala büyük kurumlar tarafından karar vermelerine yardımcı olmak için kullanılmaktadır.


Önerilen ürünler
Was: $249  Now: $99   Market Profile defines a number of day types that can help the trader to determine market behaviour. A key feature is the Value Area, representing the range of price action where 70% of trading took place. Understanding the Value Area can give traders valuable insight into market direction and establish the higher odds trade. It is an excellent addition to any system you may be using. Inspired by Jim Dalton’s book “Mind Over Markets”, this indicator is designed to suit the
BoxChart MT5
Evgeny Shevtsov
5 (7)
The market is unfair if only because 10% of participants manage 90% of funds. An ordinary trader has slim changes to stand against these "vultures". This problem can be solved. You just need to be among these 10%, learn to predict their intentions and move with them. Volume is the only preemptive factor that faultlessly works on any timeframe and symbol. First, the volume appears and is accumulated, and only then the price moves. The price moves from one volume to another. Areas of volume accumu
Simple ATR modern
Pavel Bereznichenko
Indicator  Simple ATR  Modern It is used in technical analysis to measure market volatility and show it as a level that is more understandable to the eye and not as an oscillator. ATR Daily - Blue The possibilities of using the ATR in trade can be found in the internet. It can also be used in conjunction with another author's indicator  Volatility Vision The Average True Range indicator measures market volatility. Volatility can be low while the market is growing (and vice versa). It is
This indicator allows you to enjoy the two most popular products for analyzing request volumes and market deals at a favorable price: Actual Depth of Market Chart Actual Tick Footprint Volume Chart This product combines the power of both indicators and is provided as a single file. The functionality of Actual COMBO Depth of Market AND Tick Volume Chart is fully identical to the original indicators. You will enjoy the power of these two products combined into the single super-indicator! Below is
VolumeProfile MT5
Robert Hess
3.75 (8)
Description: The Volume Profile displays detailed informations of historical trading activities at certain price levels (Market Profile). Locate the areas with the best prices in the market and get an advantage over other market participants. Support: The indicator is constantly being developed and improved. Please do not hesitate to contact me via the MQL5 Platform. I am very grateful about any Bug report, so that i can constantly improve the indicator. I appreciate any public review for this
Market profile was developed by Peter Steidlmayer in the second half of last century. This is a very effective tool if you understand the nature and usage. It's not like common tools like EMA, RSI, MACD or Bollinger Bands. It operates independently of price, not based on price but its core is volume. The volume is normal, as the instrument is sung everywhere. But the special thing here is that the Market Profile represents the volume at each price level. 1. Price Histogram The Price Histogram
Features 3 types of waves: bullish, bearish and unknown. The unknown tower comes when prices move in opposite the direction of the current tower. Label that shows the percentage remaining for the next tower. Allows you set the type of volume that will be accumulated in the towers, either real or tick volumes. Thus, the indicator works in any market, for example: stocks, futures, forex, commodities, etc. Allows you to set the required score for the tower exchange. Allows you to set the font size
Blahtech Supply Demand MT5
Blahtech Limited
4.57 (14)
Was: $299  Now: $99   Supply Demand uses previous price action to identify potential imbalances between buyers and sellers. The key is to identify the better odds zones, not just the untouched ones. Blahtech Supply Demand indicator delivers functionality previously unavailable on any trading platform. This 4-in-1 indicator not only highlights the higher probability zones using a multi-criteria strength engine, but also combines it with multi-timeframe trend analysis, previously confirmed swings
Wapv Price and volume
Eduardo Da Costa Custodio Santos
MT5 için WAPV Fiyat ve Hacim Göstergesi, (Wyckoff Academy Wave Market) ve (Wyckoff Academy Fiyat ve Hacim) araç setinin bir parçasıdır. MT5 için WAPV Fiyat ve Hacim Göstergesi, grafikteki hacim hareketini sezgisel bir şekilde görselleştirmeyi kolaylaştırmak için oluşturuldu. Bununla, piyasanın profesyonel bir ilgisinin olmadığı en yüksek hacim anlarını ve anları gözlemleyebilirsiniz. Piyasanın "akıllı para" hareketiyle değil, ataletle hareket ettiği anları belirleyin. Kullanıcı tarafından değişt
Mean Reversion Supply Demand Indicator Mean Reversion Supply Demand is the indicator to detect the important supply demand zone in your chart. The concept of supply demand trading relies on the quantity mismatching between buying and selling volumes in the financial market. Typically, supply demand zone serves to predict the turning point. The wave pattern, for any supply demand zone to work as an successful trade, looks like the price must touch the base zone, move away and then return to zone
Forex Volume MT5
KEENBASE SOFTWARE SOLUTIONS
KT Forex Volume shows the buying and selling volume of a currency pair in the form of a colored histogram. The volume is made of buying and selling transactions in an asset. In FX market: If the buying volume gets bigger than the selling volume, the price of a currency pair would go up. If the selling volume gets bigger than the buying volume, the price of a currency pair would go down. Features Avoid the bad trades by confirming them using the tick volume data. It helps you to stay on the si
Bu göstergenin benzersizliği, hacim hesaplama algoritmasında yatmaktadır: birikim, günün başlangıcına bakılmaksızın doğrudan seçilen dönem için gerçekleşir. Son çubuklar hesaplamanın dışında tutulabilir, bu durumda mevcut veriler daha önce oluşturulan önemli seviyeler (hacimler) üzerinde daha az etkiye sahip olacaktır. Daha doğru bir hesaplama için varsayılan olarak M1 grafiğindeki veriler kullanılır. Fiyat hacimlerinin dağıtım adımı düzenlenir. Varsayılan olarak, ekranın sağ sınırı, analiz için
Before installing the HeatMap indicator make sure you are using a broker that gives you access to the Depth of market (DOM) !! This indicator creates a heatmap on your chart allowing you to see the buy or sell limit orders easily and in real time. You have the possibility to change the setting and the colors of the HeatMap in order to adapt to all markets and all charts. Here is an example of a setting you can use with the NASDAQ100 on the AMPGlobal broker :  https://www.youtube.com/watch?v=x0
Strong Support mt5
Vasiliy Strukov
5 (9)
Destek ve direnç seviyeleri eski zamanlardan beri piyasayı analiz etmek için en güçlü araç olmuştur. Güçlü Destek göstergesi, destek seviyelerini yerel fiyat düşüklerine ve direnç seviyelerini yerel fiyat yükseklerine göre oluşturur.  Diğer gelişimlerim burada görülebilir Örneğin, Gold Stuff gibi bir eğilim göstergesiyle birlikte kullanılması önerilir; bu, trend üzerinde işlem yapmanıza ve aynı zamanda konsolidasyon veya eğilim tersine çevrilme bölgelerini belirlemenize ve destek ve direnç
Gösterge, piyasa analizi için en etkili araçlardan biri olan Fibonacci destek ve direnç seviyelerini otomatik olarak hesaplar ve çizer. Hesaplama, seçilen dönem ve zaman çerçevesi için ortalama fiyat verilerini kullanır. Bu süre için minimum ve maksimum hareketin başlangıcı ve sonu olarak alınır. Fibonacci seviyeleri, etrafında fiyat hareketinin yavaşlayabileceği veya tersine dönebileceği potansiyel referans noktalarını görmenizi sağlar, yani bunlar daha fazla hareketi tahmin etmek ve ayrıca sto
This indicator is a conventional analytical tool for tick volumes changes. It calculates tick volumes for buys and sells separately, and their delta on every bar, and displays volumes by price clusters (cells) within a specified bar (usually the latest one). The algorithm used internally is the same as in the indicator VolumeDeltaMT5 , but results are shown as cumulative volume delta bars (candlesticks). Analogous indicator for MetaTrader 4 exists - CumulativeDeltaBars . This is a limited substi
Market Profile Heat indicator  — is a classic Market Profile implementation that can show the price density over time, outlining the most important price levels, value area, and control value of a given trading session. This indicator can be attached to timeframes between M1 and D1 and will show the Market Profile for daily, weekly, monthly, or even intraday sessions. Lower timeframes offer higher precision. Higher timeframes are recommended for better visibility. It is also possible to use a f
VP hidden
Emr Aljnaby
5 (4)
The indicator works to convert normal volume into levels and determine financial liquidity control points. It is very similar in function to Fixed Volume Profile. But it is considered more accurate and easier to use than the one found on Trading View because it calculates the full trading volumes in each candle and in all the brokers present in MetaTrade, unlike what is found in Trading View, as it only measures the broker’s displayed prices. To follow us on social media platforms: tel
FREE
The balance of supply and demand is a simple and effective market analysis method. The supply and demand diagram can show you in advance, even before the trend reversal, where the supply ends and the demand is already emerging, where the demand ends and the supply is emerging, while substantially increasing the probability of making a deal in the right direction and with a high profit factor. Indicator signals The indicator uses the price/volume values to generate signals: ED – excess demand.
Initial Balance MT5
Ricardo Almeida Branco
The Initial Balance (Initial Balance / Initial Balance) is a concept related to the study of volume (to learn more, study about Market Profile and Auction Market Theory. You can find some videos in English when searching for "Initial Balance Market Profile"). The IB defines a range in which prices were negotiated in the first hour of trading.The amplitude of the range is important and the break in the range defined by the Initial Balance may have occurred due to the movement of several players
Description The indicator uses market profile theory to show the most relevant trading zones, on a daily basis. The zones to be shown are LVN (low volume nodes) and POC (point of control). An LVN zone is one which represents price areas with the least time or volume throughout the day. Typically, these areas indicate a supply or demand initiative, and in the future, they can turn into important breakout or retracement zones. A POC zone is one which represents price areas with the most time or vo
Waves PRO
Flavio Javier Jarabeck
For those who appreciate Richard Wyckoff approach for reading the markets, we at Minions Labs designed a tool derived - yes, derived, we put our own vision and sauce into this indicator - which we called Waves PRO . This indicator provides a ZigZag controlled by the market volatility (ATR) to build its legs, AND on each ZigZag leg, we present the vital data statistics about it. Simple and objective. This indicator is also derived from the great book called " The Secret Science of Price and Volum
Gösterge, tarihsel olanlarla karşılaştırılabilecek güncel teklifler oluşturur ve bu temelde bir fiyat hareketi tahmini yapar. Gösterge, istenen tarihe hızlı navigasyon için bir metin alanına sahiptir. Seçenekler: Sembol - göstergenin göstereceği sembolün seçimi; SymbolPeriod - göstergenin veri alacağı dönemin seçimi; GöstergeRenk - gösterge rengi; Ters - doğru tırnakları tersine çevirir, yanlış - orijinal görünüm; Sonraki, tarihi girebileceğiniz ve 'enter' tuşuna basa
No Demand No Supply MT5
Trade The Volume Waves Single Member P.C.
No Demand No Supply   This indicator identifies   No Demand –No Supply candles  to your chart and plots volume bars colored according to the signal. It can be applied to all timeframes or to a specific one only. It can also be used as regular volume indicator  with exceptional future of WEIGHTED VOLUME. Furthermore is has an alert notification, sound and email when a signals occurs. The indicator does not repaint but the alert will come on two candles back due to the definition of No Demand No S
Volumes Direction MT5
William Oswaldo Mayorga Urduy
HACİM YÖNÜ MT5 Normalde, mevcut ses seviyesi öncekinden daha yüksek olduğunda ses seviyesi göstergesi varsayılan bir renk değişikliğine sahiptir, bu önemlidir ancak çok kullanışlı değildir. Bu nedenle, bu gösterge, normal hacme ek olarak, mum yükseliş veya düşüş olduğunda, onları farklı bir renge boyar, varsayılan olarak yükseliş için mavi ve düşüş için kırmızıdır, ancak bu renkler özelleştirilebilir. Tüccar tadı. Ticaretinizi geliştirmenize yardımcı olacak diğer göstergelerime göz at
Trading Utility for Forex Currency Pairs Only not for Gold  Functions Auto Lot Calculation based on Risk Auto stoploss  Auto TakeProfit Breakeven Auto Close Half % Close in percentage with respect to the PIPs Pending Orders BuyLimit Sell Limit with distances BuyStop Sell Stop    with distances Trading Informations Risk in percentage For Multiple trades Combine Takeprofit and Combine Stoplosses
Mini Chart Indicators
Flavio Javier Jarabeck
The Metatrader 5 has a hidden jewel called Chart Object, mostly unknown to the common users and hidden in a sub-menu within the platform. Called Mini Chart, this object is a miniature instance of a big/normal chart that could be added/attached to any normal chart, this way the Mini Chart will be bound to the main Chart in a very minimalist way saving a precious amount of real state on your screen. If you don't know the Mini Chart, give it a try - see the video and screenshots below. This is a gr
Value Chart Candlesticks
Flavio Javier Jarabeck
4.67 (9)
The idea of a Value Chart indicator was presented in the very good book I read back in 2020 , " Dynamic Trading Indicators: Winning with Value Charts and Price Action Profile ", from the authors Mark Helweg and David Stendahl. The idea is simple and the result is pure genius: Present candlestick Price analysis in a detrended way! HOW TO READ THIS INDICATOR Look for Overbought and Oversold levels. Of course, you will need to test the settings a lot to find the "correct" one for your approach.
FREE
COSMOS4U Volume MT5
COSMOS4U - D. Vezeris & Co, L.P.
1 (1)
COSMOS4U Volume indicator facilitates your trade decisions. It gives confirmation of the running movement and market trends. It highlights current and past accumulation and distribution volumes, comparing them to moving average volume and the highest volume. In addition, it identifies and marks nuances as well as convergence and divergence patterns of bears and bulls in order to provide the market trend and price ranges. The supported features are as follows: Fast Volume Moving Average Slow Volu
Bu gösterge, filtrelenmiş fiyat bilgilerini görüntüler üç renkli histogram ve bir ortak renkli çizgi şeklinde. Bu çok renkli ve güzel bir göstergedir. Fiyat hareketinin gücünü ve yönünü belirlemek için harika. Bu göstergenin çok basit ayarları vardır: 1) göstergeyi hesaplamak için üç seçeneğin seçimi: - orijinal, - sınırlayıcı, - denge hacmi. 2) beş farklı dönem seçimi. 3) görüntülenen rengin seçimi. 4) doğruluk seçimi. ///////////////////////////////////////////////////////////////////////////
Bu ürünün alıcıları ayrıca şunları da satın alıyor
Öncelikle, bu Ticaret Sistemi'nin Non-Repainting, Non-Redrawing ve Non-Lagging Göstergesi olduğunu vurgulamak önemlidir, bu da hem manuel hem de robot ticareti için ideal hale getirir. "Smart Trend Trading System MT5", yeni ve deneyimli tüccarlar için özelleştirilmiş kapsamlı bir ticaret çözümüdür. 10'dan fazla premium göstergeyi birleştiriyor ve 7'den fazla sağlam ticaret stratejisi sunuyor, bu da çeşitli piyasa koşulları için esnek bir seçim yapar. Trend Takip Stratejisi: Trendleri etkili bir
Atomic Analyst MT5
Issam Kassas
4.27 (11)
Öncelikle belirtmek gerekir ki bu Ticaret Göstergesi Yeniden Çizim Yapmaz, Gecikmez ve Gecikme Göstermez, bu da hem manuel hem de robot ticareti için ideal hale getirir. Atom Analisti, Piyasada Daha İyi Bir Avantaj Bulmak İçin Fiyatın Gücünü ve Momentumunu Kullanan PA Fiyat Hareketi Göstergesidir. Gürültüleri ve Yanlış Sinyalleri Kaldırmaya ve Ticaret Potansiyelini Artırmaya Yardımcı Olan Gelişmiş Filtrelerle Donatılmıştır. Birden fazla katmanlı karmaşık göstergeler kullanarak, Atom Analisti
FX Volume MT5
Daniel Stein
4.94 (17)
Sabah Brifingimiz aracılığıyla ayrıntılar ve ekran görüntüleri ile günlük piyasa güncellemenizi alın burada mql5 ve on Telegram ! FX Volume, bir brokerin bakış açısından piyasa duyarlılığı hakkında GERÇEK bir fikir veren İLK ve TEK hacim göstergesidir. COT raporlarından çok daha hızlı bir şekilde, brokerlar gibi kurumsal piyasa katılımcılarının Forex piyasasında nasıl konumlandıklarına dair harika bilgiler sağlar. Bu bilgileri doğrudan grafiğinizde görmek, ticaretiniz için gerçek oyun değiştir
Quantum Trend Sniper
Bogdan Ion Puscasu
5 (37)
Tanıtım       Kuantum Trend Keskin Nişancı Göstergesi   , trend tersine dönmeleri belirleme ve ticaret yapma şeklinizi değiştiren çığır açan MQL5 Göstergesi! 13 yılı aşkın ticaret tecrübesine sahip deneyimli tüccarlardan oluşan bir ekip tarafından geliştirilmiştir.       Kuantum Trend Keskin Nişancı Göstergesi       trend dönüşlerini son derece yüksek doğrulukla belirlemenin yenilikçi yolu ile ticaret yolculuğunuzu yeni zirvelere taşımak için tasarlanmıştır. ***Kuantum Trend Keskin Nişancı Gö
Trend Screener Pro MT5
STE S.S.COMPANY
4.89 (61)
Trend Göstergesi, Trend Alım Satım ve Filtreleme için Çığır Açan Benzersiz Çözüm, Tüm Önemli Trend Özellikleriyle Tek Bir Araç İçinde Yerleştirildi! Forex, emtialar, kripto para birimleri, endeksler ve hisse senetleri gibi tüm sembollerde/araçlarda kullanılabilen %100 yeniden boyamayan çoklu zaman çerçevesi ve Çoklu para birimi göstergesidir. Trend Screener, grafikte noktalarla ok trend sinyalleri sağlayan etkili bir trend trend göstergesidir. Trend analizörü göstergesinde bulunan özellikler: 1.
RelicusRoad Pro MT5
Relicus LLC
4.82 (22)
Şimdi 147 $ (birkaç güncellemeden sonra 499 $ 'a yükseliyor) - Sınırsız Hesaplar (PC'ler veya Mac'ler) RelicusRoad Kullanım Kılavuzu + Eğitim Videoları + Özel Discord Grubuna Erişim + VIP Durumu PİYASAYA BAKMAK İÇİN YENİ BİR YOL RelicusRoad, forex, vadeli işlemler, kripto para birimleri, hisse senetleri ve endeksler için dünyanın en güçlü ticaret göstergesidir ve yatırımcılara kârlı kalmaları için ihtiyaç duydukları tüm bilgileri ve araçları sağlar. Başlangıç ​​seviyesinden ileri seviyey
Öncelikle, bu Ticaret Aracının Non-Repainting, Non-Redrawing ve Non-Lagging Gösterge olduğunu vurgulamakta fayda var, bu da onu profesyonel ticaret için ideal hale getiriyor. Akıllı Fiyat Hareketi Kavramları Göstergesi, hem yeni hem de deneyimli tüccarlar için çok güçlü bir araçtır. İleri ticaret fikirlerini, Inner Circle Trader Analizi ve Smart Money Concepts Ticaret Stratejileri gibi 20'den fazla kullanışlı göstergeyi bir araya getirerek bir araya getirir. Bu gösterge, büyük kurumların tica
Top indicator for MT5   providing accurate signals to enter a trade without repainting! It can be applied to any financial assets:   forex, cryptocurrencies, metals, stocks, indices .  Watch  the video  (6:22) with an example of processing only one signal that paid off the indicator! MT4 version is here It will provide pretty accurate trading signals and tell you when it's best to open a trade and close it. Most traders improve their trading results during the first trading week with the help of
FX Power MT5 NG
Daniel Stein
5 (4)
Sabah Brifingimiz burada mql5 ve on Telegram! FX Power MT5 NG , uzun zamandır çok popüler olan döviz gücü ölçerimiz FX Power'ın yeni neslidir. Peki bu yeni nesil güç ölçer ne sunuyor? Orijinal FX Power hakkında sevdiğiniz her şey PLUS GOLD/XAU güç analizi Daha da hassas hesaplama sonuçları Ayrı ayrı yapılandırılabilir analiz dönemleri Daha da iyi performans için özelleştirilebilir hesaplama limiti Özel çokluDaha fazlasını görmek isteyenler için örnek ayarlar Her grafikte en sevdiğiniz renkler i
Advanced Supply Demand MT5
Bernhard Schweigert
4.53 (15)
Herhangi bir Acemi veya Uzman Tüccar için En İyi Çözüm! Bu gösterge benzersiz, yüksek kaliteli ve uygun fiyatlı bir ticaret aracıdır çünkü bir dizi tescilli özelliği ve yeni bir formülü bir araya getirdik. Bu güncelleme ile çift zaman dilimi dilimlerini gösterebileceksiniz. Yalnızca daha yüksek bir TF gösteremeyeceksiniz, aynı zamanda TF grafiğini ve ARTIK daha yüksek TF'yi de gösterebileceksiniz: YUVARLAK BÖLGELERİ GÖSTERMEK. Tüm Arz Talebi tüccarları buna bayılacak. :) Önemli Bilgiler Açıkland
Auto Order Block with break of structure based on ICT and Smart Money Concepts Futures Break of Structure ( BoS )             Order block ( OB )            Higher time frame Order block / Point of Interest ( POI )    shown on current chart           Fair value Gap ( FVG ) / Imbalance   ,  MTF      ( Multi Time Frame )    Volume Imbalance     ,  MTF          vIMB Gap’s Equal High / Low’s     ,  MTF             EQH / EQL Liquidity               Current Day High / Low           HOD /
XQ Indicator MetaTrader 5
Marzena Maria Szmit
5 (1)
Step into the realm of Forex trading with confidence and precision using XQ, a cutting-edge Forex indicator designed to elevate your trading game to unprecedented heights. Whether you're a seasoned trader or just stepping into the world of currency exchange, XQ Forex Indicator empowers you with the insights and signals needed to make informed trading decisions. The signal conditions are a combination of three indicators, and XQ Forex Indicator only display  medium and long-term trends . The ind
ICT, SMC, SMART MONEY CONCEPTS, SMART MONEY, Smart Money Concept, Support and Resistance, Trend Analysis, Price Action, Market Structure, Order Blocks, BOS/CHoCH,   Breaker Blocks ,  Momentum Shift,   Supply&Demand Zone/Order Blocks , Strong Imbalance,   HH/LL/HL/LH,    Fair Value Gap, FVG,  Premium  &   Discount   Zones, Fibonacci Retracement, OTE, Buy Side Liquidity, Sell Side Liquidity, BSL/SSL Taken, Equal Highs & Lows, MTF Dashboard, Multiple Time Frame, BigBar, HTF OB, HTF Market Structure
Fiyat tersine döndükçe ve geri çekildikçe piyasa yapısından elde edilen kâr değişir. Piyasa yapısını tersine çevirme uyarısı göstergesi, bir trendin veya fiyat hareketinin ne zaman tükenmeye yaklaştığını ve tersine dönmeye hazır olduğunu tanımlar. Genellikle bir geri dönüş veya büyük bir geri çekilme meydana gelmek üzereyken meydana gelen piyasa yapısındaki değişiklikler konusunda sizi uyarır. Gösterge, olası bir tükenme noktasının yakınında her yeni yüksek veya düşük oluştuğunda, başlangıçta
Gann Kare Göstergesi, W.D. Gann tarafından yazılan "Piyasa Tahminleri için Matematiksel Formül" makalesine dayalı güçlü bir piyasa analizi aracıdır. Bu araç, piyasa analizi için matematiksel ve Gann teorilerini kullanarak hassas analizler gerçekleştirir. 144, 90, 52 karelerini ve ayrıca 9 karesini kullanır. Ayrıca, ın 9 karesi ve bu kareyle ilişkili kanallar ve yıldız modelleri için yöntemini içerir. Kullanıcı Kılavuzu ve Uygulama: Bu göstergeleri kullanmadan önce, kullanıcı kılavuzunu okumanız
AW Trend Predictor MT5
AW Trading Software Limited
4.76 (54)
Tek bir sistemde trend ve kırılma seviyelerinin kombinasyonu. Gelişmiş bir gösterge algoritması piyasa gürültüsünü filtreler, trendi, giriş noktalarını ve olası çıkış seviyelerini belirler. Gösterge sinyalleri, sinyal geçmişinin etkinliğini gösteren en uygun enstrümanların seçilmesine izin veren bir istatistiksel modüle kaydedilir. Gösterge Kâr Al ve Zararı Durdur işaretlerini hesaplar. Kılavuz ve talimatlar ->   BURAYA   / MT4 versiyonu ->   BURAYA Gösterge ile nasıl ticaret yapılır: Trend Pre
The Volume by Price Indicator for MetaTrader 5 features Volume Profile and Market Profile TPO (Time Price Opportunity). Get valuable insights out of currencies, equities and commodities data. Gain an edge trading financial markets. Volume and TPO histogram bar and line charts. Volume Footprint charts. TPO letter and block marker charts including split structures. Versatile segmentation and compositing methods. Static, dynamic and flexible ranges with relative and/or absolute visualizations. Lay
TrendLine PRO MT5
Evgenii Aksenov
4.78 (49)
The Trend Line PRO indicator is an independent trading strategy. It shows the trend change, the entry point to the transaction, as well as automatically calculates three levels of Take Profit and Stop Loss protection Trend Line PRO is perfect for all Meta Trader symbols: currencies, metals, cryptocurrencies, stocks and indices Advantages of Trend Line PRO Never redraws its signals The possibility of using it as an independent strategy It has three automatic levels Take Profit and Stop Loss lev
MetaBands M5
Vahidreza Heidar Gholami
4.67 (3)
MetaBands uses powerful and unique algorithms to draw channels and detect trends so that it can provide traders with potential points for entering and exiting trades. It’s a channel indicator plus a powerful trend indicator. It includes different types of channels which can be merged to create new channels simply by using the input parameters. MetaBands uses all types of alerts to notify users about market events. Features Supports most of the channel algorithms Powerful trend detection algorith
Tanıtım       Quantum Breakout PRO   , Breakout Bölgeleri ile ticaret yapma şeklinizi değiştiren çığır açan MQL5 Göstergesi! 13 yılı aşkın ticaret tecrübesine sahip deneyimli tüccarlardan oluşan bir ekip tarafından geliştirilmiştir.       Kuantum Breakout PRO       yenilikçi ve dinamik koparma bölgesi stratejisiyle ticaret yolculuğunuzu yeni zirvelere taşımak için tasarlanmıştır. Kuantum Breakout Göstergesi, size 5 kar hedefi bölgesi ile kırılma bölgelerinde sinyal okları ve kırılma kutusuna
Owl Smart Levels MT5
Sergey Ermolov
4.47 (36)
MT4 versiyonu  |  FAQ Owl Smart Levels Indicator , Bill Williams'ın gelişmiş fraktalları , piyasanın doğru dalga yapısını oluşturan Valable ZigZag ve kesin giriş seviyelerini gösteren Fibonacci seviyeleri gibi popüler piyasa analiz araçlarını içeren tek gösterge içinde eksiksiz bir ticaret sistemidir. pazara ve kar elde edilecek yerlere. Stratejinin ayrıntılı açıklaması Gösterge ile çalışma talimatı Baykuş Yardımcısı ticaretinde Danışman Yardımcısı Kullanıcıların özel sohbeti -> Satın aldıktan
Gartley Hunter Multi
Siarhei Vashchylka
5 (5)
Gartley Hunter Multi - An indicator for searching for harmonic patterns simultaneously on dozens of trading instruments and on all classic timeframes: (m1, m5, m15, m30, H1, H4, D1, Wk, Mn). Manual (Be sure to read before purchasing) | Version for MT4 Advantages 1. Patterns: Gartley, Butterfly, Shark, Crab. Bat, Alternate Bat, Deep Crab, Cypher 2. Simultaneous search for patterns on dozens of trading instruments and on all classic timeframes 3. Search for patterns of all possible sizes. Fr
Trend Line Map Pro MT5
STE S.S.COMPANY
4.67 (9)
Trend Line Map indicator is an addons for   Trend Screener Indicator . It's working as a scanner for all signals generated by Trend screener ( Trend Line Signals ) . It's a Trend Line Scanner based on Trend Screener Indicator.  If you don't have Trend Screener Pro Indicator,   the Trend Line Map Pro will not work.     LIMITED TIME OFFER : Trend Line Map Indicator is available for only 50 $ and lifetime. ( Original price 125$ ) By accessing to our MQL5 Blog,  you can find all our premium indica
TrendDecoder Premium MT5
Christophe, Pa Trouillas
5 (1)
Aralıkları ve bir sonraki olası hamleleri belirleyin     |    Trendlerin en erken sinyallerini ve gücünü alın     |    Geri dönüşten önce net çıkışlar alın     |    Fiyatın test edeceği Fibo seviyelerini tespit edin   |  Gecikmesiz, takip edilmeyen gösterge - manuel ve otomatik ticaret için ideal - tüm varlıklar ve tüm zaman birimleri için uygun 50 İNDİRİM   - lansman için sonra tekrar   >>   149 $ Satın aldıktan sonra, kişiselleştirilmiş ayarlar için   bu kanaldan benimle iletişime geçin . MT4
TPSpro TRENDPRO  - is a trend indicator that automatically analyzes the market and provides information about the trend and each of its changes, as well as giving signals for entering trades without redrawing! The indicator uses each candle, analyzing them separately. referring to different impulses - up or down impulse. Exact entry points into transactions for currencies, crypto, metals, stocks, indices!  -  Version MT4                  DETAILED DESCRIPTION        /       TRADING SETUPS       
Golden Spikes Detector
Batsirayi L Marango
5 (1)
Golden Spikes Detector This indicator is based on an advanced strategy primarily for trading spikes on Boom and Crash Indices. Complex algorithms were implemented to detect high probability entries only. It alerts on potential Buy and Sell entries. To trade spikes on the Deriv or Binary broker, only take Buy Boom and Sell Cash alerts. It was optimised to be loaded on 5-minute timeframe although multiple timeframe analysis is done in the background. Features ·             Desktop pop up and sound
Matrix Arrow Indicator MT5
Juvenille Emperor Limited
5 (14)
Matrix Arrow Indicator MT5 ,   forex ,   emtialar ,   kripto   para birimleri ,   endeksler ,   hisse senetleri   gibi tüm sembollerde/araçlarda kullanılabilen   %100 yeniden boyamayan   çoklu zaman çerçevesi göstergesini izleyen benzersiz bir 10'u 1 arada trenddir.  Matrix Arrow Indicator MT5 , mevcut eğilimi erken aşamalarında belirleyecek ve aşağıdakiler gibi 10'a kadar standart göstergeden bilgi ve veri toplayacaktır: Ortalama Yönlü Hareket Endeksi (ADX) Emtia Kanal Endeksi (CCI) Klasik Hei
IX Power MT5
Daniel Stein
5 (2)
IX Power   nihayet FX Power'ın rakipsiz hassasiyetini Forex dışı sembollere getiriyor. En sevdiğiniz endeksler, hisse senetleri, emtialar, ETF'ler ve hatta kripto para birimlerindeki kısa, orta ve uzun vadeli eğilimlerin yoğunluğunu doğru bir şekilde belirler. Terminalinizin sunduğu   her şeyi analiz   edebilirsiniz. Deneyin ve işlem yaparken   zamanlamanızın   nasıl   önemli ölçüde iyileştiğini   deneyimleyin. IX Power Temel Özellikler 100 hassas, yeniden boyanmayan hesaplama sonuçları -
** All Symbols x All Timeframes scan just by pressing scanner button ** ***Contact me after purchase to send you instructions and add you in "123 scanner group" for sharing or seeing experiences with other users. After 15 years of experience in the markets and 3 years of programming, Winner indicator is ready. I would like to share with you! Introduction The 123 Pattern Scanner indicator with a special enhanced algorithm is a very repetitive common pattern finder with a high success rate . Inte
Bu, zirveleri ve dipleri değerlendirmek için net bir göstergedir ve Salınımlı piyasa için iyi çalışır. Promosyon fiyatı 49$ → 59$ özellikler üstleri ve dipleri yargılamada iyi Yeniden çizme yok, sürüklenme yok Hızlı hesaplama, gecikme yok Zengin hatırlatma modu Birden fazla parametre ve renk ayarlanabilir parametre "======== Ana ========" YüksekDüşükDönem1 = 9 YüksekDüşükPeriyod2 = 60 YüksekDüşükPeriyod3 = 34 YüksekDüşükEMAPeriyodu = 4 MASignalPeriod = 5 "======== Bildir ========" UseAler
Yazarın diğer ürünleri
WAPV Full MT5
Eduardo Da Costa Custodio Santos
## WAPV Full kullanarak profesyonelce çalışın ve takip edin büyük oyuncuların parası nerede Elinizde okumayı tek başına yapan bir araç olduğunu hayal edin. en iyi ticaret bölgelerini gösteren başlıca Piyasa Oyuncuları Fiyat ve Hacim analizine dayalı. WAPV Full, eksiksiz bir araçtır ve %100 R. Wyckoff'un operasyonel özelliklerine odaklanmıştır. Ticaret dalgalarındaki piyasa hareketlerini haritalamaya ek olarak, aynı zamanda Fiyat ve Hacmi okuyarak Pazar. Profesyonel Pazar, R. Wyckoff'un 3 yasası
WAPV Box Effort x Result
Eduardo Da Costa Custodio Santos
MT5 için WA_PV_BOX_EFFORT X SONUÇ WAPV Box Effort x Result Indicator, Paket Göstergeleri grubunun (Wyckoff Academy Wave Market) bir parçasıdır. MT5 için WAPV Box Effort x Result Indicator , fiyat ve hacmi okumanıza yardımcı olur. Okuması, çaba x sonucunun tanımlanmasına yardımcı olmaktan ibarettir. grafik tarafından oluşturulan dalgalarda. Kutu yeşil olduğunda MT5 için WAPV Kutusu Eforu x Sonuç Göstergesi, hacmin talebin lehine olduğu ve kutunun kırmızı olduğu anlamına gelir hacim arzdan yana. K
HLC bar MT5 Wyckoff
Eduardo Da Costa Custodio Santos
MT5 için "HLC_bar_MT5 Wyckoff" göstergesi, işlem sırasında analizi kolaylaştırmak için oluşturulmuştur. HLC Çubuğu Richard Wyckoff tarafından kullanılmıştır ve şu anda "VSA" operasyonlarında yaygın olarak kullanılmaktadır. Wyckoff, Yüksek, Düşük ve Yakın kullanmanın grafiği çok daha temiz ve analiz etmeyi kolaylaştırdığını buldu. "HLC_bar_MT5 Wyckoff" Göstergesi şunları sağlar: # Çubuk genişliğini değiştirin; # Çubuğu aynı renkte bırakın; # Ve aynı fiyattan açılan ve kapanan çubuğu vurgulayın. R
VSA Smart Money
Eduardo Da Costa Custodio Santos
The VSA Smart Money indicator tracks the movement of professional traders, institutional trades and all compound man movements. The VSA Smart money Indicator reads bar by bar, being an excellent tool for those who use VSA, Wyckoff, PVA and Any other analysis that uses price and volume. There are 10 indications that you will find in your Chart: *On Demand *Climax *UT Thrust *Top Reversal bar *Stop Volume *No Supply *Spring *Reversal Bottom *Shakeout *Bag Holding Using this indicator you will be o
Segmented Volume MT5
Eduardo Da Costa Custodio Santos
MT5 Segmentli Hacim göstergesi , fiyat ve hacim analizi, VSA, VPA, Wyckoff Metodu ve Akıllı Para Sistemini kullanarak işlem yapanlara kolaylık sağlamak için oluşturulmuştur. Bölümlere ayrılmış hacim, herhangi bir Piyasada (Kripto, CFD, Forex, Vadeli İşlemler, Hisse Senetleri...) ve herhangi bir Grafik zamanında çalışır. Yorumunuzun ne kadar kolay olduğunu görün: #Yeşil: Hacim piyasa ortalamasının çok üzerinde #Koyu pembe: Ortalama hacimden daha büyük #Mavi: Pozitif normal hacim #Kırmızı: Negatif
Volume Zone Fractal
Eduardo Da Costa Custodio Santos
VZO Plus is an indicator that shows overbought and oversold regions based on traded volume. #When the indicator line is between -40 and -60 it is oversold #When the indicator line is between 40 and 60 it is overbought. Outside these regions, the market is following its natural path by inertia. Above the green line, it means that the market is positive, Another way to analyze the indicator is through divergence regions. When we have the bottom higher than the other in a downtrend or One botto
Jac Trend
Eduardo Da Costa Custodio Santos
MT5 için JAC Trend Göstergesi, piyasa trendinin kolay ve çevik bir şekilde tanımlanmasını kolaylaştırmak için oluşturulmuştur. # JAC Trend göstergesi yeşil olduğunda, yükseliş trendi için bir ön trendimiz var. #JAC Trend göstergesi Kırmızı olduğunda, düşüş trendi piyasası için bir ön trendimiz var. # JAC Trend göstergesi gri olduğunda, gücü olmayan bir yan pazarımız var. Bu şekilde, Piyasanın açık ve objektif bir şekilde gidebileceği tüm taraflara sahip olursunuz.
Trend Everest
Eduardo Da Costa Custodio Santos
Trend Everest MT5 göstergesi, karar vermeye yardımcı olan bir trend takip göstergesidir. Yardımcı olan ATR'nin ve ortalama gövdenin hesaplanmasına dayanır. Önemli bir konu, Trend Everest MT5 adayının yeniden boyamamasıdır, böylece daha fazla güvenle geriye dönük test yapabilirsiniz. Yeşil Yüksek Trend olduğunda Kırmızı düşüş trendi olduğunda. Piyasa fraktal olduğundan değil, bu nedenle grafik süresi ne kadar uzun olursa, iddialılık derecesi o kadar yüksek olur.
JAC Trend Color Candle
Eduardo Da Costa Custodio Santos
The indicator "JAC Trend Color Candle" for Meta Trader 5, was created to visually facilitate the trend for the trader. It is based on three parameters, which identifies the uptrend, downtrend and non-trending market. The colors are trader-configurable, and the average trader-configurable as well. trend parameters cannot be configured as they are the indicator's differential.
WAPV adh Supply and Demand
Eduardo Da Costa Custodio Santos
WAPV ADH Arz ve Talep göstergesi, (Wyckoff Academy Wave Market) adı verilen bir dizi göstergenin parçasıdır. WAPV ADH Arz ve Talep Göstergesi MT5 için alıcılar ve satıcılar arasında kazanan tarafı belirlemeyi amaçlamaktadır. Okuması çok basittir, yeşil çizgi kırmızı çizginin üzerinde olduğunda talep komuta altındadır, kırmızı çizgi yeşil çizginin üzerinde olduğunda arz komuta altındadır. Yeşil ve kırmızı çizgiler ne kadar pozitifse, hacim girişi o kadar yüksek, sıfıra veya negatife o kadar yakın
WAPV adh Supply and Demand Forex
Eduardo Da Costa Custodio Santos
WAPV ADH Arz ve Talep Forex Göstergesi, (Wyckoff Academy Wave Market) adlı bir dizi Göstergenin parçasıdır. WAPV ADH Forex Arz ve Talep Göstergesi MT5 için alıcılar ve satıcılar arasında kazanan tarafı belirlemeyi amaçlamaktadır. Okuması çok basittir, yeşil çizgi kırmızı çizginin üzerinde olduğunda talep komuta altındadır, kırmızı çizgi yeşil çizginin üzerinde olduğunda arz komuta altındadır. Yeşil ve kırmızı çizgiler ne kadar pozitifse, hacim girişi o kadar yüksek, sıfıra veya negatife o kadar
Wapv Price and volume
Eduardo Da Costa Custodio Santos
MT5 için WAPV Fiyat ve Hacim Göstergesi, (Wyckoff Academy Wave Market) ve (Wyckoff Academy Fiyat ve Hacim) araç setinin bir parçasıdır. MT5 için WAPV Fiyat ve Hacim Göstergesi, grafikteki hacim hareketini sezgisel bir şekilde görselleştirmeyi kolaylaştırmak için oluşturuldu. Bununla, piyasanın profesyonel bir ilgisinin olmadığı en yüksek hacim anlarını ve anları gözlemleyebilirsiniz. Piyasanın "akıllı para" hareketiyle değil, ataletle hareket ettiği anları belirleyin. Kullanıcı tarafından değişt
Weis Wave Double Side
Eduardo Da Costa Custodio Santos
MT5 için Weis Wave Bouble Yan Göstergesi, araç setinin bir parçasıdır (Wyckoff Academy Wave Market) MT5 için Weis Wave Bouble yan Göstergesi, David Weis tarafından oluşturulan halihazırda kurulmuş Weis Wave'e dayalı olarak oluşturulmuştur. Weis Wave Çift Taraflı göstergesi, piyasayı olduğu gibi dalgalar halinde okur 1900 yılında R. Wyckoff tarafından. Çaba x sonuç, neden ve sonuç ve arz ve talebi belirlemeye yardımcı olur. Diferansiyeli, sıfır ekseninin altında kullanılabilmesi ve daha da iyileş
Weis Wave Double Side Alert
Eduardo Da Costa Custodio Santos
MT5 için Weis Wave Bouble Yan Göstergesi, araç setinin bir parçasıdır (Wyckoff Academy Wave Market) MT5 için Weis Wave Bouble yan Göstergesi, David Weis tarafından oluşturulan halihazırda kurulmuş Weis Wave'e dayalı olarak oluşturulmuştur. Weis Wave Çift Taraflı göstergesi, R. Wyckoff'un 1900'de yaptığı gibi piyasayı dalgalar halinde okur. Çaba x sonuç, neden ve sonuç ve arz ve talebi belirlemeye yardımcı olur. Diferansiyeli, sıfır ekseninin altında kullanılabilmesi ve şunu gösteren bir koparma
VSA Candle Signal
Eduardo Da Costa Custodio Santos
MT5 için VSA Candle Signal, araç setinin (Wyckoff Academy Fiyat ve Hacim) bir parçasıdır. İşlevi, mum oluşumunda Fiyat ve Hacim ilişkisini belirlemektir. Oluşturulması, Fiyat ve Hacim analizinde bir öncü olan R.Wyckoff'un öncüllerine dayanmaktadır. MT5 için VSA Candle Signal, karar vermede yardımcı olur ve okumanızı bırakır daha net ve akıcı. Aşağıdaki resimlere bakın.
Force and Weakness Trading
Eduardo Da Costa Custodio Santos
The Force and Weakness Indicator for MT5 Forex is part of the (Wyckoff Academy Price and Volume) Toolkit The Force and Weakness Indicator for MT5 Forex was developed to identify the Strength and Weakness of volume in an accumulated way. Enabling the vision of a panorama between price and volume. The Indicator can be used as an oscillator and as a histogram. As usual it has all the premises of R. Wyckoff's three laws when put together with the price: Cause and Effect, Effort x Result and Supply a
WAPV Force and Weakness MT5
Eduardo Da Costa Custodio Santos
MT5 Real Volume için Kuvvet ve Zayıflık Göstergesi, (Wyckoff Academy Fiyat ve Hacim) araç setinin bir parçasıdır MT5 Real Volume için Kuvvet ve Zayıflık Göstergesi, hacmin Gücünü ve Zayıflığını toplu bir şekilde belirlemek için geliştirilmiştir. Fiyat ve hacim arasında bir panorama vizyonunun etkinleştirilmesi. Gösterge, bir osilatör ve bir histogram olarak kullanılabilir. Bir fantezi olarak, fiyatla bir araya getirildiğinde R. Wyckoff'un üç yasasının tüm önermelerine sahiptir: Sebep ve Etki, Ça
WAPV Weis Wave Chart Forex
Eduardo Da Costa Custodio Santos
MT5 için Weis Wave Chart Forex bir Fiyat ve Hacim göstergesidir. Fiyat ve Hacim okuması, Richard Demille Wyckoff tarafından oluşturulan üç yasaya dayalı olarak geniş çapta dağıtıldı: Arz ve Talep, Neden ve Etki ve Çabaya Karşı Sonuç. 1900'de R.Wyckoff, analizlerinde dalga grafiğini zaten kullanmıştı. Yıllar sonra, 1990 civarında, David Weis Otomatikleştirilmiş R. Wyckoff'un dalga grafiği ve bugün size David Weis'in dalga grafiğinin evrimini sunuyoruz. Varlıkta üretilen dalga ile ilgili Hacim mik
WAPV Weis Wave Chart MT5
Eduardo Da Costa Custodio Santos
MT5 için Weis Dalga Tablosu bir Fiyat ve Hacim göstergesidir. Fiyat ve Hacim okuması, Richard Demille Wyckoff tarafından oluşturulan üç yasaya dayalı olarak geniş çapta dağıtıldı: Arz ve Talep, Neden ve Etki ve Çabaya Karşı Sonuç. 1900'de R.Wyckoff, analizlerinde dalga grafiğini zaten kullanmıştı. Yıllar sonra, 1990 civarında, David Weis Otomatikleştirilmiş R. Wyckoff'un dalga grafiği ve bugün size David Weis'in dalga grafiğinin evrimini sunuyoruz. Varlıkta üretilen dalga ile ilgili Hacim miktar
WA Order Block FVG bos MT5
Eduardo Da Costa Custodio Santos
O  WA Order Block FVG bos MT5  é um indicador com base no estudo de SMC (Smart Money Concepts) criado pelo ICT Inner Circle Trader, eleplota no seu gráfico as informações de Order Blocks em 3 tempos gráficos diferentes, fair Value Gaps e Regiões de Liquidez além do BOS ( Break os Structures), tudo em um só indicador. Dessa forma você não precisa colocar essas informações de forma manual. Agora você tem tudo isso de forma automática em seu gráfico.
Filtrele:
İnceleme yok
İncelemeye yanıt