Round Price Levels MT5
- Göstergeler
- Robert Gerald Wood
- Sürüm: 1.0
- Etkinleştirmeler: 5
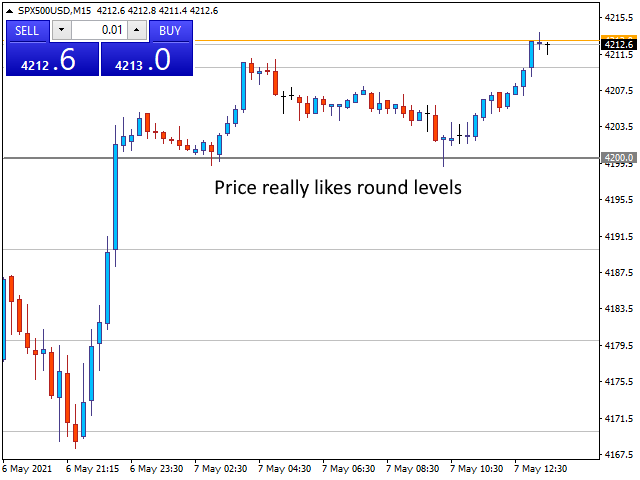
Piyasalar yuvarlak rakamları gerçekten sever ve genellikle düşen bir piyasada destek veya fiyat yükselirken direnç olarak hareket ederler.
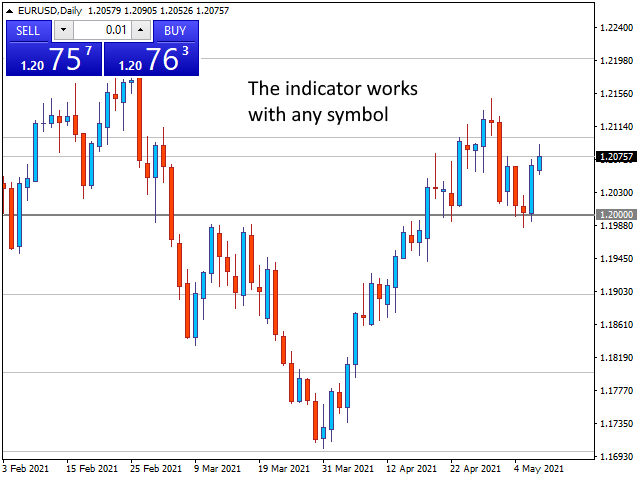
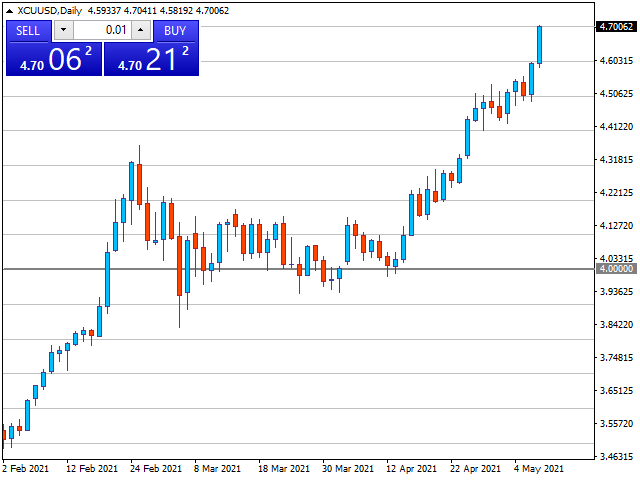
Bu gösterge, Yuvarlak değerlerde fiyat seviyeleri çizmek için tasarlanmıştır. Bunu otomatik olarak yapar, ancak bunu geçersiz kılma ve görmek istediğiniz seviyeleri belirleme seçeneğiniz de vardır.
Yuvarlak bir seviye 10'luk adımlar kadar basit olabilir, yani 10, 20, 30 vb.
Gösterge, her biri farklı formatta olan Major ve Minor olmak üzere iki sınıf çizgi çizer. Bu, seviyedeki iki farklı değişiklik arasındaki değişiklikleri aynı anda görmenizi sağlar.
uyarı
Gösterge, fiyat yapılandırılabilir bir mesafeye geldiğinde Major, Minor veya her iki fiyat seviyesinde sesli uyarı verme özelliğini içerir.
Otomatik Kurulum
Varsayılan olarak, gösterge hem Majör hem de Minör fiyatlar için uygun bir seviye belirleyecektir. Bunu, herhangi bir zamanda ekranda kaç satır görmek istediğinizi kontrol eden yapılandırılabilir bir DensityIndex ayarı kullanarak yapar.
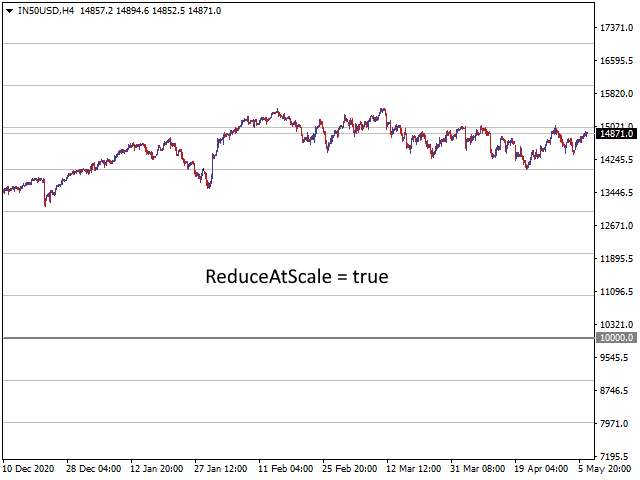
MajorGap ve MinorGap ayarlarını kullanarak kendi ölçeklemenizi ayarlarsanız, ReduceAtScale ayarını kullanarak ekranda çizilen çizgilerin sayısını sınırlamak için göstergeyi almaya devam edebilirsiniz.
Bu özellik hakkında daha net bir fikir edinmek için lütfen ekran görüntülerine bakın.
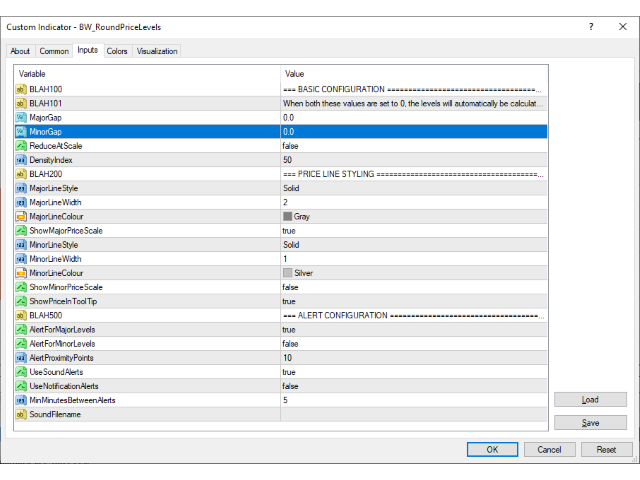
AYARLAR
TEMEL YAPILANDIRMA
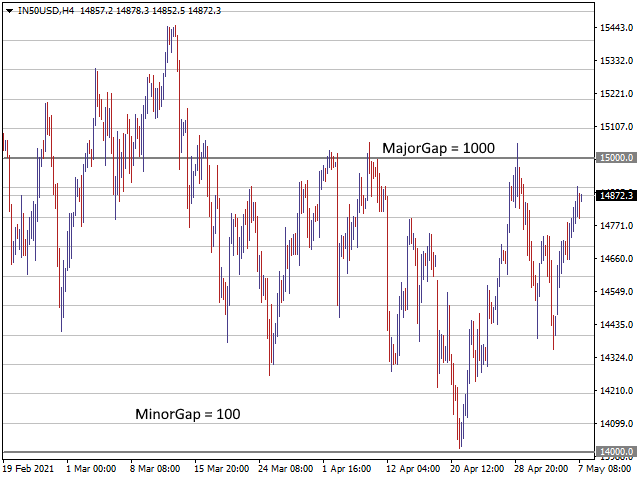
Büyük Boşluk
0.0 olarak ayarlandığında, gösterge otomatik olarak uygun bir ölçek hesaplayacaktır.
Küçük Boşluk
0.0 olarak ayarlandığında, gösterge otomatik olarak uygun bir ölçek hesaplayacaktır.
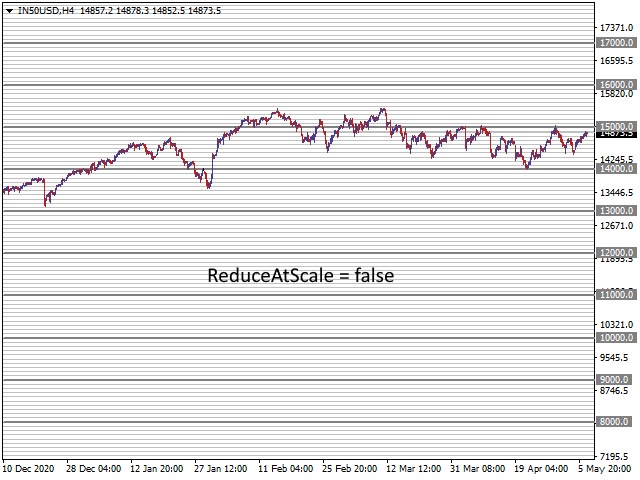
Ölçekte Küçültme
Doğru olduğunda, gösterge grafiğin ölçeğini hesaba katacak ve gerekirse çizilen seviye sayısını azaltacaktır.
Yoğunluk Endeksi
Otomatik olarak küçültmeden önce maksimum Küçük değer sayısı.
FİYAT ÇİZGİSİ STİLİ
Ana Çizgi Stili
Çizilecek çizgi stili, düz, noktalı, kesikli. Sistem tarafından desteklenen değerler listesinden seçim yapın.
Ana Çizgi Genişliği
Çizilecek çizginin genişliği. SOLID dışında bir stil kullanmak isterseniz, bu değer 1'e eşit olmalıdır.
Ana ÇizgiRengi
Çizgiyi çizecek renk.
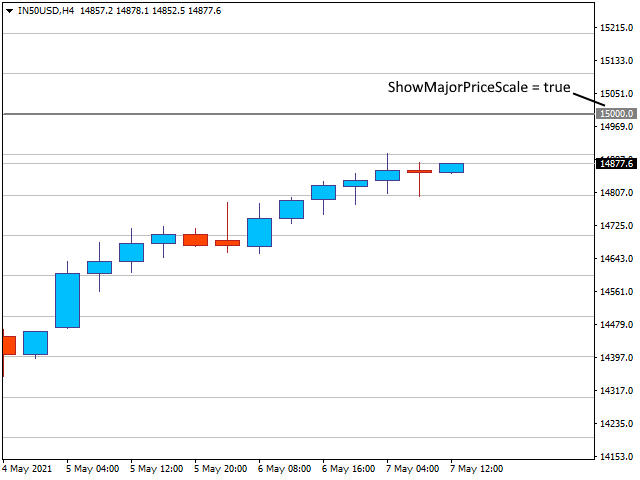
Ana Fiyat Ölçeğini Göster
Doğru olduğunda, Ana fiyat seviyeleri grafiğin sağındaki fiyat ölçeğinde vurgulanacaktır.
Küçük Çizgi Stili
Çizilecek çizgi stili, düz, noktalı, kesikli. Sistem tarafından desteklenen değerler listesinden seçim yapın.
Küçük Satır Genişliği
Çizilecek çizginin genişliği. SOLID dışında bir stil kullanmak isterseniz, bu değer 1'e eşit olmalıdır.
Küçük ÇizgiRengi
Çizgiyi çizecek renk.
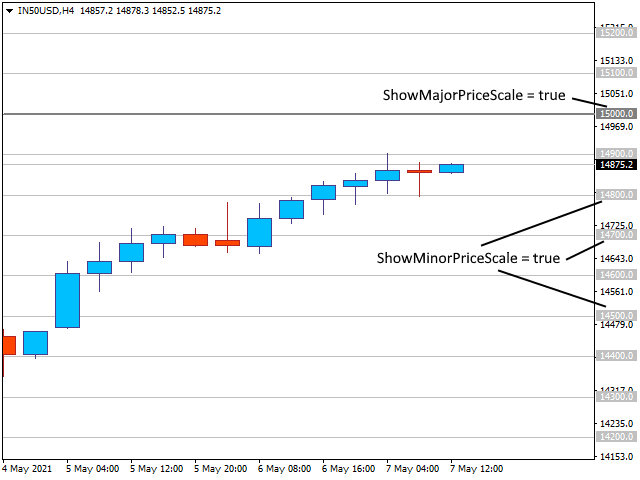
Küçük Fiyat Ölçeğini Göster
Doğru olduğunda, Küçük fiyat seviyeleri grafiğin sağındaki fiyat ölçeğinde vurgulanacaktır.
FiyatInToolIpucunu Göster
Doğru olduğunda, fare imleci üzerine geldiğinde satırın fiyat değeri bir araç ipucu olarak gösterilecektir. Fiyat ölçeklerini kapattıysanız kullanışlıdır.
UYARI YAPILANDIRMASI
AlertForMajorLevels
Doğru olduğunda, Ana fiyat seviyelerine yakın fiyat uyarıları verir
Küçük Düzeyler İçin Uyarı
Doğru olduğunda, Küçük fiyat seviyelerine yakın fiyat uyarıları verir
UyarıYakınlıkPuanları
Bir uyarıyı tetiklemek için mevcut fiyatın bir seviyeye ne kadar yakın olması gerektiği. Mevcut fiyat bir seviyenin AlertProximityPoints puanı içindeyse uyarı verilir.
Ses Uyarılarını Kullan
Bir uyarı tetiklendiğinde bir ses çıkarın.
Kullanım Bildirimi Uyarıları
Bir uyarı tetiklendiğinde MT4 bildirim sistemini kullanarak bir bildirim gönderin. Araçlar > Seçenekler ana menüsüne bakın, ardından Bildirimler sekmesini seçin ve orada ayarlayın. Ayrıca Apple veya Android uygulamasına da ihtiyacınız olacak.
Uyarılar Arasında DakikaDakika
Bir uyarıyı tetikledikten sonra, sistem başka bir uyarının tetiklenmesine izin vermeden önce bu kadar dakika bekler.
Ses Dosyası adı
Yerleşik bir uyarı sesi vardır, ancak farklı bir ses kullanmak isterseniz, dosya adını burada belirtebilirsiniz. Dosyalar terminal MQL/Files klasöründe olmalıdır.