• Genel bakış
  • İncelemeler (1)
  • Yorumlar (1)
  • Yenilikler

Pivot Lines

5

Description

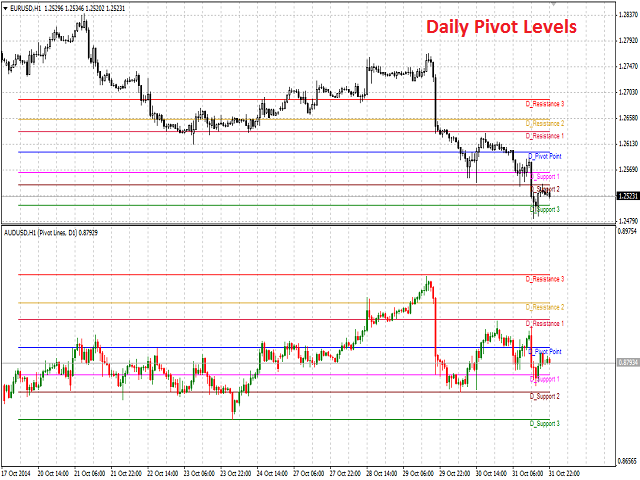
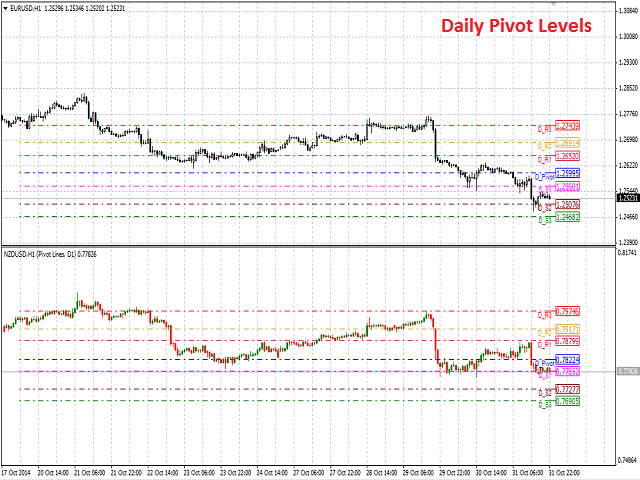
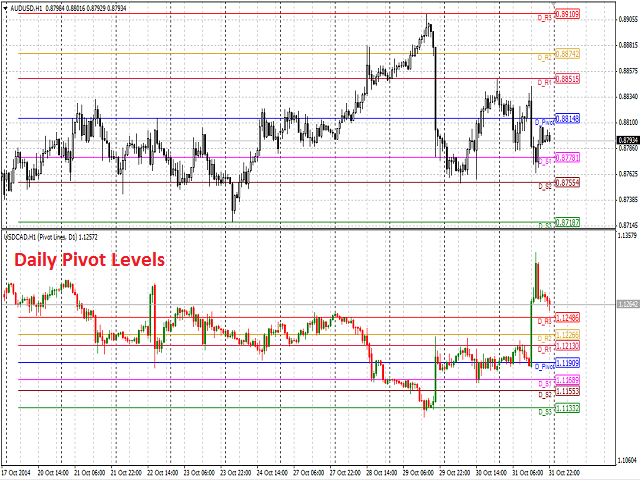
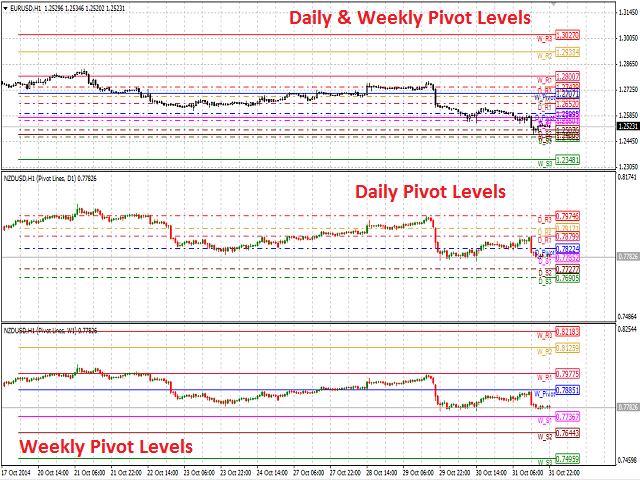
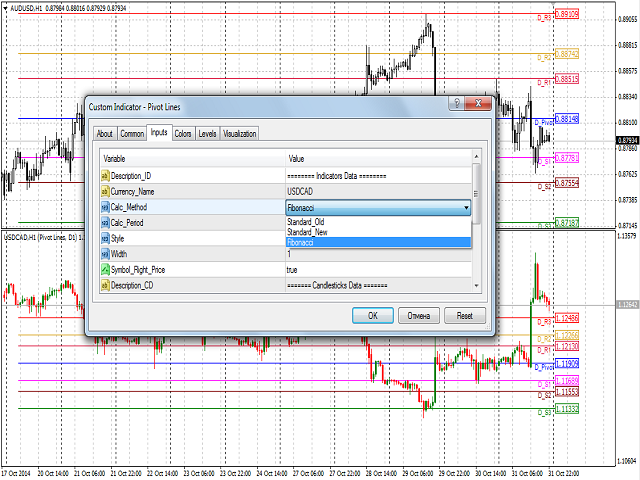
Pivot Lines is a universal color multicurrency/multisymbol indicator of the Pivot Points levels systems. You can select one of its three versions: Standard Old, Standard New and Fibo. It plots pivot levels for financial instruments in both windows simultaneously.

The system will automatically calculate the Pivot Point on the basis of market data for the previous day (PERIOD_D1) or week (PERIOD_W1) and the system of support and resistance levels, three in each. It can also display price tags for each level.

You can color the indicator lines.

The only difference between Standard New and Standard Old version is the method of calculation of the third level of support (S3) and resistance (R3).


Inputs

  1. Currency_Name - the name of the financial instrument.
  2. Calc_Method - the Pivot Points calculation method:
    • Standard Old.
    • Standard New.
    • Fibonacci.
  3. Calc_Period - the Pivot Points calculation method:
    • Daily.
    • Weekly.
  4. Style - style of the line:
    • solid line (by default).
    • dashed line.
    • dotted line.
    • dashed and dotted line.
    • dashed and double dotted line.
  5. Width - width of the line (allowable values - 1, 2, 3, 4 and 5).
  6. Symbol_Right_Price - permission to display price tags.
  7. Bars_Number - the number of bars to be displayed in a separate window.
  8. Bars_Flag - a flag to allow display of the number of bars specified in the Bars_Number parameter:
    1. true - according to Bars_Number.
    2. false - maximum available bars in the history.
  9. Bulls_Color - the color of the bullish candlestick.
  10. Bears_Color - the color of the bearish candlestick.
  11. Bid_Line_Color - color of the Bid line.


Purpose

The indicator can be used for manual or automated trading in an Expert Advisor. Values of indicator buffers of the double type can be used for automated trading:

  1. Main Window:
    • Pivot Point - buffer 0.
    • Support level 1 - buffer 1.
    • Support level 2 - buffer 2.
    • Support level 3 - buffer 3.
    • Resistance level 1 - buffer 4.
    • Resistance level 2 - buffer 5.
    • Resistance level 3 - buffer 6.
  2. Separate Window:
    • Pivot Point - buffer 8.
    • Support level 1 - buffer 9.
    • Support level 2 - buffer 10.
    • Support level 3 - buffer 11.
    • Resistance level 1 - buffer 12.
    • Resistance level 2 - buffer 13.
    • Resistance level 3 - buffer 14.

Depending on the timeframe of the chart, on which the indicator is used, values of the indicator buffers towards the depth of the history should be requested with a shift relative to the zero bar and the same step on the following principle:

  1. Calc_Period - Daily:
    • PERIOD_M1: the shift and the step = 1 440.
    • PERIOD_M5: the shift and the step = 288.
    • PERIOD_M15: the shift and the step = 96.
    • PERIOD_M30: the shift and the step = 48.
    • PERIOD_H1: the shift and the step = 24.
    • PERIOD_H4: the shift and the step = 6.
    • PERIOD_D1: the shift and the step = 1.
  2. Calc_Period - Weekly:
    • PERIOD_M1: the shift and the step = 7 200.
    • PERIOD_M5: the shift and the step = 1 440.
    • PERIOD_M15: the shift and the step = 480.
    • PERIOD_M30: the shift and the step = 240.
    • PERIOD_H1: the shift and the step = 120.
    • PERIOD_H4: the shift and the step = 30.
    • PERIOD_D1: the shift and the step = 5.
    • PERIOD_W1: the shift and the step = 1.


Limitations

Chart for each financial instrument cannot be displayed in a separate window more than twice. Otherwise, you receive an error message related to its re-use and will be offered to select another financial instrument.


Recommendations

It is recommended to use the indicator with Bars_Number parameter not exceeding the number of bars that can be shown in one window (about 250 bars).


Notes

In case of loss of connection with the trading server, when connection is restored and data is downloaded, the chart will be redrawn from the beginning to the number of bars specified by Bars_Number and Bars_Flag.

İncelemeler 1
pnutfx503
1524
pnutfx503 2017.04.27 07:36 
 

Great service everyone shoud be using pivots

Önerilen ürünler
Description  Fibo Retracement  is an indicator that automatically plots  Fibonacci  levels in the main chart based on Close prices , which distinguishes it from the Fibo Levels indicator that plots levels based on High/Low prices. Thus, using both indicators provides the trader with the opportunity of determining support and resistance zones by Fibonacci! The levels are calculated and plotted over a certain interval using the number of bars specified by the user. The user can display Fibonacci l
The Find Levels utility scans the range of prices and bars indicated by you on the chart, finds the levels most often related to High and Low prices and provides a full report. The color of the level line depends on the number of touches and changes in the program settings. The level is drawn in the event that if the shadow of the High or Low candle was at least two touches during the period specified in the parameters. The characteristics of the candle, namely, what should be its parameters for
Description  Fibo Levels  is an indicator that automatically plots  Fibonacci  levels. The levels are calculated and plotted    over a certain interval using the number of bars specified by the user . When the price achieve one of the target levels (23.6%, 38.2%, 50% or 61.8%) the indicator at the request of the user gives a sound signal and/or sends the message by e-mail. Example of the e-mail notification: Subject:  Fibo Up Signal Message:  Signal,H1 - Correction of EURUSD reached 23.6% - 2014
Bu gösterge bir daire algılar ve bulunan alanı renkli bir dikdörtgenle boyar. Bu göstergenin ana fikri, fiyat grafikteki belirli bir alanı doldururken bir daireyi tespit etmektir. Giriş parametreleri: Color rectangle - gölgelenecek dikdörtgenin rengi. Bars in rectangle  - bir dikdörtgende izin verilen minimum çubuk sayısı. Density in % - dikdörtgen alanının yüzdesi olarak ayarlanan dairenin yoğunluğu.
Dear Trader It is my pleasure to introduce to you my tool called the " Forex Sniper Indicator" . The major aim of this tool is to help serious traders and investors in all type of Financial Markets to catch price next movement right at the moment the price direction is about to change. This tool can be used to snipe the price direction in both down trend, uptrend and ranging markets. This tool can be used as the stand alone tool though it may be combined with other tools as well. My goal is to h
Gösterge, piyasa analizi için en etkili araçlardan biri olan Fibonacci destek ve direnç seviyelerini otomatik olarak hesaplar ve çizer. Hesaplama, seçilen dönem ve zaman çerçevesi için ortalama fiyat verilerini kullanır. Bu süre için minimum ve maksimum hareketin başlangıcı ve sonu olarak alınır. Fibonacci seviyeleri, etrafında fiyat hareketinin yavaşlayabileceği veya tersine dönebileceği potansiyel referans noktalarını görmenizi sağlar, yani bunlar daha fazla hareketi tahmin etmek ve ayrıca sto
MetaTrader 4'te Nasdaq 100 piyasasında gezinen yatırımcılar için vazgeçilmez bir yardımcı olan NAS100 Auto SL ve TP Maker ile StopLoss ve TakeProfit ayarlarını bir daha asla kaçırmayın. Bu araç, StopLoss ve TakeProfit seviyelerinin yönetimini otomatikleştirmek için sorunsuz bir çözüm arayanlar için tasarlanmıştır. Temel Özellikler: Zahmetsiz Otomasyon: StopLoss ve/veya TakeProfit olmadan Nasdaq 100 işlemlerini otomatik olarak izler. Kullanıcı tarafından yapılandırılan ayarlara göre seviyeleri d
SR levels true mql4
Egidijus Bikulcius
5 (1)
Indicator SR levels true in small time frames is very useful for scalping while in bigger ones it is good for day or position trading. SR levels true can draw 4 support/resistance levels based on defined maximum rebouds from price level. Indicator scans  defined number of bars in time axis and defined number of pips in price axis (both sides - up and down) and calculates how much times price was rejected from scanned price levels. At the price levels where maximum rebounds are counted, support
FREE
The PUA MultiType Pivot indicator is built on the daily chart of the previous day. The PUA MultiType Pivot indicator is one of the most popular tools in technical analysis, used by traders to identify potential reversal points in financial markets. This indicator constructs three types of Pivot points: Classic, Fibonacci, and Camarilla, each offering its unique approach to market analysis. The advantages of this indicator include: Simplicity and Clarity PUA MultiType Pivot provides clearly defi
UPD1 Pivot Levels
Vitaliy Kuznetsov
5 (3)
Gösterge, grafik üzerinde bir önceki güne göre hesaplanan klasik pivot seviyelerini gösterir. Formülün hangi saatten itibaren hesaplanacağını seçebilirsiniz. Tersine çevirmek için düz bir piyasada işlem yapın. Trend olan bir piyasada bunları hedef olarak kullanın. Başarılı ticaret için stratejilerinizle birleştirin. Seviyeler tamponlar kullanılarak oluşturulur ve mevcut tüm teklif geçmişinde görüntülenir. Giriş parametreleri. Start Hour - günün başlangıcının hangi saatten itibaren dikkate a
FREE
Gestor de SL y TP
Alvaro Alfonso Rodriguez
5 (1)
La herramienta "Gestión de SL y TP" es una solución diseñada para ayudar a los traders manuales en la colocación eficiente del stop loss y take profit en sus operaciones abiertas en el mercado. Con esta herramienta, los traders pueden establecer fácilmente los valores en pips para el stop loss y take profit directamente desde el panel gráfico.  En el primer edits se colocaran los pips de Stop Loss que quiera el trader para sus operaciones y en el segundo edit colocará los pips de Take Profit. Un
F ully automated Expert Advisor using the  advanced   algorithm for trading the EURUSD Designed for profit in a short period of time and big profit in a long run. Prefers EURUSD 1H. Principle of operation The SELL and BUY orders are opened (depending on the parameters set), guided by signals and the market situation.     Recommended parameter: Use an ECN broker account. minimum deposit of 100$ USD. use it in H1 time frame recommended symbol is EURUSD input parameter: TrendType               
Olimpia Dragged Trends! This dashboard indicator is a visual tool which recognizes dragged trends of 28 pairs in a easy-to-read histogram. You will see a group of squares indicating the sum and average values of trends of the last "...." minutes for each square from L to A in a dragged way. "Dragged Way" means that regardless the hour of the day or opened or closed candle it always shows the present and the pastinformation. You can configure a sequence of numbers with values between 1 minute to
We found the solution for you. It is a script that allows you to automatically close all your positions that you have improved. To close a position, you must type "Close position" from its context menu in the "Trade" tab. In the window that appears, you must also type "Ask". Then the "Close" button appears in the window. When you press this button, the position is fully closed at the asking price. Please note that the Close button will also remain displayed for a few seconds, while the trader n
Description DealsCopyMaster opens additional positions on a single symbol in the appropriate amount and tracks them automatically. Opening additional positions may be necessary in case a subscriber starts to lag behind the provider dramatically in the volumes of the currently opened positions and in the volumes difference when provider's balance was at some moment of time equal to the current subscriber's one. In multicurrency/multisymbol mode, the EA is attached to the chart of each financial i
PZ Support Resistance
PZ TRADING SLU
3.33 (3)
Tired of plotting support and resistance lines? This is a multi-timeframe indicator that detects and plots supports and resistance lines in the chart with the same precision as a human eye would. As price levels are tested over time and its importance increases, the lines become thicker and darker, making price leves easy to glance and evaluate. [ Installation Guide | Update Guide | Troubleshooting | FAQ | All Products ] Boost your technical analysis Customizable timeframe selection Read pri
Fibonacci retracements can be used to draw support lines, identify resistance levels, place stop-loss orders and set target prices. The Advanced Automatic Fibonacci retracements draws automatically all the levels. You have a lot of options to choose. For exemple you can use the tracements of another time frame (MTF) in the current chart, you can also choose between the closest level or less close to draw the retracements. You can also add 2 levels of your choice. You can add levels extensions o
The Wing Patterns indicator scans for many different kinds of Patterns using an XABCD structure. The term Wing Pattern is used to refer to all types of patterns based on a general XABCD structure, which is plotted in an alternate high-low extreme form. In other words, assume that point X is started at a low point on the chart. The point A is plotted at the next highest point within a certain number of bars. This certain number of bars is called the depth level. In this example, point B would be
The Time Line Auto Close (TLAC) Advisor will allow you to create vertical lines (Time Lines) that will automatically close all or some of your open orders. You can create and manage several lines, set up closed orders and alerts for each of them. Orders can be filtered by currency, magic number, order number and order type. You can also configure notifications to be sent before lines are activated. How does it work? With TLAC you will be able to manage timelines through a graphical interface s
FREE
MACD Decision Tree
Thomas Bradley Butler
This indicator was constructed using decision trees.  I will only give a few insights into the algorithm since it is original. But there are 4 trees in the inputs and by default they are 10. The decision tree logic for buy signals is as follows: If the MACD line is less than  certain bullish divergence (determined by the "BUY_TREE_1" and "BUY_TREE_2" variables) The decision tree logic for sell signals is as follows: If the MACD line is greater than certain bearish divergence  (determined by the
The   Five Minutes Strategy   EA is designed for trading binary options. EURUSD on the five-minute period is strongly recommended. Trading is performed by the opening prices based on the signals of the   Five Minutes   indicator. It requires at least 100 bars in history to operate. Input Parameters Initial Deposit - initial deposit. Lot Value - lot size. Lot Type - lot type: Fixed - fixed. Variable - variable. Last Lot Value - last lot value (used in cases when the EA is reattached) Day lot ty
Pivot System
Igor Semyonov
4 (1)
Description Pivot System  is a universal color multicurrency/multisymbol indicator of the  Pivot Points  levels systems. You can select one of its three versions:  Standard   Old ,  Standard New  and  Fibo . It plots pivot levels in a separate window. The system will automatically calculate the  Pivot Point  on the basis of market data for the previous day ( PERIOD_D1 ) and the system of support and resistance levels, three in each. It can also display price tags for each level. You can color t
Utility for automatic setting of stop loss and take profit levels. Created by a professional trader for traders.   The utility   works with any market orders opened by a trader manually or using advisors. Can filter trades by magic number. The utility can work with any number of orders simultaneously. MT5 version  https://www.mql5.com/ru/market/product/56486 WHAT THE UTILITY CAN DO: set virtual stop loss and take profit from 1 pip real   stop loss and take profit work with each order separately
Description Pivot Pro  is a universal color indicator of the  Pivot Points  levels systems. You can select one of its three versions:  Standard   Old , Standard New  and  Fibo . The system will automatically calculate the  Pivot Point  on the basis of market data for the previous day ( PERIOD_D1 ) and the system of support and resistance levels, three in each. It can also display price tags for each level. You can color the indicator lines. Only a method of calculation of the third level of supp
Reversal Monster Mini
Abdulfattah Yahya Mohammed Alhazmi
The Most advanced and comprehensive EA to trade Trend Reversals/Pullbacks It is a very profitable EA, to trade trends breakout, and manage trades, takeprofit, stoploss, move to breakeven, and trailing stop. The   “Reversal Monster EA”   trades Reversal/Pullbacks when the current price of the pair pullback to a predefined horizontal level or trendline on the currency chart. The opening of the position can be immediate after pullback to the drawn trendline or after closing the candle below/abov
FREE
TPOChart2
Ahmad Yani
3.5 (4)
Features Supports the creation of Monthly, Weekly, Daily, 4 Hours, 1 Hours and 30 Minutes Market Profile. Daily Profile can have custom start time. Merge and Split of Market Profile Market Profile References Point can be exported to CSV format for any further analysis. Indicator Parameters Indicator Update Interval - Choose indicator calculation period from 250 milliseconds to 2.5 seconds Indicator Setting ID - An ID for this particular indicator setting. Profile Number - The Number of Market
If you found this EA, it's probably because you want to get a funded account with a prop firm, but you see a rule that most of traders fear :   Maximum Daily Drawdown.  I've been through this problem myself as   I'm a prop firm trader   and I've made a bot to solve this rule, and you can get it to solve this problem too. How does it work ? When you first setup this EA, you need to input the   initial deposit   which corresponds to the size of your funded account. For exemple if you get a 10k$
Trend Ray
Andriy Sydoruk
The indicator shows the potential trend direction by cyclical-wave dependence. Thus, all the rays of the intersection will be optimal rays, in the direction of which the price is expected to move, taking into account the indicator period. Rays can be used as a direction for potential market movement. But we must not forget that the approach must be comprehensive, the indicator signals require additional information to enter the market.
Gösterge, tarihsel olanlarla karşılaştırılabilecek güncel teklifler oluşturur ve bu temelde bir fiyat hareketi tahmini yapar. Gösterge, istenen tarihe hızlı navigasyon için bir metin alanına sahiptir. Seçenekler: Sembol - göstergenin göstereceği sembolün seçimi; SymbolPeriod - göstergenin veri alacağı dönemin seçimi; GöstergeRenk - gösterge rengi; Ters - doğru tırnakları tersine çevirir, yanlış - orijinal görünüm; Sonraki, tarihi girebileceğiniz ve 'enter' tuşuna basa
Like you when I first started trading, It was overwhelming...learning about indicators, about lotsize, leverage and many more things. Its been almost 3 years. I am more knowledgeable in trading. My trading continues to improve as I work on my strategy, technical analysis, trading psychology and trade management. One thing I am not worried about though is being able to close my trades quicky if a trade goes against me or if the trade has reached my take profit level with the help of my Close Tr
Bu ürünün alıcıları ayrıca şunları da satın alıyor
Trade Assistant MT4
Evgeniy Kravchenko
4.45 (183)
It helps to calculate the risk per trade, the easy installation of a new order, order management with partial closing functions, trailing stop of 7 types and other useful functions. Attention, the application does not work in the strategy tester. Manual, Description, Download demo Line function -   shows on the chart the Opening line, Stop Loss, Take Profit. With this function it is easy to set a new order and see its additional characteristics before opening.   Risk management  - The risk
Local Trade Copier EA MT4
Juvenille Emperor Limited
5 (82)
Local Trade Copier EA MT4 ile olağanüstü hızlı işlem kopyalama deneyimi yaşayın. Kolay 1 dakikalık kurulumuyla bu işlem kopyalayıcısı, aynı Windows bilgisayarda veya Windows VPS'te birden fazla MetaTrader terminali arasında işlemleri kopyalamanıza olanak tanır ve 0.5 saniyenin altındaki şimşek hızında kopyalama hızları sunar. Başlangıç seviyesinde veya profesyonel bir tüccar olsanız da, Local Trade Copier EA MT4 , spesifik ihtiyaçlarınıza göre özelleştirmek için geniş bir seçenek yelpazesi sunar
Fiyatın saniyeler içinde değiştiği finansal piyasalarda emirleri vermekte aynı şekilde kolay olması gerektiğini düşünüyor musunuz? Metatrader programında her emir açmak istediğinizde emir fiyatını, zararı durdur emrini, kar al emrini ve işlem hacmini gireceğini pencereyi açmak zorundasınız. Finansal marketlerde işlem yaparken sermaye yönetimi sermayenizi doğru yönetmek için çok önemlidir. Bunun için işlem açmadan önce doğru işlem hacmini hesaplamanız gerekir.  Bu hesaplamaları sizin için yapabil
Exp COPYLOT CLIENT for MT4
Vladislav Andruschenko
4.66 (68)
MetaTrader 4 için ticaret fotokopisi.       Herhangi bir hesaptan forex işlemlerini, pozisyonlarını, emirlerini kopyalar. En iyi ticari fotokopi makinelerinden biridir.       MT4 - MT4, MT5 - MT4       için       KOPYLOT MT4       sürüm (veya       MT4 - MT5 MT5 - MT5       için       KOPYLOT MT5       sürüm). MT5 sürümü Tam tanım   +DEMO +PDF Nasıl alınır Nasıl kurulur     Günlük Dosyaları nasıl alınır?     Nasıl Test Edilir ve Optimize Edilir     Expforex'in tüm ürünleri için fotokopi  
Tired of complex order placement and manual calculations? Trade Dashboard is your solution. With its user-friendly interface, placing orders becomes effortless, by a single click, you can open trades, set stop loss and take profit levels, manage trade lot size, and calculate risk to reward ratios, allowing you to only focus on your strategy. Say goodbye to manual calculations and streamline your trading experience with Trade Dashboard. Download   demo version  right now. You can find details
MT4 to Telegram Signal Provider , Telegram'a sinyal göndermeyi sağlayan ve hesabınızı bir sinyal sağlayıcısına dönüştüren kullanımı kolay ve tamamen özelleştirilebilir bir araçtır. Mesajların formatı tamamen özelleştirilebilir! Ancak basit kullanım için, önceden tanımlanmış bir şablonu seçebilir ve mesajın belirli kısımlarını etkinleştirebilir veya devre dışı bırakabilirsiniz. [ Demo ]  [ Kullanım Kılavuzu ] [ MT5 Sürümü ] [ Discord Sürümü ] [ Telegram Kanalı ] Kurulum Adım adım bir kullanıcı
The product will copy all telegram signal to MT4   ( which you are member  ) , also it can work as remote copier.  Easy to set up, copy order instant, can work with almost signal formats, image signal, s upport to translate other language to English Work with all type of channel or group, even channel have "Restrict Saving Content", work with  multi channel, multi MT5 Work as remote copier: with signal have ticket number, it will copy exactly via ticket number. Support to backtest signal. How to
Trade copier MT4
Alfiya Fazylova
4.68 (31)
Trade Copier, ticaret hesapları arasındaki işlemleri kopyalamak ve senkronize etmek için tasarlanmış profesyonel bir yardımcı programdır. Kopyalama, tedarikçinin hesabından/terminalinden alıcının aynı bilgisayarda veya vps'de kurulu olan hesabına/terminaline gerçekleşir. Satın almadan önce demo sürümünü bir demo hesabında test edebilirsiniz. Demo versiyonu burada . Tüm talimatlar burada . Ana işlevler ve avantajlar: Emirlerin kopyalanmasını destekler: МТ4> МТ4, МТ4> МТ5, МТ5> МТ4. Emirlerin kopy
FREE SIGNAL CHANEL:  https://t.me/redfox_daily_forex_signals Time saving and fast execution Whether you’re traveling or sleeping, always know that Telegram To Mt4 performs the trades for you. In other words, Our   Telegram MT4 Signal Trader  will analyze the trading signals you receive on your selected Telegram channels and execute them to your Telegram to MT4 account. Reduce The Risk Telegram To Mt4   defines the whole experience of copying signals from   Telegram signal copier to mt4  p
Riskinizi otomatik olarak hesaplarken işlemlere hızlı bir şekilde girip çıkmanıza yardımcı olacak Ticaret Yöneticisi. Aşırı Ticaret, İntikam Ticareti ve Duygusal Ticaretten korunmanıza yardımcı olacak özellikler içerir. İşlemler otomatik olarak yönetilebilir ve hesap performans ölçümleri bir grafikte görselleştirilebilir. Bu özellikler, bu paneli tüm manuel yatırımcılar için ideal kılar ve MetaTrader 4 platformunun geliştirilmesine yardımcı olur. Çoklu Dil desteği. MT5 Sürümü  |  Kullanım Kılavu
Bu ürün, haber saatlerinde tüm uzman danışmanları ve manüel grafikleri filtreler, böylece manüel ticaret kurulumlarınızı veya diğer uzman danışmanlar tarafından girilen işlemleri yok edebilecek ani fiyat dalgalanmaları konusunda endişelenmenize gerek kalmaz. Bu ürün, herhangi bir haber yayınlanmadan önce açık pozisyonlarınızı ve bekleyen emirlerinizi yönetebilen tam bir sipariş yönetim sistemi ile birlikte gelir. The News Filter'ı satın aldığınızda, gelecekteki uzman danışmanlar için yerleşik ha
Üye olduğunuz herhangi bir kanaldan (özel ve kısıtlı olanlar dahil) sinyalleri doğrudan MT4'ünüze kopyalayın.  Bu araç, kullanıcıyı göz önünde bulundurarak tasarlanmış olup işlemleri yönetmek ve izlemek için ihtiyacınız olan birçok özelliği sunar. Bu ürün, kullanıcı dostu ve görsel olarak çekici bir grafik arayüzünde sunulmaktadır. Ayarlarınızı özelleştirin ve ürünü birkaç dakika içinde kullanmaya başlayın! Kullanıcı Kılavuzu + Demo  | MT5 Sürümü | Discord Sürümü Demo denemek istiyorsanız lüt
Ticaret paneli, emirleri yönetmekle sınırlıdır - hem düğmeler kullanılarak açılır hem de kullanıcı tarafından açılır. Koleksiyonda basit ve kullanışlı. Herhangi bir alıcıyı tamamlayacak. Gold Stuff göstergesiyle birlikte kullanmanızı öneririm. Alım satımı tek emirler olarak kurun ve mesafeli bir ızgara oluşturun. Standart bir ızgara oluşturmak için 10000 gibi büyük bir mesafe ayarlamanız yeterlidir. Gerçek zamanlı sonuçlar burada görüntülenebilir. Ayarları ve kişisel bir bonusu almak için s
TakePropips TradePad Pro
Eric John Pajarillaga Aldana
5 (4)
TakePropips TradePad Pro , güçlü bir ticaret yöneticisi, para birimi gücü ölçer, hesap raporlama araçları, risk yönetimi araçları ve daha fazlasını içerir! Karşılaşacağınız en gelişmiş forex ticaret yöneticisi ve ticaret asistanlarından biridir! Ticari işlemleri yönetmenin daha verimli bir yolunu isteyen tacirler için mükemmel bir çözümdür. Kullanım kılavuzunu blog yazımızdan indirebilirsiniz:   https://www.mql5.com/en/blogs/post/751180 Bu ticaret sistemini Strateji Test Aracında test edebilirsi
Mentfx Mmanage
Anton Jere Calmes
5 (16)
The added video will show you the full functionality, effectiveness, and simplicity of this trade manager. Drag and Drop Trade Manager. Draw your entry and have the tool calculate the rest. Advanced targeting and close portions of a trade directly available in tool (manage trades while you sleep). Market order or limit order on either side with factored spread. Just draw the entry, the tool does the rest. Hotkey setup to make it simple. Draw where you want to enter, and the stop loss, the tool c
TradePanel MT4
Alfiya Fazylova
4.91 (88)
Ticaret Paneli çok işlevli bir ticaret asistanıdır. Uygulama, manuel ticaret için 50'den fazla işlev içerir ve çoğu ticaret eylemini otomatikleştirmenize olanak tanır. Satın almadan önce Demo sürümünü bir demo hesabında test edebilirsiniz. Demo burada . Talimatların tamamı burada . Ticaret. Tek tıklamayla temel alım satım işlemlerini gerçekleştirmenize olanak tanır: Bekleyen emirleri ve pozisyonları açın. Bekleyen emirleri ve pozisyonları kapatın. Pozisyonların tersine çevrilmesi (SATIN KAPATIN
News Trapper EA
Noha Mohamed Fathy Younes Badr
5 (7)
Hi, all.  News trapper EA It is an expert for trading news very safe expert  put Settings interest rate only or high impact news for Automated Trading on the news of the economic calendar. It shows stable trading during last 10  years. EA doesn't use dangerous technologies like martingale, grid. The Expert is very simple to use. The program contains flexible settings In the terminal settings, you need to add the news site to the list of allowed URLs. Click Tools >Options > Expert Advisors. Che
-25% discount ($149 -> $111) Everything for chart Technical Analysis indicator mt4 in one tool Draw your supply demand zone with rectangle and support resistance with trendline and get alerts to mobile phone or email alert -  Risk reward indicator Video tutorials, manuals, DEMO download   here .  Find contacts on my   profile . 1.   Extended rectangles and trendlines Object will be extended to the right edge of the chart when price will draw new candles on chart. This is rectangle extender or
The Expert Advisor will help you forward all pop-up alert with screenshot from  MetaTrader 4 to Telegram channel/ group, also forward all notifications to Telegram. Parameters  -  Telegram Bot Token - create bot on Telegram and get token.  -  Telegram Chat ID  - input your Telegram user ID,  group / channel ID  -  Forward Alert - default true, to forward alert.  -  Send message as caption of Screenshot - default false, set true to send message below Screenshot  How to setup and guide  - Telegram
I present to your attention a powerful utility for predicting the future movement of an asset based on W.D. Ganna’s law of vibration. This utility analyzes the selected market model and provides codes for future possible market movement patterns. If you enter the selected code into the appropriate box, you will receive a forecast of the potential market movement. The utility has the ability to display several potential forecast models. The forecast is not yet tied to time and price and gives th
The top-selling EAs on the market cost a lot and one day they are suddenly gone. This is because one strategy will not work in the forex market all the time. Our product is unique from all others in the MQL Marketplace because our EA comes with 34+ built-in indicators that allow adding more strategies every time.  You build your strategy and keep updating it. If one strategy does not work, simply build another all using only one EA. This is All-In-One EA in this market place. You can use as trad
Riskless Pyramid
Snapdragon Systems Ltd
5 (1)
Introduction This powerful MT4 trade mangement EA offers a way potentially to aggressively multiply trade profits in a riskfree manner. Once a trade has been entered with a defined stoploss and take profit target then the EA will add three pyramid add-on trades in order to increase the overall level of profit. The user sets the total combined profit target to be gained if everything works out. This can be specified either as a multiple of the original trade profit or as a total dollar amount. Fo
Equity Shield
Vladimir Stepanov
4.63 (8)
Expert Advisor, öz sermayeyi sürekli izleyerek ve parametrelerde girilen kurallara göre hesabınızı beklenmeyen kayıplardan koruyacaktır. Kurallar ihlal edildiğinde EA tüm işlemleri kapatacaktır. EA'yı tüm işlemleri belirli bir yüzde veya para kaybıyla kapatacak veya belirli bir yüzde veya para kârıyla kapatacak şekilde ayarlayabilirsiniz. Bu yardımcı program, çekilişi düşük tutmak ve öz sermayenizi korumak için Prop Trading Challenges için çok kullanışlıdır! Sinyallerim ve diğer ürünlerim bur
Forex portföyünüzün kontrolünü elinize alın. Nerede durduğunuzu, neyin işe yaradığını ve size neyin acı verdiğini anında görün! MT5 VERSİYONU BURADA MEVCUTTUR: https://www.mql5.com/en/market/product/58658 Trade Manager Dashboard, forex piyasasında sahip olduğunuz her pozisyonun şu anda nerede olduğunu bir bakışta size göstermek ve risk yönetimini ve para birimlerine maruz kalmayı daha kolay anlamak için tasarlanmıştır. Birden fazla pozisyon veya ticaret ızgarası ve sepet stratejileri ile kade
An instrument capable of instantly calculating position size or risk based on a specified stop-loss level is critically important for both professional traders and beginners. Trading utility TRADE PRO provides fast and accurate calculations, helping you make decisions in conditions of limited time and increased market volatility. Main functions: Original. Simple. Effective. Original and convenient opening of the main trading panel: Simply hover your mouse over the right part of the chart and cli
Pro Arbitrage EA   trades based on Arbitrage Strategy. The strategy is like a scalping technology but on three cross currency pairs at the same time. Each trade basket involves three pairs (all open at the same time) and they will close at once when any desired profit reaches. The strategy has no SL technically because all opened currencies are hedged. SL can happen if high slippages on order execution on the broker side. So the strategy is one of the safest ones in the world. MT4 Limitation :
VirtualTradePad mt4 Extra
Vladislav Andruschenko
4.86 (63)
1 tıklama ile ticaret için Ticaret Paneli.   Pozisyonlar ve emirlerle çalışmak!   Grafikten veya klavyeden alım satım. Alım satım panelimizi kullanarak, grafikten tek bir tıklamayla alım satım yapabilir ve alım satım işlemlerini standart MetaTrader kontrolünden 30 kat daha hızlı gerçekleştirebilirsiniz. Bir tüccar için hayatı kolaylaştıran ve bir tüccarın ticaret faaliyetlerini çok daha hızlı ve daha rahat gerçekleştirmesine yardımcı olan parametrelerin ve işlevlerin otomatik hesaplamaları. Gra
What Exactly Is A Smart Trading Tool? Smart Trading Tool was developed for fast and comfortable trading of the financial markets especially for ORDER BLOCKS TRADERS . It provides traders functionalities, such as: A Drawing Tool One-Click Trading Panel Automated Lot Sizes Calculation based on your risk appetite & Money Management ( Watch this video , how this tool can help manage your risk per trade better!) Built in PRICE LEVELS (Fibonacci, Round Numbers, Daily hi-low, etc) Shows Trading Informa
This is a multi-pair and multi scanner dashboard to find the key signal of BBMA Oma Ally Strategy BBMA consists of the use of 2 indicators: Moving Averages Bollinger Bands BBMA consists of many types of entries: Reentry Extreme Rejection EMA50 GAP (EMA50 to Upper/Lower BB) MHV Full Setup (CSE>TPW>MHV>Direction>Reentry) There are many multi timeframe signals based on this strategy. RRE (Reentry - Reentry - Extreme) REE (Reentry - Extreme - Extreme) REM (Reentry - Extreme - MHV) RRM (Reentry - R
Siparişlerin önceden ayarlanmış ve MT4 terminali için otomatik lot hesaplamasına sahip bir ticaret paneli. Dikkat, Ticaret Paneli strateji test cihazında çalışmaz (yalnızca takip eden durdurma testi). Kılavuz, Açıklama, Hafif Demo İndir. Başarılı tüccarlar, öz disiplin ve yetkin yönetim ile ayırt edilirler. Sabit bir lot kullanırsanız, o zaman risk altındasınız demektir. Sonuçta, farklı zaman dilimlerinde farklı mesafeler vardır ve karsız bir işlem birkaç kar marjını kapatabilir. Otomatik lot ku
Yazarın diğer ürünleri
Description A universal colored multicurrency/multi-symbol indicator of moving averages: Moving Average, Double Moving Average, Triple Moving Average . The indicator is drawn in a separate window, so below the main trading chart a user can see the development of another financial instrument. It is very useful when considering the combined values of various moving averages for different financial instruments below the main trading chart.  The indicator may be used with any broker, irrespective of
The indicator detects the following types of Japanese candlesticks: Doji, Hammer and/or Hanging Man, Shooting Star and/or Inverted Hammer, Spinning Top, Maribozu. The indicator is intended for manual and/or automated trading within an Expert Advisor. There is a possibility to choose colors for bullish and bearish candlesticks. For automated trading, use any indicator buffer of the double type: 0, 1, 2 or 3, whose value is not zero!
The indicator is intended for detecting big (long) and/or small (short) candlesticks. There is possibility of coloring the bullish and bearish candlesticks. The indicator can be used for manual and/or automated trading within an Expert Advisor. The indicator data that can be used for automated trading can be taken from one of four buffers of the double type: 0, 1, 2 or 3. Values must not be equal to zero. 
The indicator of DeMark fractals. The indicator can be drawn on the basis of price data and on the basis of a moving average. There is a possibility to color the up and down fractals. The indicator can be used for manual and for automated trading within an Expert Advisor. For automated trading, use any indicator buffer of the double type: 0 - up fractals, 1 - down fractals! Values of the buffers must not be equal to zero.  A moving average is drawn on the basis of input parameters: Calc_Method 
Stochastic Global
Igor Semyonov
4 (1)
Description A universal colored indicator Stochastic. The rising and falling lines and the levels of the indicator can be colored.   The indicator can be calculated as the standard one on the basis of a price or as a derivative on the basis of the following nineteen other indicators included in the standard package of the MetaTrader 4 terminal: AD - an indicator of accumulation and distribution of volume. OBV - On Balance Volume. Volume - tick volume indicator. AC - indicator of acceleration. AO
Description A universal colored indicator MACD Histo. The rising and falling of the indicator histogram can be colored.   The indicator can be calculated as the standard one on the basis of a price or as a derivative on the basis of the following twelve other indicators included in the standard package of the MetaTrader 4 terminal: AD - an indicator of accumulation and distribution of volume. OBV - On Balance Volume. Volume - tick volume indicator. Force - Force Index indicator. MFI - Money Flow
Description A colored universal indicator MACD Line (MA convergence-divergence indicator, shown as a histogram). The rising and falling of the indicator histogram can be colored. The indicator can be calculated as the standard one on the basis of a price or as a derivative on the basis of the following twelve other indicators included in the standard package of the MetaTrader 4 terminal: AD - an indicator of accumulation and distribution of volume. OBV - On Balance Volume. Volume - tick volume i
Description A universal indicator RSI together with moving averages based on it. Depending on the need, moving averages can be disabled. You can color the indicator lines and levels: lines of RSI, moving average lines and thresholds of overbought and oversold levels.   The indicator can be calculated as the standard one on the basis of a price or as a derivative on the basis of the following eighteen other indicators included in the standard package of the MT4 terminal: AD - an indicator of accu
CCI Global
Igor Semyonov
5 (1)
Description A universal indicator CCI together with moving averages based on it. Depending on the need, moving averages can be disabled. You can color the indicator lines and levels: lines of CCI, moving average lines and thresholds of overbought and oversold levels.   The indicator can be calculated as the standard one on the basis of a price or as a derivative on the basis of the following eighteen other indicators included in the standard package of the MetaTrader 4 terminal: AD - an indicato
Description A multi-purpose multi-colored/multi-symbol indicator, which is a set of standard tools from the MetaTrader 4 terminal. The difference is that below the basic price chart it allows to calculate and build in a separate window any of the twenty indicators in a colored form, painting bulls and bears in different colors, for any financial instrument in accordance with the list below:  AD - an indicator of accumulation and distribution of volume. OBV - On Balance Volume. Force - Force Inde
Description A colored universal indicator AO (Awesome Oscillator). The rising and falling of the indicator histogram can be colored.   The indicator can be calculated as the standard one or as a derivative on the basis of the following eleven other indicators included in the standard package of the MetaTrader 4 terminal: AD - an indicator of accumulation and distribution of volume. OBV - On Balance Volume. Volume - tick volume indicator. Force - Force Index indicator. MFI - Money Flow Index. ATR
Description A colored universal indicator MACD Classic (MA convergence-divergence indicator) that combines two indicators: MACD Line and MACD Histo. The rising and falling lines, the signal line and the indicator histogram can be colored. The indicator can be calculated as the standard one on the basis of a price or as a derivative on the basis of the following twelve other indicators included in the standard package of the MetaTrader 4 terminal: AD - an indicator of accumulation and distributio
Description The universal colored multicurrency/multisymbol indicator MACD Classic, consisting of two MACD indicators: MACD Line and MACD Histo. The indicator may be used with any broker, irrespective of the name of the financial instrument since it is necessary to manually enter the name as an input parameter. If you enter a non-existent or incorrect name of a financial instrument, you will receive an error message that this financial instrument is unknown (does not exist). Inputs Currency_Na
Description A colored universal indicator/oscillator based on crossing moving averages. The rising and falling lines of the indicator histogram can be colored. The combined use of the line and the histogram increases the level of the analysis when making a decision to open or close deals. The indicator can be calculated as the standard Price Oscillator or as a derivative on the basis of the following eleven other indicators included in the standard package of the MetaTrader 4 terminal: AD - an i
Description A universal colored multicurrency/multi-symbol indicator RAVI. Was proposed by T. Chand as a trend indicator. RAVI means Range Action Verification Index. The indicator may be used with any broker, irrespective of the name of the financial instrument since it is necessary to manually enter the name as an input parameter. If you enter a non-existent or incorrect name of a financial instrument, you will receive an error message that this financial instrument is unknown (does not exist).
Description A colored multicurrency/multisymbol oscillator of the market mood. The oscillator is designed for detecting the continuation or change of the market mood prior to its occurrence. An excellent example is the screenshots that show all the features of the oscillator. The oscillator may be used with any broker, irrespective of the name of the financial instrument since it is necessary to manually enter the name as an input parameter. If you enter a non-existent or incorrect name of a fin
Description The indicator determines the appearance of internal bars on the chart, and paints them in accordance with the bullish and/or bearish mood. The indicator can notify of the appearance of a formed internal bar by playing a beep, as well as display the time remaining until the end of the formation of the current bar in the format of <d:h:m:s, where: < means the current bar. d - days. h - hours. m - minutes. s - seconds. The bullish and bearish mood can be colored. Inputs Sound_Play - a
Description The indicator determines the appearance of the bars that signal of a reversal of current local moods and plays a beep. It also paints these bars in accordance with the bullish and/or bearish priority. You can select the color for bullish and bearish moods. Inputs Sound_Play - a flag that allows the sound notification. Use Detection of the reversal bar can be a signal to perform appropriate trading activities.  The indicator can be used for manual or automated trading in an Expert
Description The indicator determines the appearance of bars that notify of the reversal of the current trend, and paints them in accordance with the bullish and/or bearish mood. The indicator can notify of the appearance of a formed reversal bar by playing a beep, as well as display the time remaining until the end of the formation of the current bar in the format of <d:h:m:s, where: < means the current bar. d - days. h - hours. m - minutes. s - seconds. You can select the color for bullish and
Description A universal colored indicator of moving averages: Moving Average, Double Moving Average, Triple Moving Average . The indicator provides various opportunities for the analysis of prices based on different ways of constructing moving averages in the window of the main financial instrument. You can color bullish and bearish moods. Inputs MA_Type - type of multiplicity: Moving Average. Double Moving Average. Triple Moving Average. MA_Period - the MA period. MA_Method - the averaging me
Description A colored universal multicurrency/multi-symbol indicator Bollinger Bands to be drawn in a separate window below the main financial instrument. The rising and falling line of the main indicator and Bollinger Bands can be colored. The indicator can be calculated based on one of the eleven basic indicators included in the standard package of the MetaTrader 4 terminal: AD - an indicator of accumulation and distribution of volume. OBV - On Balance Volume. Force - Force Index indicator. MF
Description A colored universal multicurrency/multi-symbol indicator Channel to be drawn in a separate window below the main financial instrument. The indicator uses the calculation method of the Price Channel indicator. The rising and falling line of the main indicator and the Channel lines can be colored. The indicator can be calculated based on one of the eleven basic indicators included in the standard package of the MetaTrader 4 terminal: AD - an indicator of accumulation and distribution o
Description Keltner's colored channel indicator,also called STARC band, drawn in the main chart window. The indicator uses the calculation technique of the three drawing options: basic, improved and modified . The first two were proposed by Keltner, the third one - by a successful trader L. Rakshe. You can also search for your own best parameters of the indicator. The upper, middle and lower bands can be colored. The indicator includes the basic analytical tool of the market moods by Keltner. Th
Description A colored universal multicurrency/multi-symbol indicator ZigZag to be drawn in a separate window below the main financial instrument. The indicator may be used with any broker, irrespective of the name of the financial instrument since it is necessary to manually enter the name as an input parameter. If you enter a non-existent or incorrect name of a financial instrument, you will receive an error message that this financial instrument is unknown (does not exist).  The indicator can
Description A colored channel indicator Price Channel to be drawn on the main chart of a financial symbol. It can color bullish and bearish moods based on the middle line of the indicator, as well as change the color of the upper and lower lines of the channel. Purpose The indicator can be used for manual or automated trading in an Expert Advisor. Values of indicator buffer of the double type can be used for automated trading:  The middle line of the indicator - buffer 4. The upper line of the
Description Candlesticks is a colored multicurrency/multy-symbol indicator. It shows a financial instrument as a candlestick chart in a separate window below the chart of the main financial symbo. The indicator may be used with any broker, irrespective of the name of the financial instrument since it is necessary to manually enter the name as an input parameter. If you enter a non-existent or incorrect name of a financial instrument, you will receive an error message that this financial instrume
Description Candlestick Tools  is a colored multicurrency/multy-symbol indicator. It shows one of four standard indicators as a candlestick chart in a separate window below the chart of the main financial symbol. The indicator is calculated based on one of two indicators included in the standard package of the МetaТrader 4 terminal: CCI - Commodity Channel Index. RSI - Relative Strength Index. The default indicator is Commodity Channel Index. The indicator may be used with any broker, irrespecti
Description Pivot Pro  is a universal color indicator of the  Pivot Points  levels systems. You can select one of its three versions:  Standard   Old , Standard New  and  Fibo . The system will automatically calculate the  Pivot Point  on the basis of market data for the previous day ( PERIOD_D1 ) and the system of support and resistance levels, three in each. It can also display price tags for each level. You can color the indicator lines. Only a method of calculation of the third level of supp
Description The indicator is intended for labeling the chart using horizontal levels and/or half-round prices. The indicator works on any financial instrument regardless of the name and the number of digits. A user can choose colors for the indicator lines. Input Parameters Calc_Method - method of calculation of the lines: levels of round prices. levels of half-round prices. Digits_Accepted - flag for calculating the levels according to number of decimal places in the quotes of a financial ins
Description A colored universal multicurrency/multi-symbol indicator MACD Line Smart (the indicator moving average convergence divergence is displayed as a histogram) based on double or triple moving average .  Comparing to the standard MACD this indicator is more sensitive to what allows generating advance signals. he indicator may be used with any broker, irrespective of the name of the financial instrument since it is necessary to manually enter the name as an input parameter. If you enter a
Filtrele:
pnutfx503
1524
pnutfx503 2017.04.27 07:36 
 

Great service everyone shoud be using pivots

İncelemeye yanıt
Sürüm 1.31 2020.04.01
Updating
Sürüm 1.30 2017.03.30
The indicator algorithm is brought into compliance with the requirements of the latest MQL4 language version as of the current publication date.