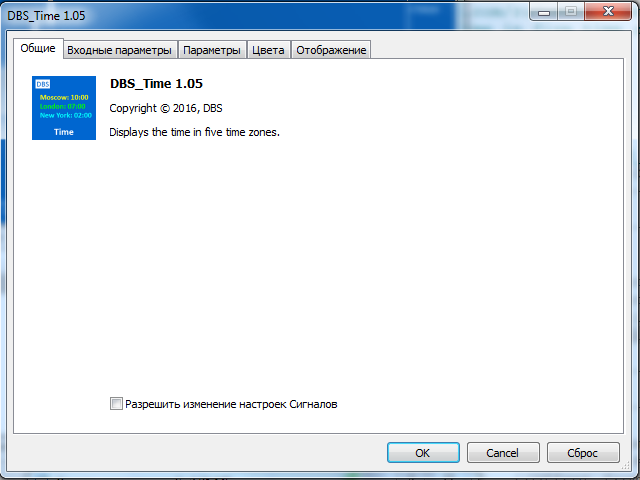
• Genel bakış
  • İncelemeler (3)
  • Yorumlar (2)

DBS Time

5

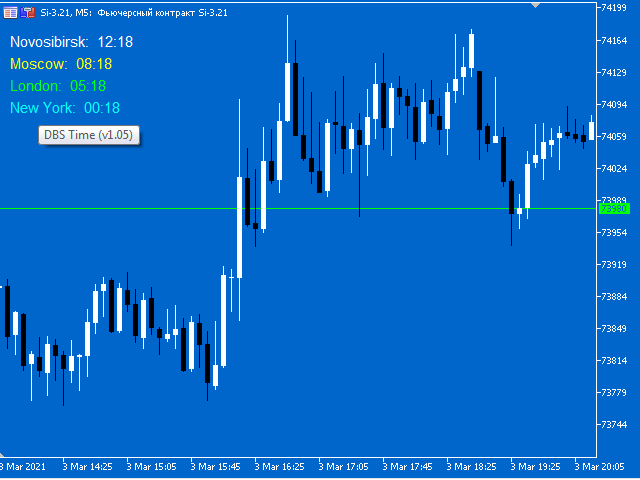
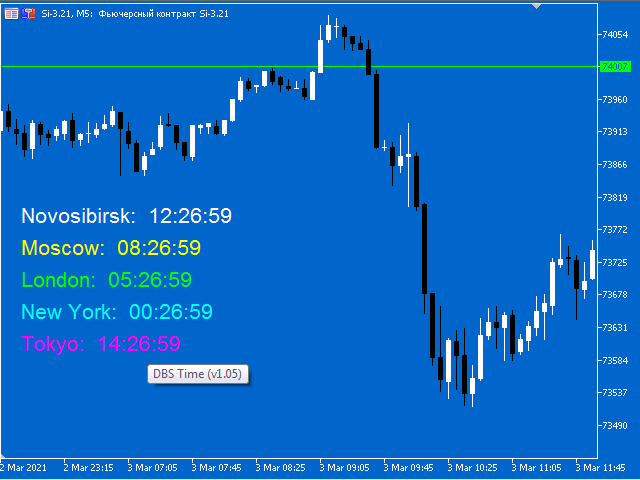
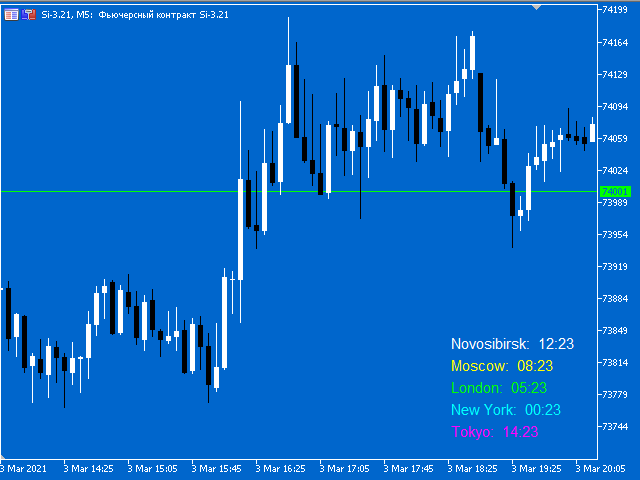
A small utility displays the time in five time zones.

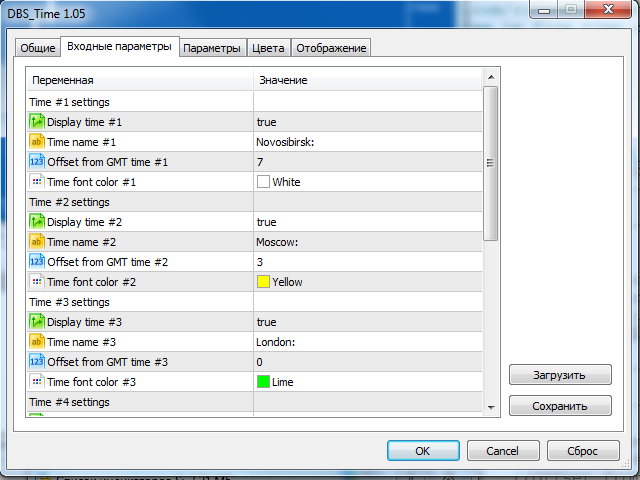
You can customize the display of one to five time zones.

For each time it is configured:

  • show or not;
  • name;
  • time offset from GMT;
  • color;

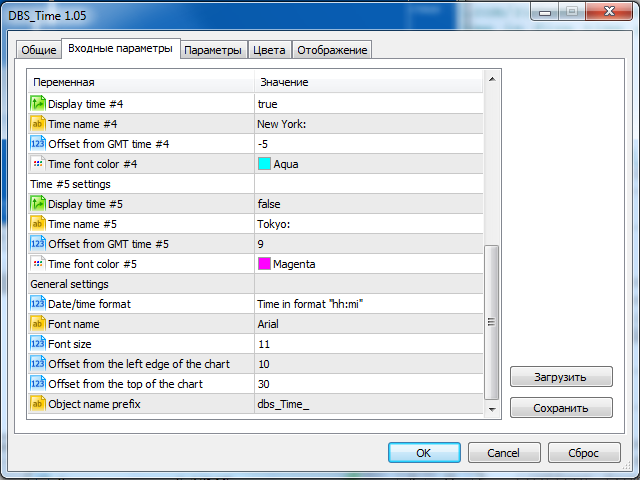
In general settings, you can change:

  • date / time format ("hh: mi", "hh: mi: ss", "yyyy.mm.dd hh: mi", "yyyy.mm.dd hh: mi: ss")
  • font name;
  • font size;
  • offset from the left edge of the chart;
  • offset from the top edge of the chart;


İncelemeler 3
DrSeishin
259
DrSeishin 2022.03.04 09:40 
 

Thanks!

Norman McIver
745
Norman McIver 2021.08.11 20:59 
 

This is probably the most convenient and non intrusive time zone indicator on the market place. Thanks for publishing it :)

jgomnet1969
24
jgomnet1969 2024.05.24 13:17 
 

Very good, but it could be improved so that it automatically updates daylight saving time depending on the user's location.

Önerilen ürünler
Show Pips for MT5
Roman Podpora
4.63 (19)
Bu bilgi göstergesi her zaman hesaptaki güncel durumdan haberdar olmak isteyenler için faydalı olacaktır. -   Daha kullanışlı göstergeler Gösterge, puan cinsinden kâr, yüzde ve para birimi gibi verilerin yanı sıra mevcut çiftin spreadini ve mevcut zaman diliminde çubuğun kapanmasına kadar geçen süreyi görüntüler. Bilgi satırını grafiğe yerleştirmek için birkaç seçenek vardır: Fiyatın sağında (fiyatın arkasında); Yorum olarak (grafiğin sol üst köşesinde); Ekranın seçilen köşesinde. Bilgi ayırı
FREE
This indicator will mirror the assets in use in another metatrader, being able to choose the timeframe and a template. This is the Metatrader 5 Client, it needs the Metatrader 4 or 5 Server versions: Metatrader 4 Mirror Chart Server:   https://www.mql5.com/en/market/product/88644 Metatrader 5 Mirror Chart Server: https://www.mql5.com/en/market/product/88652 Details of how it works in the video.
FREE
Important Lines
Terence Gronowski
4.85 (20)
This indicator displays Pivot-Lines, preday high and low, preday close and the minimum and maximum of the previous hour. You just have to put this single indicator to the chart to have all these important lines, no need to setup many single indicators. Why certain lines are important Preday high and low : These are watched by traders who trade in a daily chart. Very often, if price climbs over or falls under a preday low/high there is an acceleration in buying/selling. It is a breakout out of
FREE
Value Chart Candlesticks
Flavio Javier Jarabeck
4.75 (8)
The idea of a Value Chart indicator was presented in the very good book I read back in 2020 , " Dynamic Trading Indicators: Winning with Value Charts and Price Action Profile ", from the authors Mark Helweg and David Stendahl. The idea is simple and the result is pure genius: Present candlestick Price analysis in a detrended way! HOW TO READ THIS INDICATOR Look for Overbought and Oversold levels. Of course, you will need to test the settings a lot to find the "correct" one for your approach.
FREE
Expansoes M
Marcus Vinicius Da Silva Miranda
The M Extensions are variations of the Golden Ratio (Fibonacci Sequence). It is the World's first technique developed for Candle Projections. Advantages: Easy to plot. Candle anchoring; High and accurate precision as support and resistance; Excellent Risk x Return ratio; Works in any timeframe; Works in any asset / market.   The M Extensions are classified into: M0: Zero point (starting candle) RC: Initial candle control region M1: Extension region 1 M2: Extension region 2 M3: Extension r
FREE
Cumulative Delta MT5
Evgeny Shevtsov
4.54 (52)
The indicator analyzes the volume scale and splits it into two components - seller volumes and buyer volumes, and also calculates the delta and cumulative delta. The indicator does not flicker or redraw, its calculation and plotting are performed fairly quickly, while using the data from the smaller (relative to the current) periods. The indicator operation modes can be switched using the Mode input variable: Buy - display only the buyer volumes. Sell - display only the seller volumes. BuySell -
FREE
Smart Grid MT5
Dmitry Kotov
5 (5)
Smart Grid MT5 automatically recognizes any symbol, period and scale of the chart and marks it up accordingly. It is possible to mark up the chart by trading sessions. The grid consists of the two main line types. Vertical lines There are two visualization methods: Standard - the lines are divided into three types, separating: Small time period. Medium time period. Large time period. Trading Session - the lines are divided into groups (a total of ten). Each group has two lines: the first is re
FREE
Rainbow MT5
Jamal El Alama
4 (1)
Description : Rainbow MT5 is a technical indicator based on Moving Average with period 34 and very easy to use. When price crosses above MA and MA changes color to green, then this is a signal to buy. When price crosses below MA and MA changes color to red, then this is a signal to sell. The Expert advisor ( Rainbow EA MT5 ) based on Rainbow MT5 indicator is now available here . MT4 version is available here .
FREE
TradeQL
Abdiel Aviles Jimenez
The TradeQL Indicator is a customizable tool that highlights specific trading patterns on candlestick charts. Users can define patterns through TradeQL queries, which the indicator then applies to the chart, visually representing matches and captured groups. Ideal for identifying complex trade setups in real-time. TradeQL queries are specified using the TradeQL Language. See https://github.com/abdielou/tradeql for more details. This language is expressed as a regular expression. The language a
FREE
The Rayol Code Hour Interval Lines indicator was  designed to assist your trading experience.  It  draws the range of hours chosen by the user directly on the chart, so that it enables traders to visualize price movements during their preferred trading hours, providing  traders a more comprehensive view of price movements and market dynamics. This indicator allows the user to choose not only the Broker's time, but also the Local time. This way, the user no longer needs to calculate local time in
FREE
Fiyat Dalga Modeli   MT5 --(ABCD Modeli)--   hoş geldiniz ABCD modeli, teknik analiz dünyasında güçlü ve yaygın olarak kullanılan bir ticaret modelidir. Tüccarların piyasadaki potansiyel alım ve satım fırsatlarını belirlemek için kullandıkları uyumlu bir fiyat modelidir. ABCD modeliyle, tüccarlar potansiyel fiyat hareketlerini tahmin edebilir ve alım satımlara ne zaman girip çıkacakları konusunda bilinçli kararlar verebilir. EA Sürümü: Price Wave  EA MT5 MT4 Sürümü :   Price Wave Pattern
FREE
this little free tool allows you to set 5 vertical lines at specific time. you can use it to mark london open / asia open / comex open and so on... it draws the lines in the future space - so you wont miss an important time / candle you can select color..thickness of the lines you can select only 2 or 3 of the 5 max. lines - you dont have to use the max. 5 lines. i use it myself to never miss the best times to trade.
FREE
Are you tired of drawing trendlines every time you're analyzing charts? Or perhaps you would like more consistency in your technical analysis. Then this is for you. This indicator will draw trend lines automatically when dropped on a chart. How it works Works similar to standard deviation channel found on mt4 and mt5. It has 2 parameters: 1. Starting Bar 2. Number of bars for calculation The   starting bar   is the bar which drawing of the trend lines will begin, while the   number of bars for c
FREE
This indicator is especially for the binary trading. Time frame is 1 minutes and exp time 5 or 3 minutes only. You must be use martingale 3 step. So you must put lots size is 10 % at most. You should use Mt2 trading platform to connect with my indicator to get more signal without human working. This indicator wining rate is over 80% but you may get 100% of profit by using martingale 3 step. You should use MT2 Trading Platform to connect meta trader platform and binary platform . You can get mt2
FREE
Automatic Trendlines
Pasi Hakamaki
4.63 (40)
The indicator draws trendlines on chart. This indicator has six inputs. User can specify alternative labels for both lines. If multiple instances of the indicator are used, the labels must differ. User can set width and color of the lines and depth which specifies what significant peaks should be used. For example, Depth=10 sets trendlines using the current peaks and valleys that have at least 10 bars to the right and to the left and that have highs/lows less/greater than the peak's high/low. In
FREE
Micro  Demo  ******************* Секундные графики в Meta Trader 5 ********************** Более точного инструмента для входа в сделку вы не найдёте. Платная полная версия:  Micro "Second charts" В демоверсии секундные периоды сменяются случайным образом через случайные интервалы времени. Отсутствует автоматическая настройка периодов бесплатных индикаторов.   Входные параметры: Displayed bars - отображаемые бары Step of price levels, pp, 0-off - шаг отрисовки ценовых уровней, пункты Scale
FREE
Heiken Ashi MT5 Göstergesi Heiken Ashi MT5 Göstergesi, standart fiyat verilerini daha yumuşak ve trend odaklı mumlara dönüştürerek, piyasa trendlerini ve potansiyel dönüş noktalarını daha kolay belirlemenizi sağlayan güçlü bir araçtır. Ana Özellikler: Net trend tanımlama: Yükseliş ve düşüş trendlerini farklı mum renkleriyle görsel olarak ayırt eder. Gürültü azaltma: Fiyat dalgalanmalarını filtreleyerek piyasanın ana hareketlerine daha net odaklanmanızı sağlar. Erken trend tespiti: Standart graf
FREE
BoxInside MT5
Evgeny Shevtsov
5 (3)
This indicator calculates the volume profile and places labels that correspond to the VAH, VAL and POC levels, for each candle individually. Indicator operation features The indicator works on the timeframes from M3 to MN, but it uses the history data of smaller periods: M1 - for periods from M3 to H1, M5 - for periods from H2 to H12, M30 - for the D1 period, H4 - for the W1 period, D1 - for the MN period. The color and location of the VAL, VAH and POC labels on the current candle are consider
FREE
Market Profile 3 ForexArby com
Hussien Abdeltwab Hussien Ryad
3.83 (12)
Market Profile 3 MetaTrader 5 indicator  version 4.70— is a classic Market Profile implementation that can show the price density over time, outlining the most important price levels, value area, and control value of a given trading session. This indicator can be attached to timeframes between M1 and D1 and will show the Market Profile for daily, weekly, monthly, or even intraday sessions. Lower timeframes offer higher precision. Higher timeframes are recommended for better visibility. It is als
FREE
This Mt5 Indicator Signals when there is two opposite direction bars engulfed by current bar.  has a recent Exponential Moving Average Cross and past bar was oversold/bought Expert Advisor Available in Comments  Free Version Here : https://www.mql5.com/en/market/product/110114?source=Site&nbsp ; Full Alerts for mt5 terminal , phone , email, print to file, print to journal  Buy Signal ( blue line ) Past ema cross ( set at 30 bars back ) Past bar rsi is oversold ( level 40  ) Engulfing bar closes
FREE
DALA Forecast
Grigorii Matsnev
About the indicator: DALA Forecast is a universal tool for predicting the dynamics of time series of any nature. For prediction, modified methods of nonlinear dynamics analysis are used, on the basis of which a predictive model is built using machine learning methods.  To get the trial version of the indicator, you can contact me in private messages. How to use the indicator: Apply the indicator to your chosen financial instrument or indicator with the settings you need. The prediction will b
FREE
Market Time Pad
Vladislav Andruschenko
4.17 (6)
Dünyanın ana pazarlarında geçerli saati gösteren gösterge. Ayrıca geçerli oturumu da görüntüler. Kullanımı çok kolay. Grafikte fazla yer kaplamaz. Expert Advisors ve VirtualTradePad   gibi diğer panellerle birlikte kullanılabilir. Klasik tarz versiyonu. Sevgili dostlarımız ve EA'larımızın kullanıcıları, lütfen değerlendirmelerinizi   Yorumlar   bölümüne ekleyin. Forex yazılımımızdaki tüm güncellemeler   ücretsizdir   ! Bu ücretsiz bir ticaret aracıdır! Diğer özellikler: Giriş parametrelerinde
FREE
Spread highlighter
Jonathan Daniel Marion
This spread indicator displays the actual spread of each candle. It highlights the maximum spread and the minimum spread of the chosen symbol. This indicator is very helpful to see in real time the spread evolution helping to avoid taking a trade when the spread is too high. Inputs: Print value in Points: if true displays the spread as a whole number D isplay minimum and maximum spread of the past N days: select the number of days to consider the maximum and minimum spread Automatically
FREE
Account Info EA It is a tool that presents on the graph all the positions of the account, and specific information concerning the positions, but also the account. It enables the user to have an image of his account at a glance. Use like any expert advisor. You can't attach it in the same chart with other expert advisor. It does not have the ability to open or manage positions. You can attach it on any chart and any timeframe.
FREE
Order Book, known also as Market Book, market depth, Level 2, - is a dynamically updated table with current volumes of orders to buy and to sell specific financial instument at price levels near Bid and Ask. MetaTrader 5 provides the means for receiving market book from your broker, but in real time only, without access to its history. This expert adviser OrderBook History Playback allows you to playback the market book events on the history using files, created by OrderBook Recorder . The exper
FREE
This is a buyer and seller aggression indicator that analyzes the shape of each candle and project this data in a histogram form. There are 4 histograms in one. On the front we have two: Upper - Buyer force. Lower - Seller force. At the background we also have two histogram, both with same color. They measure the combined strenght of buyers and sellers. This histograms can be turned off in Input Parameters. It is also possible to have the real or tick volume to help on this force measurement. IN
FREE
Gösterge, grafikte yuvarlak seviyeleri gösterir. Bunlara psikolojik, banka veya ana oyuncu seviyeleri de denir. Bu seviyelerde boğalar ve ayılar arasında gerçek bir mücadele vardır, birçok emir birikir ve bu da oynaklığın artmasına neden olur. Gösterge, herhangi bir enstrümana ve zaman dilimine otomatik olarak ayarlanır. 80 seviyesi kırılır ve ardından test edilirse, satın alın. 20 seviyesi kırılır ve ardından test edilirse, satış yapın. Hedef 00'dır. Dikkat! Güçlü destek ve direnç seviyeleri n
FREE
LT Donchian Channel
Thiago Duarte
4.75 (4)
Donchian Channel is an indicator created by Richard Donchian. It is formed by taking the highest high and the lowest low of the last specified period in candles. The area between high and low is the channel for the chosen period. Its configuration is simple. It is possible to have the average between the upper and lower lines, plus you have alerts when price hits one side. If you have any questions or find any bugs, please contact me. Enjoy!
FREE
Premium trend entry pro TZ Trade Logics, presents you,  the enhance version of Premium trend entry  This release, bring you much more relaxed trading state with advanced features for trend filtering and premium signal entry timings. For us, is not the creating of the product which matters! but continued maintenance and education to users. through our dedicated means of reaching to us, you will enjoy close guide on how to use the product and other relevant training related to trading.  This tradi
FREE
Tapeworm
Nikolay Mitrofanov
The indicator converts two moving averages into histograms and paints their intersection area. There is a shift trick setting, it is used to smooth the result of calculations. You can see the changes if you reduce this parameter to 1 (minimum value). Available averages: MA Simple MA Exponential MA LinearWeighted MA Smoothed DEMA TEMA and RSI - as a bonus By default, the fast MA is displayed at the top of the histogram, and the slow one at the bottom. You can swap them if you like. shi
FREE
Bu ürünün alıcıları ayrıca şunları da satın alıyor
TPSpro RFI Levels MT5
Roman Podpora
4.73 (11)
TALİMATLAR         RUS   -        ENG       Bir gösterge ile kullanılması   önerilir       -       TPSpro   TREND PRO -   Sürüm MT4         Ticarette önemli bir unsur, bir ticaret aracını satın alma veya satma kararlarının alındığı bölgeler veya seviyelerdir. Büyük oyuncuların piyasadaki varlıklarını gizleme girişimlerine rağmen, kaçınılmaz olarak izler bırakırlar. Bizim görevimiz bu izleri nasıl tanımlayacağımızı ve doğru şekilde nasıl yorumlayacağımızı öğrenmekti. Ana işlevler:: Satıcılar ve
TPSproTREND PrO MT5
Roman Podpora
4.89 (9)
TPSpro TREND PRO  - is a trend indicator that automatically analyzes the market and provides information about the trend and each of its changes, as well as giving signals for entering trades without redrawing! The indicator uses each candle, analyzing them separately. referring to different impulses - up or down impulse. Exact entry points into transactions for currencies, crypto, metals, stocks, indices!  Version MT4               DETAILED DESCRIPTION               R ecommended to use with an
Atbot
Zaha Feiz
4.97 (34)
AtBot: Come funziona e come usarlo ### Come funziona L'indicatore "AtBot" per la piattaforma MT5 genera segnali di acquisto e vendita utilizzando una combinazione di strumenti di analisi tecnica. Integra la Media Mobile Semplice (SMA), la Media Mobile Esponenziale (EMA) e l'indice di Gamma Vero Medio (ATR) per identificare opportunità di trading. Inoltre, può utilizzare le candele Heikin Ashi per migliorare la precisione dei segnali. Lascia una recensione dopo l'acquisto e ricevi un regalo bonu
Atomic Analyst MT5
Issam Kassas
4.56 (18)
Öncelikle belirtmek gerekir ki bu Ticaret Göstergesi Yeniden Çizim Yapmaz, Gecikmez ve Gecikme Göstermez, bu da hem manuel hem de robot ticareti için ideal hale getirir. Kullanıcı kılavuzu: ayarlar, girişler ve strateji. Atom Analisti, Piyasada Daha İyi Bir Avantaj Bulmak İçin Fiyatın Gücünü ve Momentumunu Kullanan PA Fiyat Hareketi Göstergesidir. Gürültüleri ve Yanlış Sinyalleri Kaldırmaya ve Ticaret Potansiyelini Artırmaya Yardımcı Olan Gelişmiş Filtrelerle Donatılmıştır. Birden fazla katmanl
Öncelikle, bu Ticaret Sistemi'nin Non-Repainting, Non-Redrawing ve Non-Lagging Göstergesi olduğunu vurgulamak önemlidir, bu da hem manuel hem de robot ticareti için ideal hale getirir. Online kurs, kılavuz ve ön ayarları indir. "Smart Trend Trading System MT5", yeni ve deneyimli tüccarlar için özelleştirilmiş kapsamlı bir ticaret çözümüdür. 10'dan fazla premium göstergeyi birleştiriyor ve 7'den fazla sağlam ticaret stratejisi sunuyor, bu da çeşitli piyasa koşulları için esnek bir seçim yapar. Tr
Gold Stuff mt5
Vasiliy Strukov
4.92 (164)
Gold Stuff mt5, özellikle altın için tasarlanmış bir trend göstergesidir ve herhangi bir finansal enstrümanda da kullanılabilir. Gösterge yeniden çizilmez ve gecikmez. Önerilen zaman dilimi H1. Ayarları ve kişisel bir bonusu almak için satın alma işleminden hemen sonra benimle iletişime geçin!  Güçlü Destek ve Trend Tarayıcı göstergemizin ücretsiz bir kopyasını pm'den alabilirsiniz. Ben!   AYARLAR Ok Çiz - açık kapalı. grafik üzerinde oklar çizmek. Uyarılar - sesli uyarılar kapalı. E-post
Trend Screener Pro MT5
STE S.S.COMPANY
4.87 (62)
Trend Göstergesi, Trend Alım Satım ve Filtreleme için Çığır Açan Benzersiz Çözüm, Tüm Önemli Trend Özellikleriyle Tek Bir Araç İçinde Yerleştirildi! Forex, emtialar, kripto para birimleri, endeksler ve hisse senetleri gibi tüm sembollerde/araçlarda kullanılabilen %100 yeniden boyamayan çoklu zaman çerçevesi ve Çoklu para birimi göstergesidir. Trend Screener, grafikte noktalarla ok trend sinyalleri sağlayan etkili bir trend trend göstergesidir. Trend analizörü göstergesinde bulunan özellikler: 1.
Quantum Trend Sniper
Bogdan Ion Puscasu
4.8 (49)
Tanıtım       Kuantum Trend Keskin Nişancı Göstergesi   , trend tersine dönmeleri belirleme ve ticaret yapma şeklinizi değiştiren çığır açan MQL5 Göstergesi! 13 yılı aşkın ticaret tecrübesine sahip deneyimli tüccarlardan oluşan bir ekip tarafından geliştirilmiştir.       Kuantum Trend Keskin Nişancı Göstergesi       trend dönüşlerini son derece yüksek doğrulukla belirlemenin yenilikçi yolu ile ticaret yolculuğunuzu yeni zirvelere taşımak için tasarlanmıştır. ***Kuantum Trend Keskin Nişancı Gö
FX Power MT5 NG
Daniel Stein
5 (5)
Sabah Brifingimiz burada mql5 ve on Telegram! FX Power MT5 NG , uzun zamandır çok popüler olan döviz gücü ölçerimiz FX Power'ın yeni neslidir. Peki bu yeni nesil güç ölçer ne sunuyor? Orijinal FX Power hakkında sevdiğiniz her şey PLUS GOLD/XAU güç analizi Daha da hassas hesaplama sonuçları Ayrı ayrı yapılandırılabilir analiz dönemleri Daha da iyi performans için özelleştirilebilir hesaplama limiti Özel çokluDaha fazlasını görmek isteyenler için örnek ayarlar Her grafikte en sevdiğiniz renkler i
Öncelikle, bu Ticaret Aracının Non-Repainting, Non-Redrawing ve Non-Lagging Gösterge olduğunu vurgulamakta fayda var, bu da onu profesyonel ticaret için ideal hale getiriyor. Çevrimiçi kurs, kullanıcı kılavuzu ve demo. Akıllı Fiyat Hareketi Kavramları Göstergesi, hem yeni hem de deneyimli tüccarlar için çok güçlü bir araçtır. İleri ticaret fikirlerini, Inner Circle Trader Analizi ve Smart Money Concepts Ticaret Stratejileri gibi 20'den fazla kullanışlı göstergeyi bir araya getirerek bir aray
Top indicator for MT5   providing accurate signals to enter a trade without repainting! It can be applied to any financial assets:   forex, cryptocurrencies, metals, stocks, indices .  Watch  the video  (6:22) with an example of processing only one signal that paid off the indicator! MT4 version is here It will provide pretty accurate trading signals and tell you when it's best to open a trade and close it. Most traders improve their trading results during the first trading week with the help of
ATrend
Zaha Feiz
4.75 (4)
ATREND: Nasıl Çalışır ve Nasıl Kullanılır ### Nasıl Çalışır "**ATREND**" göstergesi, MT5 platformu için tasarlanmış olup, traderlara sağlam alım ve satım sinyalleri sağlamak amacıyla teknik analiz metodolojilerinin bir kombinasyonunu kullanır. Bu gösterge, öncelikle volatilite ölçümü için Ortalama Gerçek Aralık (ATR) kullanır ve potansiyel piyasa hareketlerini belirlemek için trend tespit algoritmalarıyla birleştirir. Satın aldıktan sonra bir mesaj bırakın ve özel bir bonus hediyesi kazanın. 30
Auto Order Block with break of structure based on ICT and Smart Money Concepts (SMC) Futures Break of Structure ( BoS )             Order block ( OB )            Higher time frame Order block / Point of Interest ( POI )    shown on current chart           Fair value Gap ( FVG ) / Imbalance   -  MTF      ( Multi Time Frame )    HH/LL/HL/LH  -  MTF      ( Multi Time Frame )  Choch  MTF      ( Multi Time Frame )  Volume Imbalance     ,  MTF          vIMB Gap’s Power of 3 Equal High
Protect against whipsaws: revolutionize your swing trading approach Special Offer: Purchase now to receive free bonuses worth $135! (Read more for details) Swing Trading is the first indicator designed to detect swings in the direction of the trend and possible reversal swings. It uses the baseline swing trading approach, widely described in trading literature. The indicator studies several price and time vectors to track the aggregate trend direction and detects situations in which the market i
** All Symbols x All Timeframes scan just by pressing scanner button ** *** Contact me  to send you instruction and add you in "123 scanner group" for sharing or seeing experiences with other users. After 17 years of experience in the markets and programming, Winner indicator is ready. I would like to share with you! Introduction The 123 Pattern Scanner indicator with a special enhanced algorithm is a very repetitive common pattern finder with a high success rate . Interestingly, this Winner in
IX Power MT5
Daniel Stein
4.17 (6)
IX Power   nihayet FX Power'ın rakipsiz hassasiyetini Forex dışı sembollere getiriyor. En sevdiğiniz endeksler, hisse senetleri, emtialar, ETF'ler ve hatta kripto para birimlerindeki kısa, orta ve uzun vadeli eğilimlerin yoğunluğunu doğru bir şekilde belirler. Terminalinizin sunduğu   her şeyi analiz   edebilirsiniz. Deneyin ve işlem yaparken   zamanlamanızın   nasıl   önemli ölçüde iyileştiğini   deneyimleyin. IX Power Temel Özellikler 100 hassas, yeniden boyanmayan hesaplama sonuçları -
FxaccurateLS
Shiv Raj Kumawat
WHY IS OUR FXACCCURATE LS MT5 THE PROFITABLE ? PROTECT YOUR CAPITAL WITH RISK MANAGEMENT Gives entry, stop and target levels from time to time. It finds Trading opportunities by analyzing what the price is doing during established trends. POWERFUL INDICATOR FOR A RELIABLE STRATEGIES We have made these indicators with a lot of years of hard work. It is made at a very advanced level. Established trends provide dozens of trading opportunities, but most trend indicators completely ignore them!
Stratos Pali Indicator is a revolutionary tool designed to enhance your trading strategy by accurately identifying market trends. This sophisticated indicator uses a unique algorithm to generate a complete histogram, which records when the trend is Long or Short. When a trend reversal occurs, an arrow appears, indicating the new direction of the trend. Important Information Revealed Leave a review and contact me via mql5 message to receive My Top 5 set files for Stratos Pali at no cost ! Do
ICT, SMC, SMART MONEY CONCEPTS, SMART MONEY, Smart Money Concept, Support and Resistance, Trend Analysis, Price Action, Market Structure, Order Blocks, BOS/CHoCH,   Breaker Blocks ,  Momentum Shift,   Supply&Demand Zone/Order Blocks , Strong Imbalance,   HH/LL/HL/LH,    Fair Value Gap, FVG,  Premium  &   Discount   Zones, Fibonacci Retracement, OTE, Buy Side Liquidity, Sell Side Liquidity, BSL/SSL Taken, Equal Highs & Lows, MTF Dashboard, Multiple Time Frame, BigBar, HTF OB, HTF Market Structure
Bu gösterge paneli, seçilen semboller için mevcut en son   harmonik kalıpları   gösterir, böylece zamandan tasarruf edersiniz ve daha verimli olursunuz /   MT4 sürümü . Ücretsiz Gösterge:   Basic Harmonic Pattern Gösterge sütunları Symbol :   seçilen semboller görünecektir Trend:   yükseliş veya düşüş Pattern :   desen türü (gartley, kelebek, yarasa, yengeç, köpekbalığı, cypher veya ABCD) Entry :   giriş fiyatı SL:   zararı durdur fiyatı TP1:   1. kar alma fiyatı TP2:   2. kar alma fiyatı
FX Volume MT5
Daniel Stein
4.93 (14)
Sabah Brifingimiz aracılığıyla ayrıntılar ve ekran görüntüleri ile günlük piyasa güncellemenizi alın burada mql5 ve on Telegram ! FX Volume, bir brokerin bakış açısından piyasa duyarlılığı hakkında GERÇEK bir fikir veren İLK ve TEK hacim göstergesidir. COT raporlarından çok daha hızlı bir şekilde, brokerlar gibi kurumsal piyasa katılımcılarının Forex piyasasında nasıl konumlandıklarına dair harika bilgiler sağlar. Bu bilgileri doğrudan grafiğinizde görmek, ticaretiniz için gerçek oyun değiştir
Matrix Arrow Indicator MT5
Juvenille Emperor Limited
5 (12)
Matrix Arrow Indicator MT5 ,   forex ,   emtialar ,   kripto   para birimleri ,   endeksler ,   hisse senetleri   gibi tüm sembollerde/araçlarda kullanılabilen   %100 yeniden boyamayan   çoklu zaman çerçevesi göstergesini izleyen benzersiz bir 10'u 1 arada trenddir.  Matrix Arrow Indicator MT5 , mevcut eğilimi erken aşamalarında belirleyecek ve aşağıdakiler gibi 10'a kadar standart göstergeden bilgi ve veri toplayacaktır: Ortalama Yönlü Hareket Endeksi (ADX) Emtia Kanal Endeksi (CCI) Klasik Hei
Advanced Supply Demand MT5
Bernhard Schweigert
4.5 (14)
Herhangi bir Acemi veya Uzman Tüccar için En İyi Çözüm! Bu gösterge benzersiz, yüksek kaliteli ve uygun fiyatlı bir ticaret aracıdır çünkü bir dizi tescilli özelliği ve yeni bir formülü bir araya getirdik. Bu güncelleme ile çift zaman dilimi dilimlerini gösterebileceksiniz. Yalnızca daha yüksek bir TF gösteremeyeceksiniz, aynı zamanda TF grafiğini ve ARTIK daha yüksek TF'yi de gösterebileceksiniz: YUVARLAK BÖLGELERİ GÖSTERMEK. Tüm Arz Talebi tüccarları buna bayılacak. :) Önemli Bilgiler Açıkland
Unlock key market insights with automated support and resistance lines Special Offer: Purchase now to receive free bonuses worth $75! (Read more for details) Tired of plotting support and resistance lines? This is a multi-timeframe indicator that detects and plots supports and resistance lines in the chart with the same precision as a human eye would. As price levels are tested over time and its importance increases, the lines become thicker and darker, making price leves easy to glance and ev
Gold Trend 5
Sergei Linskii
5 (1)
Altın Trend - bu iyi bir hisse senedi teknik göstergesidir. Gösterge algoritması, bir varlığın fiyat hareketini analiz eder ve oynaklığı ve potansiyel giriş bölgelerini yansıtır. En iyi gösterge sinyalleri: - SATIŞ için = kırmızı histogram + kırmızı KISA işaretçi + aynı yönde sarı sinyal oku. - AL için = mavi histogram + mavi UZUN işaretçi + aynı yönde aqua sinyal oku. Göstergenin faydaları: 1. Gösterge yüksek doğrulukta sinyaller üretir. 2. Onaylanmış bir ok sinyali yalnızca trend
TrendMaestro5
Stefano Frisetti
note: this indicator is for METATRADER4, if you want the version for METATRADER5 this is the link:  https://www.mql5.com/it/market/product/108106 TRENDMAESTRO ver 2.4 TRENDMAESTRO recognizes a new TREND in the bud, he never makes mistakes. The certainty of identifying a new TREND is priceless. DESCRIPTION TRENDMAESTRO identifies a new TREND in the bud, this indicator examines the volatility, volumes and momentum to identify the moment in which there is an explosion of one or more of these data a
Fiyat tersine döndükçe ve geri çekildikçe piyasa yapısından elde edilen kâr değişir. Piyasa yapısını tersine çevirme uyarısı göstergesi, bir trendin veya fiyat hareketinin ne zaman tükenmeye yaklaştığını ve tersine dönmeye hazır olduğunu tanımlar. Genellikle bir geri dönüş veya büyük bir geri çekilme meydana gelmek üzereyken meydana gelen piyasa yapısındaki değişiklikler konusunda sizi uyarır. Gösterge, olası bir tükenme noktasının yakınında her yeni yüksek veya düşük oluştuğunda, başlangıçta
ICT kavramını ticaret etmek için güvenilir bir gösterge arıyorsanız, ICT Piyasa Yapısı daha ileri düzey stratejiler kullanan yatırımcılar için bir kullanım kılavuzu sağlar. Bu hepsi bir arada gösterge, ICT Kavramlarına (Akıllı Para Kavramları) odaklanır. ICT Piyasa Yapısı, kurumların nasıl ticaret yaptığını anlamaya çalışır, hareketlerini tahmin etmeye yardımcı olur. Bu stratejiyi anlayarak ve kullanarak, yatırımcılar piyasa hareketleri hakkında değerli bilgiler edinebilir ve fiyat hareketine da
MetaForecast M5
Vahidreza Heidar Gholami
5 (2)
MetaForecast, fiyat verilerindeki harmonileri kullanarak herhangi bir piyasanın geleceğini tahmin eder ve görselleştirir. Piyasa her zaman tahmin edilemezken, fiyatlarda bir desen varsa, MetaForecast geleceği mümkün olduğunca doğru bir şekilde tahmin edebilir. Benzer ürünlere göre, MetaForecast piyasa eğilimlerini analiz ederek daha kesin sonuçlar üretebilir. Giriş Parametreleri Past size (Geçmiş boyut) MetaForecast'ın gelecekteki tahminler oluşturmak için kullandığı çubuk sayısını belirtir. M
Unlock hidden profits: accurate divergence trading for all markets Special Offer: Purchase now to receive free bonuses worth $90! (Read more for details) Tricky to find and scarce in frequency, divergences are one of the most reliable trading scenarios. This indicator finds and scans for regular and hidden divergences automatically using your favourite oscillator. [ Installation Guide | Update Guide | Troubleshooting | FAQ | All Products ] Easy to trade Finds regular and hidden divergences S
Yazarın diğer ürünleri
DBS Last
Dmitriy Burlachenko
5 (1)
A small utility displays the value of the last price (Last) to the right of the chart. The Last price is the price at which the last deal was executed. Utility is convenient to use for screens with small print, for visual observation of the price level (value) or for people with poor eyesight. You can customize: Growth color Fall color Text font Font size Offset text
FREE
Professional traders know that volume is the fuel for price movement. Large players try to hide their true intentions, but they can be recognized by volume bursts. The standard vertical volume does not show us specific price levels, but the cluster volume and especially its surges provide a very clear picture and specific price levels (areas). The DBS Cluster Search indicator searches for clusters of the specified size in tick data and highlights them with colored figures on the chart. These
DBS Delta
Dmitriy Burlachenko
The delta indicator is used to display the difference between the volume that passed on the exchange at the Ask price and above (market buys) and the volume that passed at the Bid price and below (market sales). This indicator shows the delta of each candle on the timeframe of your choice. The data is displayed as a colored histogram in a separate indicator window. The indicator is calculated from the tick history, therefore, to speed up the calculations and reduce the load on the system, the n
The indicator plots dynamic POC, VAH and VAL levels for a specified period from tick data. POC - Point Of Control, the price at which the maximum volume has accumulated over a certain period of time (POC in the volume profile). VA - Volume Area, the zone of the fair value of the asset. VAH - Volume Area High. VAL - Volume Area Low. The DBS_DynamicLevels indicator plots dynamic levels where the calculation point is the maximum volume level (POC) and zone VAH / VAL. The indicator shows the history
Filtrele:
jgomnet1969
24
jgomnet1969 2024.05.24 13:17 
 

Very good, but it could be improved so that it automatically updates daylight saving time depending on the user's location.

DrSeishin
259
DrSeishin 2022.03.04 09:40 
 

Thanks!

Norman McIver
745
Norman McIver 2021.08.11 20:59 
 

This is probably the most convenient and non intrusive time zone indicator on the market place. Thanks for publishing it :)

İncelemeye yanıt