Pivot Point Fibo RSJ
- Göstergeler
- JETINVEST
- Sürüm: 1.0
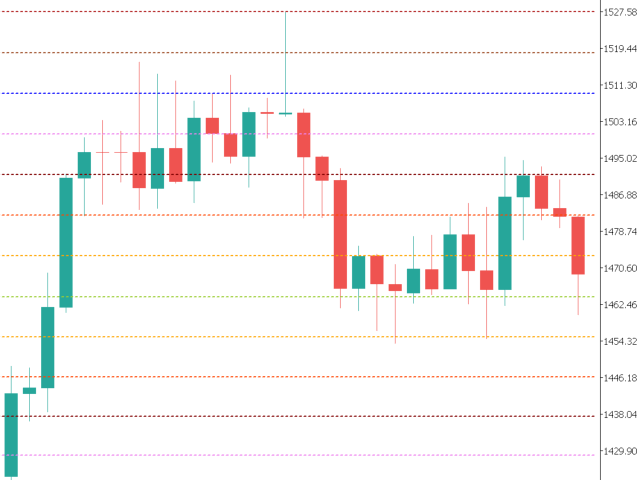
Pivot Point Fibo RSJ, Fibonacci oranlarını kullanarak günün destek ve direnç çizgilerini izleyen bir göstergedir.
Bu muhteşem gösterge, Fibonacci oranlarını kullanarak Pivot Point üzerinden 7 seviyeye kadar destek ve direnç oluşturur.
Fiyatların, bir operasyonun olası giriş/çıkış noktalarını algılamanın mümkün olduğu bu destek ve direncin her bir düzeyine uyması harika.
Özellikleri
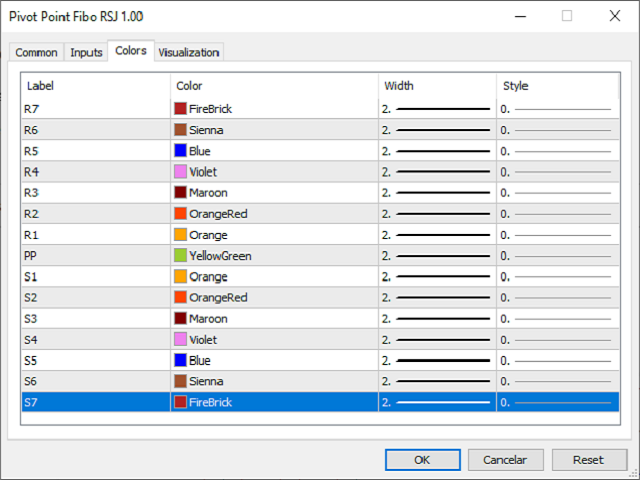
- 7 seviyeye kadar destek ve 7 seviye direnç
- Seviyelerin renklerini ayrı ayrı ayarlayın
Girişler
- Pivot Tipi
- Pivot Fibo RSJ1 = Fibo oranı 1 Hesaplama
- Pivot Fibo RSJ2 = Fibo oranı 2 Hesaplaması
- Pivot Fibo RSJ3 = Fibo oranı 3 Hesaplama
- Pivot Fibo Classic = Klasik Pivot Hesaplaması
- Minimum Pivot Düzeyleri
- Pivot 3 Düzey
- Pivot 4 Düzey
- Pivot 5 Düzey
- Pivot 6 Seviye
- Pivot 7 Seviye
Hâlâ sorularınız varsa lütfen doğrudan mesajla bana ulaşın: https://www.mql5.com/tr/users/robsjunqueira/


cool