• Genel bakış
  • İncelemeler
  • Yorumlar
  • Yenilikler

Abiroid Slopes Histogram

Abiroid Multi Slope indicator allows you to calculate a Slope Histogram for any line of any indicator.

Histogram is for 1 slope line only, but slope values can be calculated for 3 lines total.

To have multiple histograms, add as many Slope indicators for custom indicators as you like on chart.

You just need to provide the Indicator name, buffer value, slope's period and max number of bars back.

By default it has slope calculation for TDI_v4.ex4 indicator.

There is no way to specify parameters for your Custom Indicator.

So it is best if you have mq4 file for Custom Indicator so you can set params directly inside it.


For detailed info and for extra indicators:

https://abiroid.com/indicators/abiroid-slopes-histogram


Settings:

  • Main Indicator:Any ex4 with a path relative to MQL4/Indicators folder. Default TDI_v4.ex4 is placed inside MQL4/Indicators/TDI folder. So default specified value is "TDI/TDI_v4"

In order to calculate slope, you need to specify any Custom indicator for which you have an ex4.

Note: This does not work for Metatrader's in-built indicators, unless you have an ex4 file for them.

Also there is no way to specify parameters for the custom indicator.

So it will be good if you have mq4 of this Main Indicator, to directly change parameters in your custom indicator.

  • MaxPastBars:Total number of past bars for which slope is calculated.
  • Shift:Starting bar from which slope histogram is calculated. Suppose Shift is 0, it will start at candle 0.
  • Refresh After Ticks:Refresh Slope value every few ticks. Keep this higher, in case your Main Indicator is heavy, or else over-calculation might make MT4 hang.

Slope Params:

Total 3 slopes can be calculated: Namely A,B,C. By default Slopes are for RSI, TSL and MBL for TDI. Just as an example.


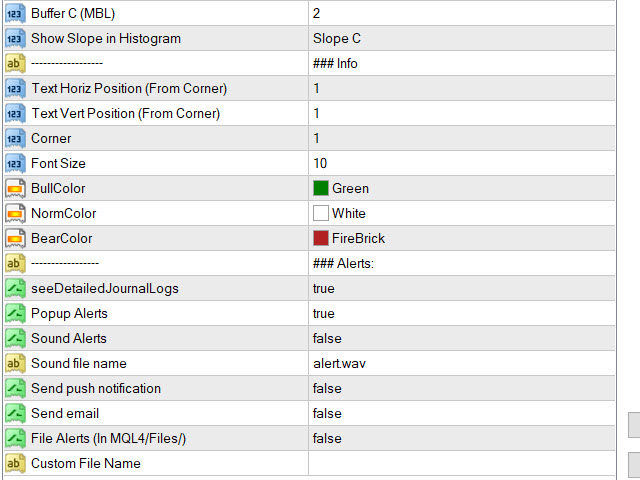
Default Slope for TDI's MBL Line.

  • Level High:High Level above which Slope in Histogram is marked Green (In above slope it's set at 20)
  • Level Low:Low levels below which Slope is marked Red (In above slope it's set at -20)
  • Slope Period:How many bars between 2 points of the slope.

Suppose you are calculating slope of a Moving Average. This red line is a 50-period Moving Average.ex4

And you need the slope of 2 points 25 bars apart. Then you need to specify 25 as slope period.

  • Slope Unit: If Slope unit is vertical distance between 2 points for Slope calculation. For TDI, and slope calculations of RSI, MBL and TSL, the unit is best kept at 0.01.

But when using a Moving average, the price point is used as a unit. If you keep Slope Unit as 0, it will use the Pair's Point as default.

For example: EURUSD, point is 0.00001. USDJPY point is 0.001

  • Buffer:The buffer for the line for which you need slope. Best is to check the mq4 code for your Custom Indicator. Because buffers are sometimes hidden.

Or if you only have ex4, then use the Data Window to find the Buffer. Note buffer count starts at 0.

In TDI_v4:

Actual RSI line is buffer 4. Which is why it's always advisable to use mq4 files of your Custom Indicator. If slope histogram feels incorrect, most likely cause is that you have an incorrect buffer.

  • Show Slope in Histogram:At a time only 1 slope will be visible in a Histogram. But you can add as this Slope indicator as many times to chart as you like. To get multiple histograms.
  • Show Slope Info:Set position, corner, font, color, etc. for displaying the slope info for slopes A,B,C
  • Alerts:Get Popup, mobile Notifications, email, file etc. alerts


Conclusion:

Slope calculations are very useful in your Indicators and EAs where you need to know the direction a line is taking. For instance an upwards MA indicates UpTrend and downwards MA slope indicates downtrend.

The Slopes for Bollinger Bands on the other hand can indicate if market is trending, if upper band is sloping upwards and downwards band is sloping downwards.

Or if market is ranging, if both band slopes are flattening out. Another good example is Slope of COG center band, which will indicate to trade Buy only if COG bands are moving upwards. And a lot of other such great useful scenarios.

Önerilen ürünler
TrendPlus
Sivakumar Subbaiya
4.08 (12)
Trend Plus   Trendplus  Indicator   Time Frame: Suitable for any time frame.  Purpose: Trend Prediction. Blue and red candle indicate the buy and sell call respectively. Buy: When the blue candle is formed buy call is initiated. close the buy trades when the next red candle will formed.   Sell: When the Red candle is formed Sell call is initiated. close the Sell trades when the next blue candle will formed.   Happy trade!!
FREE
Are you tired of drawing trendlines every time you're analyzing charts? Or perhaps you would like more consistency in your technical analysis. Then this is for you. This indicator will draw trend lines automatically when dropped on a chart. How it works Works similar to standard deviation channel found on mt4 and mt5. It has 2 parameters: 1. Starting Bar 2. Number of bars for calculation The   starting bar   is the bar which drawing of the trend lines will begin, while the   number of bars for c
FREE
HMA Trend
Pavel Zamoshnikov
4.6 (67)
A trend indicator based on the Hull Moving Average (HMA) with two periods. The Hull Moving Average is an improved variant of the moving average, which shows the moment of trend reversal quite accurately. It is often used as a signal filter. Combination of two types of Hull Moving Averages makes a better use of these advantages: HMA with a slow period identifies the trend, while HMA with a fast period determines the short-term movements and signals in the trend direction. Features The movement
FREE
Free automatic Fibonacci is an indicator that automatically plots a Fibonacci retracement based on the number of bars you select on the BarsToScan setting in the indicator. The Fibonacci is automatically updated in real time as new highest and lowest values appears amongst the selected bars. You can select which level values to be displayed in the indicator settings. You can also select the color of the levels thus enabling the trader to be able to attach the indicator several times with differe
FREE
Traditional MACD MT4
Daniel Lewis
4.59 (56)
MACD indicator in MetaTrader 4/5 looks different than MACD does in most other charting software. That is because the MetaTrader 4/5 version of MACD displays the MACD line as a histogram when it is traditionally displayed as a line. Additionally, the MetaTrader 4/5 version computes the Signal line using an SMA, while according to MACD definition it is supposed to be an EMA. The MetaTrader 4/5 version also does not compute a true MACD Histogram (the difference between the MACD/Signal lines). This
FREE
Email Drawdown Alert
Roman Starostin
5 (12)
Free informative Indicator-helper. It'll be usefull for traders who trade many symbols or using grid systems (Averaging or Martingale). Indicator counts drawdown as percent and currency separate. It has a number of settings: Count deposite drawdown according equity value and send e-mail or notifications to user if DD more than set; Sending e-mail when max open orders reached; Shows price and remaining pips amount before MarginCall on current chart and Account generally; Display summary trade lot
FREE
Follow The Line
Oliver Gideon Amofa Appiah
4.07 (14)
FOLLOW THE LINE GET THE FULL VERSION HERE: https://www.mql5.com/en/market/product/36024 This indicator obeys the popular maxim that: "THE TREND IS YOUR FRIEND" It paints a GREEN line for BUY and also paints a RED line for SELL.  It gives alarms and alerts of all kinds. IT DOES NOT REPAINT and can be used for all currency pairs and timeframes. Yes, as easy and simple as that. Even a newbie can use it to make great and reliable trades. NB: For best results, get my other premium indicators for more
FREE
Rainbow MT4 is a technical indicator based on Moving average with period 34 and very easy to use. When price crosses above MA and MA changes color to green, it’s a signal to buy. When price crosses below MA and MA changes color to red, it’s a signal to sell. The Expert advisor ( Rainbow EA MT4) based on Rainbow MT4 indicator, as you can see in the short video below is now available here .
FREE
Introducing the Consecutive Green/Red Candle Alert Indicator for MT4 - Your Trend Spotting Companion! Are you ready to take your trading to the next level? We present the Consecutive Green/Red Candle Alert Indicator, a powerful tool designed to help you spot trends and potential reversals with ease. Whether you're a new trader looking for clarity in the market or an experienced pro seeking additional confirmation, this indicator is your trusted companion. Key Features of the Consecutive Green/Re
FREE
Trend arrow Indicator
NGUYEN NGHIEM DUY
3.33 (9)
Trend arrow Indicator is an arrow Indicator used as an assistant tool for your trading strategy. The indicator analyzes the standard deviation of bar close for a given period and generates a buy or sell signals if the deviation increases. It good to combo with Martingale EA to follow Trend and Sellect Buy Only/Sell Only for EA work Semi-Automatic. You can use this  Indicator with any EAs in my Products.
FREE
This scanner shows the trend values of the well known indicator SuperTrend for up to 30 instruments and 8 time frames. You can get alerts via MT4, Email and Push-Notification as soon as the direction of the trend changes. This is the FREE version of the indicator: SuperTrend Scanner The free version works only on EURUSD and GBPUSD! Important Information How you can maximize the potential of the scanner, please read here: www.mql5.com/en/blogs/post/718074 With the following FREE indicator you
FREE
MegaTrends
Sivakumar Subbaiya
1 (1)
Megatrends  Indicator   Time Frame: Suitable for any time frame.  Purpose: Trend Prediction. Blue and red color indicate the buy and sell call respectively. Buy: When the blue line is originating it is opened buy call. Sell: When the Red line is origination it is opened sell call Happy trade!! this indicator is suitable for all time frame, but our recommended time frame to use 1hour and 4 hours, suitable for any chart.
FREE
The MT4 indicator that we are describing is designed to provide traders with an alert, notification, and email when Fibonacci levels are crossed. The Fibonacci levels are calculated based on the zigzag indicator, which helps to identify potential trend reversals in the market. When the indicator detects that a price has crossed a Fibonacci level, it will trigger an alert and send a notification to the trader's MT4 mobile app. Additionally, the indicator can be configured to send an email to the
FREE
OrderBlock TS Roman
Vladislav Vlastovskii
3.8 (5)
Индикатор строит блоки заказов (БЗ) по торговой системе (ТС) Романа. Поиск блоков осуществляется одновременно на двух таймфремах: текущем и старшем (определяемым в настройках). Для оптимизации и игнорирования устаревших блоков в настройках задается ограничение количества дней в пределах которых осуществляется поиск блоков. Блоки строятся по правилам ТС состоящем из трех шагов: какую свечу вынесли (что?); какой свечой вынесли (чем?); правило отрисовки (как?).
FREE
Discover the power of precision and efficiency in your trading with the " Super Auto Fibonacci " MT4 indicator. This cutting-edge tool is meticulously designed to enhance your technical analysis, providing you with invaluable insights to make informed trading decisions. Key Features: Automated Fibonacci Analysis: Say goodbye to the hassle of manual Fibonacci retracement and extension drawing. "Super Auto Fibonacci" instantly identifies and plots Fibonacci levels on your MT4 chart, saving you tim
FREE
FREE FOR A LIMITED TIME ONLY!!! The Ultimate Indicator For Trading Trend This indicator clearly shows you the strength of the market in one direction or the other, which means that you can trade knowing you are either with or against the market. When used in conjunction with the +3R principles you are sure to have some serious results. The +3R Principles Routine - This is when you trade and how often  Rules - This is the rule you follow  Risk:Reward - This is the percentage amount of your accoun
FREE
Tipu Heikin Ashi Panel
Kaleem Haider
4.56 (18)
Tipu Heikin-Ashi Panel is the modified version of the original Heiken Ashi indicator published by MetaQuotes here . A professional version of this indicator is available here . Features An easy to use Panel that shows the Heiken Ashi trend of selected timeframe. Customizable Buy/Sell alerts, push alerts, email alerts, or visual on-screen alerts. Customizable Panel. The panel can be moved to any place on the chart or minimized to allow more space. Heikin means "the average", and Ashi means "foo
FREE
Wise Men Indicator demo
Bohdan Kasyanenko
3 (2)
The indicator displays signals according to the strategy of Bill Williams on the chart. Demo version of the indicator has the same features as the paid, except that it can work only on a demo account . Signal "First Wise Man" is formed when there is a divergent bar with angulation.  Bullish divergent bar - with lower minimum and closing price in the upper half. Bearish divergent bar - higher maximum and the closing price at the bottom half. Angulation is formed when all three lines of Alligat
FREE
Trend Rising SDEA MT4
Wan Mohd Safwan Bin Wan Daud
Trend Rising, özel bir MT4 (Metatrader 4) göstergesidir, birden fazla zaman dilimine dayalı Bill William Göstergelerini kullanarak trendi ve momentum modelini analiz eden TF M30 ve altı ölçeklendirme için en iyi şekilde kullanın. Sonuç olarak, çoğu döviz çiftinde işe yarayan trendin başlangıcını ve sonunu tanımlar. Trend Yükselen göstergesi, Hızlandırıcı Osilatörü ve Müthiş Göstergeye dayalı olarak geliştirilmiştir. Ana Özellikler  Trendin başlangıcını ve bitişini renkli ekran olarak belir
FREE
This indicator alerts you when/before new 1 or 5 minute bar candle formed. In other words,this indicator alerts you every 1/5 minutes. This indicator is especially useful for traders who trade when new bars formed. *This indicator don't work propery in strategy tester.Use this in live trading to check functionality. There is more powerful Pro version .In Pro version,you can choose more timeframe and so on. Input Parameters Alert_Or_Sound =Sound ----- Choose alert or sound or both to not
FREE
UPD1 Rsi Dots Dashboard
Vitaliy Kuznetsov
5 (1)
Gösterge, grafikteki terminal RSI osilatörüne dayalı sinyalleri gösterir. Tekrarlanan sinyalleri filtrelemek mümkündür. Burada osilatör bir ters sinyal aramak için kullanılır. Salıncak stratejilerinde ve seviyelerden alım satımda bir giriş noktası olarak önerilir. Çok para birimli gösterge tablosu mevcuttur. Bununla birlikte, grafikler arasında kolayca geçiş yapabilirsiniz. Ürün tartışmalarında, panoyu yerleştirebileceğiniz bir algoritma önerebilirsiniz. Giriş parametreleri. Ana Ayarlar
FREE
Fiyat Dalga Modeli   MT4 --(ABCD Modeli)--   hoş geldiniz     ABCD modeli, teknik analiz dünyasında güçlü ve yaygın olarak kullanılan bir ticaret modelidir. Tüccarların piyasadaki potansiyel alım ve satım fırsatlarını belirlemek için kullandıkları uyumlu bir fiyat modelidir. ABCD modeliyle, tüccarlar potansiyel fiyat hareketlerini tahmin edebilir ve alım satımlara ne zaman girip çıkacakları konusunda bilinçli kararlar verebilir. EA Sürümü :   Price Wave EA MT4 MT5 sürümü:   Price Wave Pat
FREE
QuantumAlert RSI Navigator is a free indicator available for MT4/MT5 platforms, its work is to provide "alerts" when the market is inside "overbought and oversold" regions in the form of "buy or sell" signals. This indicator comes with many customization options mentioned in the parameter section below, user can customise these parameters as needful. Join our   MQL5 group , where we share important news and updates. You are also welcome to join our private channel as well, contact me for the pri
FREE
Adjustable Fractal MT4
Dmitry Timin
4.74 (23)
Adjustable Fractal MT4 is a modification of Bill Williams' Fractals indicator. The fractal consists of a two sets of arrows - up (upper fractals) and down (lower fractals). Each fractal satisfies the following conditions: Upper fractal - maximum (high) of a signal bar exceeds or is equal to maximums of all bars from the range to the left and to the right; Lower fractal - minimum (low) of a signal bar is less or equal to minimums of all bars from the range to the left and to the right. Unlike a s
FREE
Check my paid tools they work great and I share Ea's based on them for free please r ate The Dual Timeframe RSI (Relative Strength Index) indicator is a novel trading tool that allows traders to monitor RSI readings from two different timeframes on a single chart. This dual perspective enables traders to identify potential trend confirmations and divergences more effectively. For instance, a trader might use a 1-hour RSI alongside a daily RSI to ensure that short-term trades align with the bro
FREE
TSO Stochastic RSI
Dionisis Nikolopoulos
4.33 (3)
Stochastic RSI makes a stochastic calculation on the RSI indicator. The Relative Strength Index (RSI) is a well known momentum oscillator that measures the speed and change of price movements, developed by J. Welles Wilder. Features Find overbought and oversold situations. Sound alert when overbought/oversold level is reached. Get email and/or push notification alerts when a signal is detected. The indicator is non-repainting. Returns buffer values for %K and %D to be used as part of an EA . (
FREE
Wicks UpDown Target GJ Wicks UpDown Target GJ is specialized in GJ forex pairs. Choppy movement up and down on the opening range every day.  Trading breakouts on London session and New York session is recommended. Guideline Entry Strategy Idea: Step 1 - Breakout Forming (Warning! Trade on London Session and New York Session) Step 2 - Breakout Starting (Take Action on your trading plan) Step 3 - Partial Close your order & set breakeven (no-risk) Step 4 - Target complete Step 5 - Don't tr
FREE
Trend Yakalayıcı: Alarm İndikatörü ile Trend Yakalayıcı Stratejisi, piyasa trendlerini ve potansiyel giriş ve çıkış noktalarını belirlemede yardımcı olan çok yönlü bir teknik analiz aracıdır. Piyasa koşullarına uyum sağlayarak trend yönünün net görsel temsili için dinamik bir Trend Yakalayıcı Stratejisi sunar. Tüccarlar tercihlerine ve risk toleranslarına göre parametreleri özelleştirebilirler. Gösterge, trendleri tanımlamaya yardımcı olur, potansiyel ters dönüşleri sinyaller, trailing stop m
FREE
The MACD (Moving Average Convergence Divergence) indicator is one of the most widely used technical analysis tools by traders worldwide. Created by Gerald Appel in the 1970s, the MACD is an indicator that helps investors identify the trend direction, trend strength, and possible trend reversal points. The MACD indicator is composed of a histogram that shows the difference between the 12-period exponential moving average and the 26-period exponential moving average. The top part of the histogram
FREE
It is just an alternative fibo lines, because mt4 have is a very strange drawing of fibo lines A simple Box (Rectangle) graphic element with adjustable levels binding: it is possible to specify up to 17 custom levels, all rectangles on the chart with the given prefix in their name are processed. Levels are specified in % of the height of the rectangle. A convenient graphical element for analyzing charts by growth-correction levels. Enjoy your work!
FREE
Bu ürünün alıcıları ayrıca şunları da satın alıyor
Gann Made Easy
Oleg Rodin
4.85 (82)
Gann Made Easy , bay teorisini kullanarak ticaretin en iyi ilkelerine dayanan, profesyonel ve kullanımı kolay bir Forex ticaret sistemidir. WD Gann. Gösterge, Zararı Durdur ve Kâr Al Seviyeleri dahil olmak üzere doğru SATIN AL ve SAT sinyalleri sağlar. PUSH bildirimlerini kullanarak hareket halindeyken bile işlem yapabilirsiniz. Lütfen satın aldıktan sonra benimle iletişime geçin! Alım satım ipuçlarımı ve harika bonus göstergelerini ücretsiz olarak sizinle paylaşacağım! Muhtemelen Gann ticaret y
TPSpro RFI Levels
Roman Podpora
4.82 (22)
Reversal First Impulse levels (RFI)    INSTRUCTIONS        RUS       -       ENG              R ecommended to use with an indicator   -   TPSpro  TREND PRO -  Version MT5 A key element in trading is zones or levels from which decisions to buy or sell a trading instrument are made. Despite attempts by major players to conceal their presence in the market, they inevitably leave traces. Our task was to learn how to identify these traces and interpret them correctly. Main functions: Displaying activ
Atomic Analyst
Issam Kassas
5 (2)
Öncelikle belirtmek gerekir ki bu Ticaret Göstergesi Yeniden Çizim Yapmaz, Gecikmez ve Gecikme Göstermez, bu da hem manuel hem de robot ticareti için ideal hale getirir. Kullanıcı kılavuzu: ayarlar, girişler ve strateji. Atom Analisti, Piyasada Daha İyi Bir Avantaj Bulmak İçin Fiyatın Gücünü ve Momentumunu Kullanan PA Fiyat Hareketi Göstergesidir. Gürültüleri ve Yanlış Sinyalleri Kaldırmaya ve Ticaret Potansiyelini Artırmaya Yardımcı Olan Gelişmiş Filtrelerle Donatılmıştır. Birden fazla katma
Gold Stuff
Vasiliy Strukov
4.89 (238)
Gold Stuff, özellikle altın için tasarlanmış bir trend göstergesidir ve herhangi bir finansal enstrümanda da kullanılabilir. Gösterge yeniden çizilmez ve gecikmez. Önerilen zaman dilimi H1. Bu göstergede tam otomatik Uzman Danışman EA Gold Stuff çalışır. Profilimde bulabilirsiniz. Ayarları ve kişisel bir bonusu almak için satın alma işleminden hemen sonra benimle iletişime geçin!  Güçlü Destek ve Trend Tarayıcı göstergemizin ücretsiz bir kopyasını pm'den alabilirsiniz. Ben! AYARLAR Ok Ç
Trend Punch
Mohamed Hassan
4.95 (19)
This indicator is unstoppable when combined with our other indicator called  Support & Resistance . After purchase, send us a message and you will get it   for  FREE as a BONUS! Introducing Trend Punch , the revolutionary forex trend indicator that will transform the way you trade! Trend Punch is uniquely designed to provide precise buy and sell arrows during strong market trends, making your trading decisions clearer and more confident. Whether you're trading major currency pairs or exotic sym
TPSproTREND PrO
Roman Podpora
4.79 (19)
TPSpro TREND PRO,   piyasayı otomatik olarak analiz eden, trend ve değişimlerinin her biri hakkında bilgi sağlayan, ayrıca yeniden çizmeden işlemlere girme sinyalleri veren bir trend göstergesidir! Gösterge her mumu ayrı ayrı analiz ederek kullanır. farklı dürtülere atıfta bulunur - yukarı veya aşağı dürtü. Para birimleri, kripto paralar, metaller, hisse senetleri ve endeksler için işlemlere tam giriş noktaları! Sürüm MT5                   GÖSTERGENİN TAM AÇIKLAMASI       Bunu -   RFI SEVİYELER
Scalper Inside PRO
Alexey Minkov
4.73 (56)
An exclusive indicator that utilizes an innovative algorithm to swiftly and accurately determine the market trend. The indicator automatically calculates opening, closing, and profit levels, providing detailed trading statistics. With these features, you can choose the most appropriate trading instrument for the current market conditions. Additionally, you can easily integrate your own arrow indicators into Scalper Inside Pro to quickly evaluate their statistics and profitability. Scalper Inside
FX Power MT4 NG
Daniel Stein
5 (12)
Sabah Brifingimiz burada mql5 ve on Telegram! FX Power MT4 NG , uzun zamandır çok popüler olan döviz gücü ölçerimiz FX Power'ın yeni neslidir. Peki bu yeni nesil güç ölçer ne sunuyor? Orijinal FX Power hakkında sevdiğiniz her şey PLUS GOLD/XAU güç analizi Daha da hassas hesaplama sonuçları Ayrı ayrı yapılandırılabilir analiz dönemleri Daha da iyi performans için özelleştirilebilir hesaplama limiti Özel çokluDaha fazlasını görmek isteyenler için örnek ayarlar Her grafikte en sevdiğiniz renkler i
Trend Screener
STE S.S.COMPANY
4.8 (87)
Trend Göstergesi, Trend Alım Satım ve Filtreleme için Çığır Açan Benzersiz Çözüm, Tüm Önemli Trend Özellikleriyle Tek Bir Araç İçinde Yerleştirildi! Forex, emtialar, kripto para birimleri, endeksler ve hisse senetleri gibi tüm sembollerde/araçlarda kullanılabilen %100 yeniden boyamayan çoklu zaman çerçevesi ve Çoklu para birimi göstergesidir. SINIRLI SÜRELİ TEKLİF: Destek ve Direnç Tarama Göstergesi sadece 50$ ve ömür boyu mevcuttur. (Orijinal fiyat 250$) (teklif uzatıldı) Trend Screener, grafik
Şu anda %20 İNDİRİMLİ! Herhangi bir Acemi veya Uzman Tüccar için En İyi Çözüm! Bu gösterge paneli yazılımı 28 döviz çifti üzerinde çalışıyor. Ana göstergelerimizden 2'sine (Gelişmiş Para Birimi Gücü 28 ve Gelişmiş Para Birimi Dürtüsü) dayanmaktadır. Tüm Forex piyasasına harika bir genel bakış sağlar. Gelişmiş Para Birimi Gücü değerlerini, para birimi hareket hızını ve tüm (9) zaman dilimlerinde 28 Forex çifti için sinyalleri gösterir. Trendleri ve / veya scalping fırsatlarını belirlemek içi
FX Volume
Daniel Stein
4.58 (33)
Sabah Brifingimiz aracılığıyla ayrıntılar ve ekran görüntüleri ile günlük piyasa güncellemenizi alın burada mql5 ve on Telegram ! FX Volume, bir brokerin bakış açısından piyasa duyarlılığı hakkında GERÇEK bir fikir veren İLK ve TEK hacim göstergesidir. COT raporlarından çok daha hızlı bir şekilde, brokerlar gibi kurumsal piyasa katılımcılarının Forex piyasasında nasıl konumlandıklarına dair harika bilgiler sağlar. Bu bilgileri doğrudan grafiğinizde görmek, ticaretiniz için gerçek oyun değiştir
ŞU ANDA %31 INDIRIMLI !!! Yeni Başlayanlar veya Uzman Tüccarlar için En İyi Çözüm! Bu gösterge benzersiz, yüksek kaliteli ve uygun fiyatlı bir ticaret aracıdır çünkü bir dizi tescilli özellik ve gizli bir formül ekledik. Yalnızca BİR grafikle 28 döviz çiftinin tümü için Uyarılar verir. Yeni bir trendin veya scalping fırsatının tam tetik noktasını belirleyebildiğiniz için ticaretinizin nasıl gelişeceğini hayal edin! Yeni temel algoritmalar üzerine inşa edilen bu sistem, potansiyel işlemler
Enigmera
Ivan Stefanov
5 (3)
ENIGMERA: Pazarın çekirdeği https://www.enigmera.com Giriş Bu gösterge ve ticaret sistemi, finansal piyasalar için dikkate değer bir yaklaşımdır. ENIGMERA, destek ve direnç seviyelerini doğru bir şekilde hesaplamak için fraktal döngüleri kullanır. Gerçek birikim aşamasını gösterir ve yön ve hedefler verir.  İster bir trendde ister bir düzeltmede olalım çalışan bir sistem.  Nasıl çalışır? ENIGMERA üç çizgiden oluşur: destek/direnç çizgisi, hedef çizgisi ve sapma çizgisi. Sistem, geçmiş veril
- Real price is 80$ - 40% Discount ( It is 49$ now ) Contact me for instruction, add group and any questions! Related EA Product: Bitcoin Expert Introduction The breakout and retest strategy is traded support and resistance levels. it involves price breaking through a previous level.  The break and retest strategy is designed to help traders do two main things, the first is to avoid false breakouts. Many false breakouts start with a candlestick that breaks out of a level but ends with an immedi
Chart Patterns All-in-One göstergesi, traderların teknik analizde yaygın olarak kullanılan çeşitli grafik desenlerini görselleştirmelerine yardımcı olur. Bu gösterge, potansiyel piyasa hareketlerini belirlemeye yardımcı olur ancak kârlılığı garanti etmez. Satın almadan önce göstergeyi demo modunda test etmeniz önerilir. Mevcut Teklif : "Chart Patterns All in One" göstergesinde %50 indirim. Dahil Edilen Desenler : 1-2-3 Deseni : Üç önemli nokta (yüksekler veya düşükler) kullanarak piyasa tersine
ŞU ANDA %26 INDIRIMLI Yeni Başlayanlar veya Uzman Tüccarlar için En İyi Çözüm! Bu Gösterge benzersiz, yüksek kaliteli ve uygun fiyatlı bir ticaret aracıdır çünkü bir dizi tescilli özellik ve yeni bir formül ekledik. Sadece BİR grafik ile 28 Forex çifti için Döviz Gücünü okuyabilirsiniz! Yeni bir trendin veya scalping fırsatının tam tetik noktasını belirleyebildiğiniz için ticaretinizin nasıl gelişeceğini hayal edin? Kullanım kılavuzu: buraya tıklayın Bu ilk olan, orijinal! Değersiz bir
Fiyat tersine döndükçe ve geri çekildikçe piyasa yapısından elde edilen kâr değişir. Piyasa yapısını tersine çevirme uyarısı göstergesi, bir trendin veya fiyat hareketinin ne zaman tükenmeye yaklaştığını ve tersine dönmeye hazır olduğunu tanımlar. Genellikle bir geri dönüş veya büyük bir geri çekilme meydana gelmek üzereyken meydana gelen piyasa yapısındaki değişiklikler konusunda sizi uyarır. Gösterge, olası bir tükenme noktasının yakınında her yeni yüksek veya düşük oluştuğunda, başlangıçta
Bomb Bank Signal
Igor Pereira Calil
5 (1)
Bomb Bank Signal: Your Trusted Indicator for MetaTrader 4 The Bomb Bank Signal is a powerful indicator for MetaTrader 4, designed to identify the most relevant trends in the financial market. If you are looking for a tool that accurately anticipates movements, Bomb Bank is the ally you need. How it Works: This indicator combines three distinct methods – volume analysis, candle closes and symmetrical trend – to detect and signal buying and selling opportunities. Bomb Bank is like a "bomb"
Trend Cutter
Oleg Rodin
5 (2)
Trend Cutter, M1 ve M5 gibi daha düşük zaman dilimleri de dahil olmak üzere herhangi bir zaman diliminde kullanılabilen bir trend göstergesidir. Gösterge, gün içi ticareti tercih eden yatırımcılar için idealdir ve uzun vadeli ticareti tercih edenlere de yardımcı olacaktır. Bu göstergeyi ticaret sisteminiz için bir temel olarak veya bağımsız bir ticaret çözümü olarak kullanabilirsiniz. Gösterge, PUSH bildirimleri de dahil olmak üzere her türlü uyarıyı sağlar. Göstergenin kullanımı çok kolaydır. S
TakePropips Donchian Trend Pro
Eric John Pajarillaga Aldana
4.44 (16)
TakePropips Donchian Trend Pro   (MT4), Donchian Kanalı'nı kullanarak trendin yönünü otomatik olarak tespit eden ve size ticarete giriş ve çıkış sinyalleri sağlayan güçlü ve etkili bir araçtır! Bu çok işlevli gösterge, bir trend tarayıcı, ticaret sinyalleri, istatistiksel panel, tarayıcı, ticaret oturumları ve uyarı geçmişi panosu içerir. Size ticaret sinyalleri sağlamak ve çizelgeleri analiz ederek saatlerce tasarruf etmenizi sağlamak için tasarlanmıştır! Kullanım kılavuzunu ve kurulum kılavuzu
IX Power MT4
Daniel Stein
5 (5)
IX Power nihayet FX Power'ın rakipsiz hassasiyetini Forex dışı sembollere getiriyor. En sevdiğiniz endeksler, hisse senetleri, emtialar, ETF'ler ve hatta kripto para birimlerindeki kısa, orta ve uzun vadeli eğilimlerin yoğunluğunu doğru bir şekilde belirler. Terminalinizin sunduğu her şeyi analiz edebilirsiniz. Deneyin ve işlem yaparken zamanlamanızın nasıl önemli ölçüde iyileştiğini deneyimleyin. IX Power Temel Özellikler 100 hassas, yeniden boyanmayan hesaplama sonuçları - terminalini
Stratos Pali Indicator   is a revolutionary tool designed to enhance your trading strategy by accurately identifying market trends. This sophisticated indicator uses a unique algorithm to generate a complete histogram, which records when the trend is Long or Short. When a trend reversal occurs, an arrow appears, indicating the new direction of the trend. Important Information Revealed Leave a review and contact me via mql5 message to receive My Top 5 set files for Stratos Pali at no cost! D
Gold Channel is a volatility-based indicator, developed with a specific timing algorithm for the XAUUSD pair, which consists of finding possible corrections in the market. This indicator shows two outer lines, an inner line (retracement line) and an arrow sign, where the theory of the channel is to help identify overbought and oversold conditions in the market. The market price will generally fall between the boundaries of the channel. If prices touch or move outside the channel it is a tra
Advanced Supply Demand
Bernhard Schweigert
4.91 (294)
CURRENTLY 26% OFF !! Best Solution for any Newbie or Expert Trader! This indicator is a unique, high quality and affordable trading tool because we have incorporated a number of proprietary features and a new formula. With this update, you will be able to show double timeframe zones. You will not only be able to show a higher TF but to show both, the chart TF, PLUS the higher TF: SHOWING NESTED ZONES. All Supply Demand traders will love it. :) Important Information Revealed Maximize the potenti
Grafiğinizde otomatik olarak destek ve direnç seviyeleri PLUS itici mum boşlukları çizin, böylece fiyatın nereye gidebileceğini ve / veya potansiyel olarak tersine dönebileceğini görebilirsiniz. Bu gösterge, web sitemde (The Market Structure Trader) öğretilen pozisyon ticareti metodolojisinin bir parçası olarak kullanılmak üzere tasarlanmıştır ve hedefleme ve potansiyel girişler için temel bilgileri görüntüler. Göstergede 2 TEMEL özellik ve 4 ek özellik bulunmaktadır: TEMEL ÖZELLİK 1 - Günl
Currency Strength Wizard , başarılı ticaret için size hepsi bir arada çözüm sağlayan çok güçlü bir göstergedir. Gösterge, birden çok zaman dilimindeki tüm para birimlerinin verilerini kullanarak şu veya bu forex çiftinin gücünü hesaplar. Bu veriler, şu veya bu para biriminin gücünü görmek için kullanabileceğiniz, kullanımı kolay para birimi endeksi ve para birimi güç hatları biçiminde temsil edilir. İhtiyacınız olan tek şey, işlem yapmak istediğiniz tabloya göstergeyi eklemektir ve gösterge size
Order Block Hunter
Noha Mohamed Fathy Younes Badr
5 (4)
Order block hunter indicator is the best indicator for  hunt the order blocks that area where there has been a large concentration of limit orders waiting to be executed Order blocks are identified on a chart by observing previous price action and looking for areas where the price experienced significant movement or sudden changes in direction .This indicator does that for you by using very complicated codes and helps you to take the best areas To buy and sell because it make marks at the best a
Bu gösterge panosu, piyasa yapısını tersine çevirme göstergesiyle kullanım için bir uyarı aracıdır. Birincil amacı, belirli zaman dilimlerinde geri dönüş fırsatları ve ayrıca göstergenin yaptığı gibi uyarıların yeniden test edilmesi (onay) konusunda sizi uyarmaktır. Pano, kendi başına bir grafik üzerinde oturacak ve seçtiğiniz çiftler ve zaman dilimlerinde size uyarılar göndermek için arka planda çalışacak şekilde tasarlanmıştır. Piyasa tersine çevrilme göstergesinin tek bir MT4'te birden fazla
PRO Renko Sistemi, RENKO grafikleri ticareti için özel olarak tasarlanmış son derece hassas bir ticaret sistemidir. Bu, çeşitli ticaret araçlarına uygulanabilen evrensel bir sistemdir. Sistemi etkin piyasa sana doğru ters sinyallerine erişim hakkı denilen ses nötralize eder. Göstergenin kullanımı çok kolaydır ve sinyal üretiminden sorumlu tek bir parametreye sahiptir. Aracı, seçtiğiniz herhangi bir ticaret aracına ve renko çubuğunun boyutuna kolayca uyarlayabilirsiniz. Yazılımımla karlı b
Trend Pulse
Mohamed Hassan
5 (4)
Please contact me after purchase to immediately get your PDF strategy + documentation for Trend Pulse !  Introducing Trend Pulse , a unique and robust indicator capable of detecting bullish, bearish, and even ranging trends! Trend Pulse uses a special algorithm to filter out market noise with real precision. If the current symbol is moving sideways, Trend Pulse will send you a ranging signal, letting you know that it's not a good time to enter a trade. This excellent system makes Trend Pulse
Yazarın diğer ürünleri
Dashboard uses Ichimoku Strategy to find best trades. Get extra Indicators/Template: And read more about detailed Product Description and usage here: https://www.mql5.com/en/blogs/post/747457 Please note: I won’t be able to add new settings. It already has 72 settings  :) Some people are using it with their EAs. And iCustom function can only take Max 64 settings. So, I cannot let it grow any further. I’ll definitely be maintaining the code and solving issues. Don’t worry. Please check all
3 Level ZZ Semafor Scanner: This is a Dashboard indicator which uses 3LZZ Indicator in the background to find semafors. It will give priority to the semafors3 because they specify a strong signal. So, even if there is a sem1 or 2 on current bar, and if Sem3 was within "Check Previous Bars for Sem 3". Then it will show Sem3 instead. Read about this in detailed post: https://www.mql5.com/en/blogs/post/758250 And get all extra Indicators/Template from above link. Please note: Number of setti
About: A Fibonacci indicator is best used with other indicators like Pivots, Support/Resistance etc. Price tends to use Fibo levels as Support or Resistance lines. So, this indicator is very useful to know when price might reverse or if a level is crossed, price might continue the trend. Also, to find the best Take Profit and StopLoss lines. Don't use Fibo Indicator alone for trading as it might not always be accurate. Use it to make your strategies better as a supporting indicator. Settings:
FREE
How To Use Check out this post for detailed description on  All Indicator extras and template: https://www.mql5.com/en/blogs/post/758259 The Best Heiken Ashi System is a simple trading system for trading based only two indicators for generate signals: Heiken ashi smoothed and Vqzz indicator multi-timeframe. The system was created for scalping and day trading but can also be configured for higher time frames. As mentioned, the trading system is simple, you get into position when the two ind
FREE
TDI Multi Timeframe Scanner: This Dashboard indicator uses the TDI (Trader's Dynamic Index) Indicator to find best trades. Read detailed How to Use Guide: https://www.mql5.com/en/blogs/post/758252 Extra indicators also available in above post. Checks for: - SharkFin Pattern Free indicator for SharkFin: https://www.mql5.com/en/market/product/42405/ - TDI Trend: Strong/Weak Trend Up/Down - TDI Signal: Strong/Medium/Weak Signal for Buy/Sell - Consolidation - Overbought/Oversold - Volatilit
This indicator is based on Guppy's GMMA Strategy. And shows arrows when GMMA lines cross up or down. To have this indicator and get alerts for Multiple Timeframes and multiple Pairs you can check out the demo of this GMMA Trend Scanner indicator: https://www.mql5.com/en/market/product/38747 About GMMA In Brief: GMMA attempts to identify trends by combining two groups of moving averages with differing time periods: The long-term EMAs (30, 35, 40, 45, 50, and 60) the behaviors of investors that
FREE
This is a Sharkfin Arrows Indicator. Get TDI extra indicators here: https://www.mql5.com/en/blogs/post/758252 This indicator will show only Arrows. It does not have TDI symbols on chart. Please get the extras from links above for TDI indicators. TDI Scanner Dash (paid): https://www.mql5.com/en/market/product/41826 About: This Indicator finds the Shark Fin Pattern. It will show an arrow in the current bar if RSI sharkfin is finished forming in previous bar. What is Shark Fin TDI Patt
FREE
Read detailed description and Get Free Demo and extra indicators: https://www.mql5.com/en/blogs/post/758610 Features: Halftrend Arrow Scan: Scan Max Past Bars for Halftrend arrows. Show how many bars back the arrow occurred in a bracket Past Bars Back Alerts: Num of bars back for which scanner will send alerts Halftrend HTF Align: Scan Higher timeframes for Trend Direction of Halftrend Indicator and if trends align show a slanting Green/Red Arrow for Up/Down trend Semafor 3 Check: Few bars
Features: 1- Get OB/OS Levels from Golden MA Levels 2- Wait for Buy/Sell Start Level Cross 3- Optional: Should price cross Mid Level in earlier bars 4- Optional: Crossing bar High/Medium Volume 5- Optional: MA Stacked to check up/down trend for current TF 6- Optional: NRTR higher timeframes aligned Check Detailed blog post explained: https://www.mql5.com/en/blogs/post/758457 Levels with Buffers available here: Golden MA Levels Indicator: https://www.mql5.com/en/market/product/119515
FREE
EMA Multi meter
Abir Pathak
4.91 (11)
How the Indicator Works: This is a Multi-timeframe MA multimeter indicator which studies if price is above or below a particular EMA range and shows Red/Green/Yellow signals. Red: Price Below EMA range Green: Price above range Yellow: Price within range Indicator Properties: EMA Settings: - Default Period is 200. You can change all MA Settings like Period, MA Method (SMA, EMA, etc) or MA Applied Price (Close, Open, etc). - EMA Range list is a comma separated value list for different timefr
FREE
Scanner Dashboard for Best Heiken Ashi VQZZ Arrows Indicator here: https://www.mql5.com/en/market/product/45900 Check out this post for detailed description on How To Use All Indicator extras and template: https://www.mql5.com/en/blogs/post/758259 Please note that if you are using too many pairs/timeframes, then VQZZ calculations might slow down the dashboard. So be careful not to use too many VQZZ Higher timeframes if you are using too many pairs. Also, VQZZ is based on higher timeframes. e
This strategy is best used for Trend based trading. While market is trending, price still makes smaller ranges. Darvas boxes show breakouts from these small ranges, while still following the original market trend. Detailed Description: https://www.mql5.com/en/blogs/post/747919 Features: Darvas - Check Darvas Box Breakout -   Check Price Above/Below MA or Darvas Box has crossed MA -   Min, Max Box Height -   Max Distance Between Entry Price and Darvas Box Other Indicators: - NRTR Tren
This strategy is best used for Scalping and Binary Options. Strategy: There are 3 EMAs: Faster, Medium and Slower. When Price is Trending, wait for Price to bounce an EMA and scalp at each bounce. Features: - Check if 3 MAs are Stacked - Check Price Bounce Off MAs (Faster, Medium, Slower) - Min Distance Between Faster and Medium MA Filter - Max Distance Between Entry Price and Faster MA Filter - High Volume Check - Heiken Trend Check - Volatility Check - Higher/Lower Timeframes MA Stacked check
Abiroid MA Stack
Abir Pathak
4.33 (3)
Moving Average Rainbow Stack: Free: Single Currency & Single Timeframe MA Stack Very useful for finding current and higher timeframe trends. Best suited for long term trend based trading. Use fewer MAs for quick scalping. And not suitable during low volatility. Only use during high volatility and steady trending markets. Use this to enhance your existing Trend based strategies to find best trends. Read detailed description https://abiroid.com/product/abiroid-ma-stack Available MTF and Scanner
FREE
Abiroid Slope MA
Abir Pathak
4.5 (2)
Features: - Moving Average Slope for Max Past Bars - Slope Period - Slope Thresholds - Multiple Slope Type options - See slope visually as a histogram - Info Panel Show/Hide Slope Calculations and Types: The slope value is calculated using the Slope Period. Suppose Period is 5, it will check the MA value for bar (x) and bar (x+5). And find the slope angle between them. Read detailed description about Slope Types and Settings here: https://www.mql5.com/en/blogs/post/747651
FREE
Description This scanner uses 3LZZ TRO ex4 and scans for Semafors at given “Shift” bar. Scanner Detailed Settings: https://www.mql5.com/en/blogs/post/747456 Other Settings: Set Periods for Semafor 1,2,3 Set alerts on/off for Semafor 1,2,3 Shift bar (Bar on which semafor is scanned) Refresh After Ticks (Number of ticks when dash is refreshed) This scanner is pretty simplistic version. And a more detailed version with a different strategy is available here: https://www.mql5.com/en/market/produ
FREE
Features: - Current TF GMMA Cross and Trend (Mandatory Check.. G-Up/G-Down) - HTF GMMA Trend Check (Optional.. slanting arrow) - TDI or NRTR Trend Check (Optional.. diamond) Read post for detailed description and downloading extra indicators: https://www.mql5.com/en/blogs/post/758264 Scanner: This is a Dashboard Scanner for finding good trades using the GMMA method as base and TDI method for trend verification. All buttons for all Pairs and Timeframes are clickable and will change the ch
Extreme TMA System with Arrows Indicator And Buy/Sell Boxes with Take Profit & Stop Loss This is a Non-Repainting Arrows Indicator based on the Extreme TMA System. It shows TMA cross signals and the best BUY/SELL signals. Along with the most predicted TakeProfit. And StopLoss based on TakeProfit ratio. Please note: This is an Arrows only Indicator. Dashboard is sold separately here: https://www.mql5.com/en/market/product/44825 About Indicator: This indicator shows BUY/SELL Signal Arrows a
This Scanner Dashboard uses the Extreme TMA System Arrows Indicator to show good BUY/SELL signals. This Product contains dashboard only. It does not contain the Abiroid_Arrow_Extreme_TMA.ex4 indicator. Arrows indicator is not necessary for dashboard to work.  To see arrows, you can buy the arrows indicator separately if you like: https://www.mql5.com/en/market/product/44822 Dash shows Slopes for current and Higher Timeframes. - 1st diamond is current TF. Next diamonds are higher TFs (Please N
Abiroid Profit Percent Series 1: Arrows Indicator Stochastic Ichimoku with ATR Get the Scanner for free. For getting Profit Percentages for Multiple Timeframes and Multiple Pairs. And read detailed description about this indicator and all the settings here. And get extra Indicators, Templates and settings for download: https://abiroid.com/product/profit-percent-stoch-ichimoku-with-atr Watch the tutorial video here: https://youtu.be/C45-9kWPE2Q About The Strategy: This strategy has 3 main
Profit Percent Series 2 The scanner dashboard available here (for  Free) : https://abiroid.com/product/profitpercent-arrows-ma-confluence Read detailed information about MA Confluence here: https://www.mql5.com/en/blogs/post/747474 Here's a post about Common Settings for all Profit Percent Series Indicators: https://www.mql5.com/en/blogs/post/747456 Strategy: Main Signal Indicators (Any One): MA Cross (In-built) or Hull, OBV Cross, Heiken Ashi Cross Validation Indicators (Preferably l
This is a slope indicator for COG (Center of Gravity) indicator.   Download extra COG Indicators and read detailed description and strategy here: https://www.mql5.com/en/blogs/post/759120 Description: You can set the Slope Threshold for indicating Buy/Sell heightened levels. In the above Image the Threshold is set to 0, because of that all Bullish slope is Green and Bearish is Red. Suppose we set Threshold to -10 and 10, then this is what we get: And also set Slope Period. Default is 5, whi
This Indicator uses Center of Gravity (COG) Indicator to find you the best trades. It is a reversal based Swing Indicator which contains an  Arrows Indicator. That you can buy here from Metatrader Market. Check out this blog post for detailed How to Use Guide and links to free scanner: https://www.mql5.com/en/blogs/post/758262 Scanner needs this arrows indicator in same directory to run Copy scanner ex4 in same folder as your Arrows Indicator: MQL4/Indicators/Market/ All extra indicators
Free scanner available here: https://abiroid.com/product/abiroid-ema-scalper Basic Strategy: 1: MA Crossover Up/Down Arrow (Mandatory Check) Optional Checks: 2: If NRTR Check On (Optional): For BUY: Check if NRTR blue and For SELL: NRTR Red If NRTR Shadow Distance On (Optional): Check price for 'x' bars back: at Shadow distance (ATR Multiplier distance) from NRTR line. 3: If High Volume bar On: Check if High Volume or if Medium (if on) Volume bar 'x' bars back 4: If HTF Trend Align On (Option
This is a Multi-currency multi-timeframe Support/Resistance Scanner Dashboard for Metatrader 4 (MT4) platform. Get all extras and download free demo here: https://abiroid.com/product/abiroid-support-resistance-scanner Read detailed description in post above. Features: Scan Support/Resistance zones (also called Supply/Demand zones) Show alert when price is inside these zones and highlights the pair/timeframe Show or hide SR zones price nearest to current price (Price_Close) Show or hide cur
This strategy is useful for small timeframe scalping and binary options. Best timeframes: M5,M15,M30 M1 timeframe is too unpredictable. So be careful with that. Read Detailed Description and Get All: - Free Demo - Free Scanner - Extra Indicators ex4 files from https://abiroid.com/product/abiroid-donchian-scanner-and-arrows Arrows Demo only works in strategy tester. So, Arrows Demo won't work with the free scanner. Scanner needs "Abiroid Donchian Arrow.ex4" to work. So make sure both arrows a
Read detailed description and extra indicators: https://www.mql5.com/en/blogs/post/758622 This Supertrend dashboard is a multi-currency and multi-timeframe dash which gives signals whenever supertrend changes it's trend direction. Please note, that this is not a full trading system. It will help you get initial Supertrend signals and higher timeframe trend alignments. And it’s to be used with your own Supertrend Strategies. Features: 1- Select one of In-Built Supertrend Indicators: xSupertr
Get Free Scanner and example Strategies And understand detailed description here: https://abiroid.com/product/abiroid-customizer-arrows-and-scanner And get example wrapper here: https://abiroid.com/indicators/customizer-sample-wrappers You can make your own wrappers if your indicators have complex conditions or for In-Built MT4 indicators. Features: - Specify your own Custom Indicator - Specify Buffer values and create Variables - Use those Variables to create your own Buy/Sell Conditions
This is a multi-timeframe multi-currency Fibo (Fibonacci levels) and Pivots scanner which also shows Missed Pivot count and Fibo Golden Ratio Zones. Select separate Pivot Timeframes for each Dashboard Timeframe Check when price is near a Pivot point Check for Price Crossing Pivot Point Use Mid Pivots (Optional) Show Missed Pivots (Optional) Show High Volume Bar Use Fibo (Optional) Use Fibo Golden Ratio (Optional) Set your preferred Timeframe for Fibo or Pivots Check out   Common Scanner Settin
Bollinger Bands Breakout Strategy has an Arrows and Scanner Dashboard indicator set. It is for MT4 (Metatrader 4) platform. When price breaks out of a Bollinger Outer Band in a powerful way, it becomes a great position for scalping. Because the next few bars will most likely keep going in the same direction. Especially if Middle band is also sloping towards that breakout. It's also great for Binary options when using 2-3 next few bars. Strategy: BUY  Bollinger Bands: - Price breaks out of
Filtrele:
İnceleme yok
İncelemeye yanıt
Sürüm 1.1 2021.03.06
v1.1 Added
Alert on Slope Shift (Above/below 0)
Alert on Slope Level High