SimSim Trading Line
- Göstergeler
- Aleksandr Tyunev
- Sürüm: 1.1
- Güncellendi: 18 Kasım 2020
- Etkinleştirmeler: 9
Это линейный индикатор.Он выбирает данные от 23-х стандартных индикаторов и рассчитывает уровень сигнала, который показывает предполагаемое движение цены инструмента торговли. Минимальный уровень сигнала индикатора установлен в пределах -100 до +100%. Используйте усреднение для формирования сигнала.
Это линейный индикатор.Он выбирает данные от 23-х стандартных индикаторов и рассчитывает уровень сигнала, который показывает предполагаемое движение цены инструмента торговли. Минимальный уровень сигнала индикатора установлен в пределах -100 до +100%. Используйте усреднение для формирования сигнала.
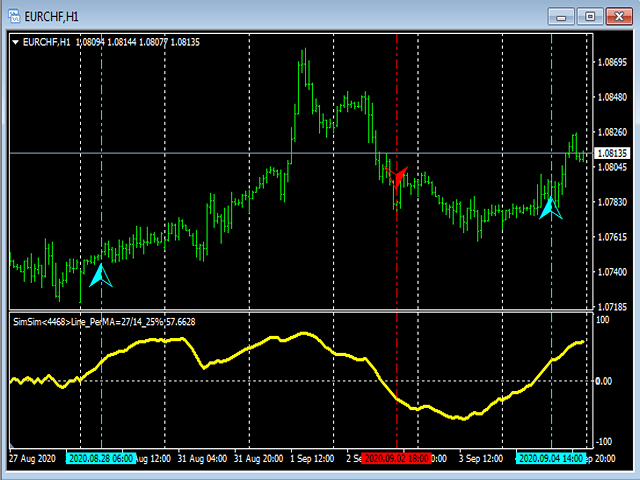
Как работать с индикаторам.
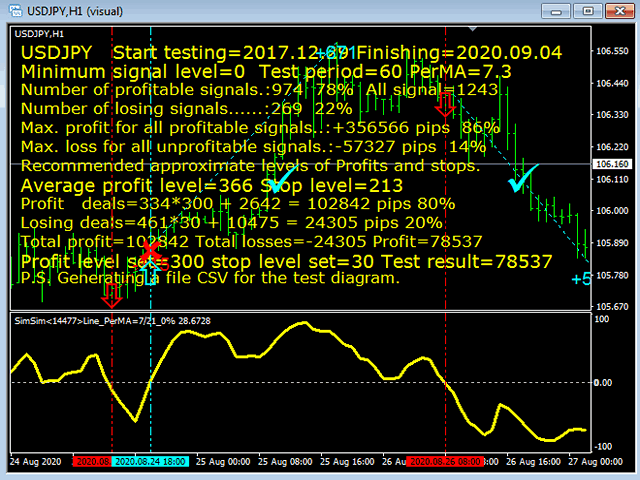
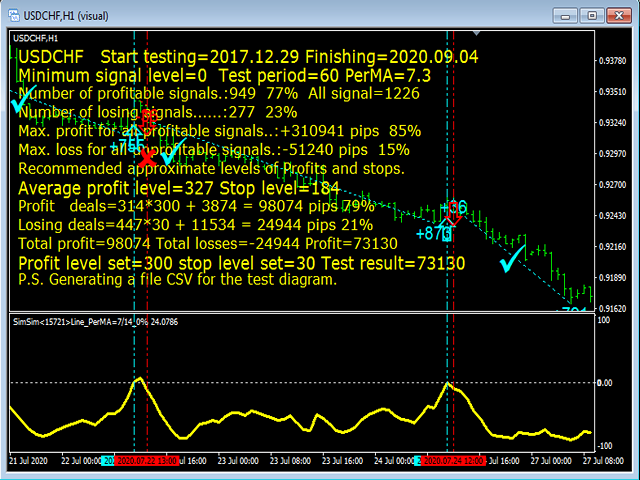
Следим за сигналом и принимаем решения. При пересечении нулевого уровня индикатора снизу вверх можно рассматривать покупки. При пересечении нулевого уровня сверху вниз можно рассматривать продажи. Кроме линии можно смотреть за сигналами в виде стрелок или вертикальных линий. Это не самостоятельный сигнал, а просто сигнал из подвала дублируется на основной график.
Как работать с индикаторам.
Следим за сигналом и принимаем решения. При пересечении нулевого уровня индикатора снизу вверх можно рассматривать покупки. При пересечении нулевого уровня сверху вниз можно рассматривать продажи. Кроме линии можно смотреть за сигналами в виде стрелок или вертикальных линий. Это не самостоятельный сигнал, а просто сигнал из подвала дублируется на основной график.
Для связи индикатора с советниками есть буфер № 0. Который содержит текущий сигнал индикатора от -100% до +100%. Разработчик может сам определить на каком уровне сигнала Купить или Продать.
Для связи индикатора с советниками есть буфер № 0. Который содержит текущий сигнал индикатора от -100% до +100%. Разработчик может сам определить на каком уровне сигнала Купить или Продать.
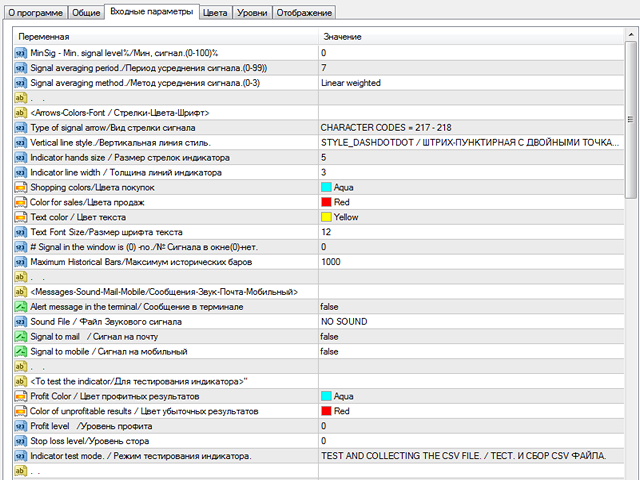
Входные параметры индикатора.
Входные параметры индикатора.
1. Основые входные параметры:
-
MinSig - Min. signal level. / Мин, сигнал. (0-100)%
-
Signal averaging period. / Период усреднения сигнала. (0-99). Если период усреднения = 0 или 1, то сигнал без усреднения.
-
Signal averaging method. / Метод усреднения сигнала.(0-3)
2. Виды и размеры индикаторных стрелок, цвета и размер шрифта:
- Type of signal arrow. /Вид стрелки сигнала. (стрелки и вертикальные линии можно не использовать)
- Signal Arrow Dimensions /Размеры стрелки сигнала
- Vertical line style. /Вертикальная линия стиль.
- Indicator line width / Толщина линий индикатора
- Shopping colors /Цвета покупок
- Color for sales /Цвета продаж
- Text color /Цвет текста
- Text Font Size /Размер шрифта текста
- Signal in the window is (0) -no. /№ Сигнала в окне(0)-нет.
- Maximum Historical Bars /Максимум исторических баров
3. Сигналы оповещения звук в терминале, почта, мобильный:
- Sound File / Файл Звукового сигнала
- Signal to mail / Сигнал на почту
- Signal to mobile / Сигнал на мобильный
- Sound File / Файл Звукового сигнала
- Signal to mail / Сигнал на почту
- Signal to mobile / Сигнал на мобильный
4. Для теста индикатора:
- Profit Color / Цвет профитных результатов
- Color of unprofitable results / Цвет убыточных результатов
- Test profit level / Тестовый уровень профита
- Test stop level / Тестовый уровень стопа
- Indicator test mode. / Режим тестирования индикатора
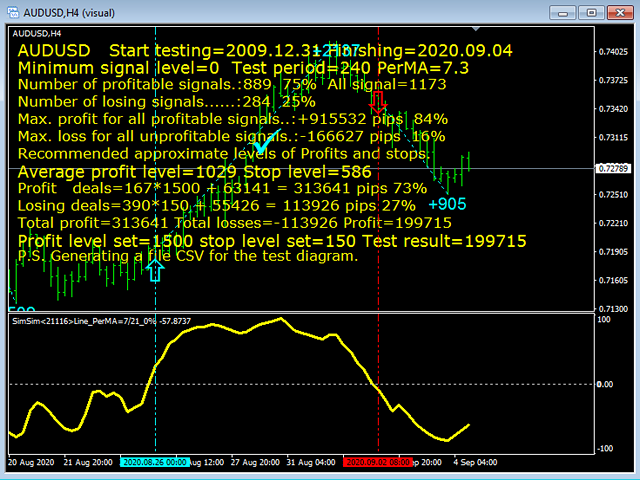
Режимы тестирования индикатора:
- Просто тест.
- Тест и статистика.
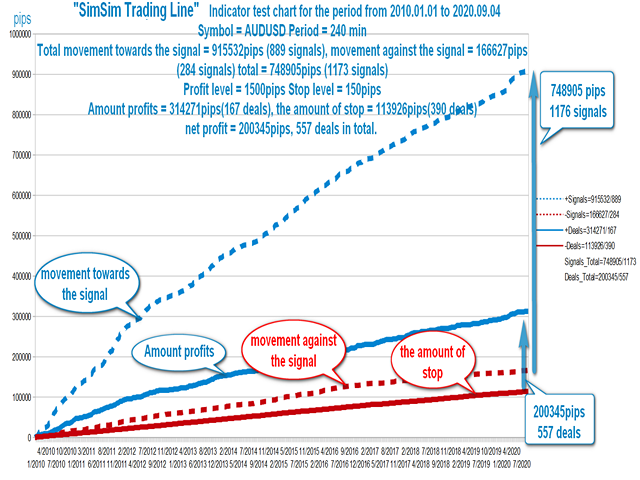
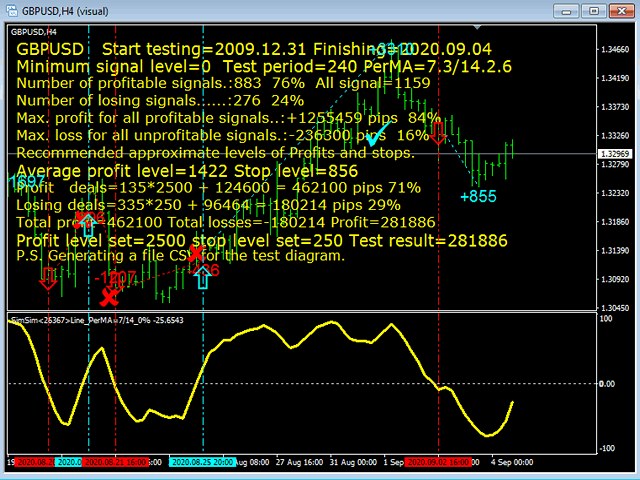
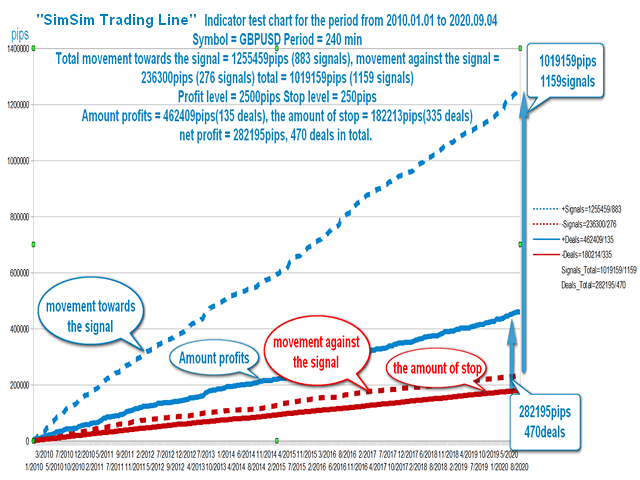
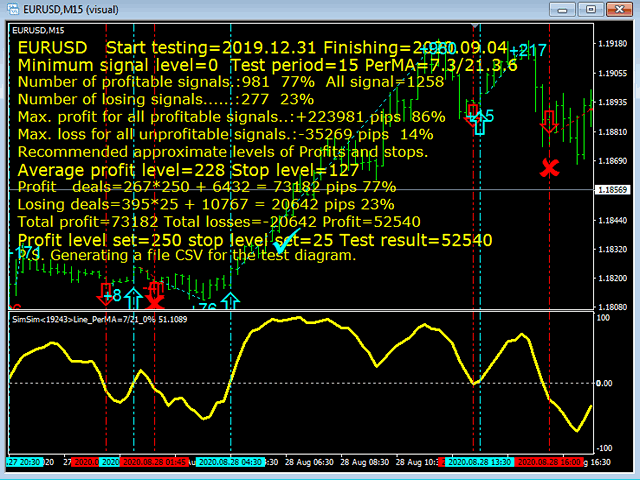
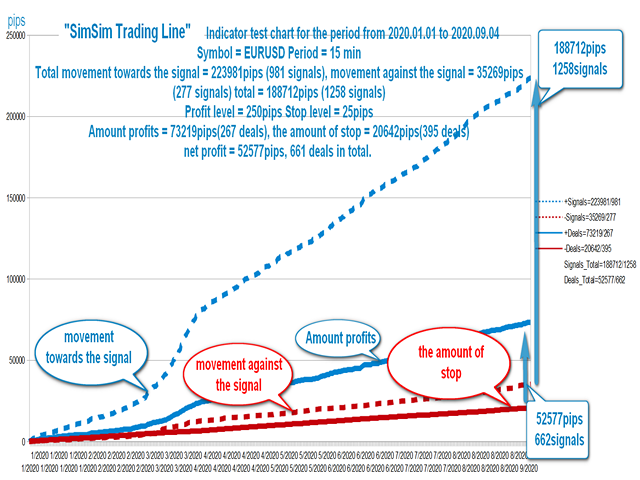
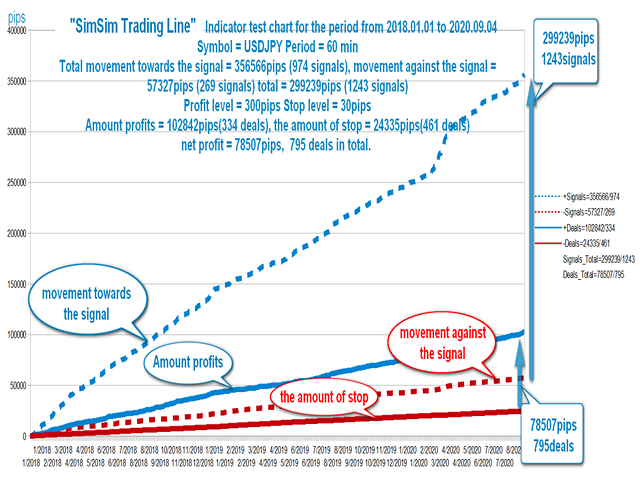
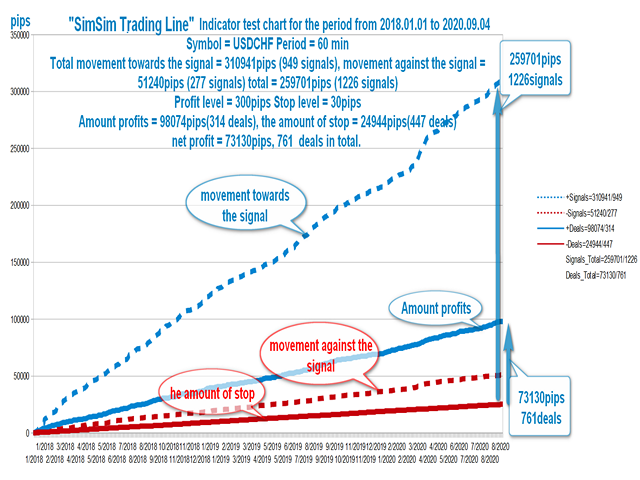
- Тест, статистика и формирование CSV файла. CSV файл формируется в папке tester\files\. Начальный шаблон имени файла: "SimSim_TEST_... .csv". Далее файл загружается как таблица в OpenOffice или Exel от Microsoft и по данным из файла строятся диаграммы (смотрите примеры на скринах
Режимы тестирования индикатора:
- Просто тест.
- Тест и статистика.
- Тест, статистика и формирование CSV файла. CSV файл формируется в папке tester\files\. Начальный шаблон имени файла: "SimSim_TEST_... .csv". Далее файл загружается как таблица в OpenOffice или Exel от Microsoft и по данным из файла строятся диаграммы (смотрите примеры на скринах
5. Для всех желающих есть тонкая настройка по всем индикаторам:
-
1.Use indicator "Rsi" for calculation. / Использовать Rsi для расчета Сигнала.
-
Period RSI = 14
-
Price RSI = PRICE_WEIGHTED
.
- 23.Use indicator "Bands" for calculationю / Использовать Bands для расчета Сигнала.
- Deviation Bands = 2
- Period Bands = 14
- Averaging method Bands = MODE_SMMA
P.S. Буду очень признателен за отзывы о работе индикатора. По результатам работы системы тестирования индикатора, начал разработку советника.
Диаграммы по данным работы теста, очень интересные.