• Genel bakış
  • İncelemeler (10)
  • Yorumlar (7)
  • Yenilikler

BACD Cloud

4.57

Ya da yüzde olarak göstermektedir eğilim yönü ve önlemler gücünü olduğu bir osilatördür B ermaui bir verage onvergence D ivergence bulut. BACD Bulut hesaplaması aşağıdaki gibidir:

1- İki üstel hareketli ortalamayı hesaplayın. Bunlardan biri diğerinden daha hızlıdır. İlkini (Hızlı) ve ikincisini (Yavaş) arayacağım

2- Aralarındaki merkezi bulun, burada: Merkez MA = (Hızlı + Yavaş) / 2

3- BACD Çizgisini aşağıdaki gibi hesaplayın: BACD = 100 * (Hızlı / Merkez MA)

4- BACD'nin üstel hareketli ortalaması olan BACD Sinyal Doğrusunu hesaplayın. Formül şu şekildedir: BACD Sinyali = EMA (BACD)

5- BACD Sinyal satırını tablodan gizleyin.

6- BACD Çizgisi ile sinyal çizgisi arasındaki fark olan BACD Histogram Çizgisini hesaplayınız. (Not: BACD Histogramı, grafikte bir histogram olarak değil, bir çizgi olarak çizilir.)

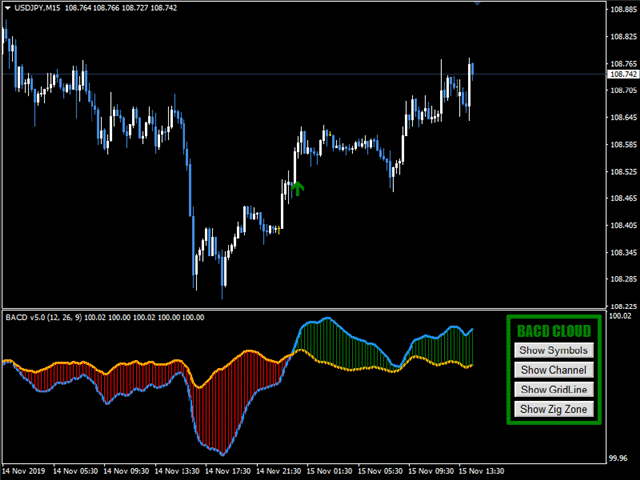
7- Eğer (BACD Çizgisi > BACD Histogram Çizgisi) ise trendi temsil etmek için yeşil bir bulut çizin.

8- Eğer (BACD Çizgisi < BACD Histogram Çizgisi), trendi temsil etmek için kırmızı bir bulut çizin.

Önemli Bağlantılar:


Gösterge nasıl kullanılır?

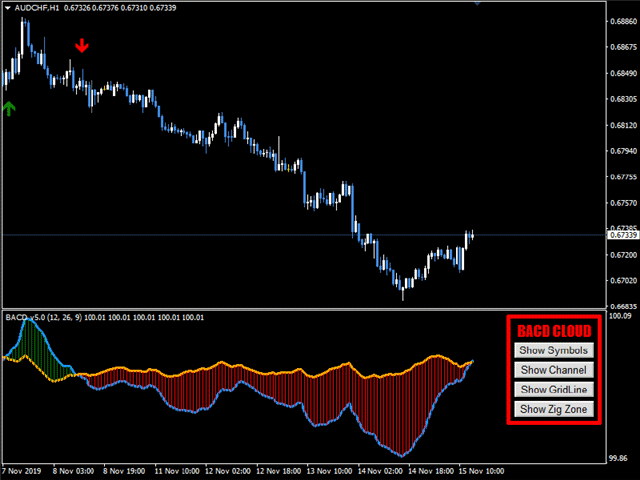
  1. Gösterge oklarına bağlı olarak al ve sat.
  2. BACD Bulutları ve fiyat mumları arasındaki farklılık, mevcut trendde neredeyse bir tersine işaret ediyor.
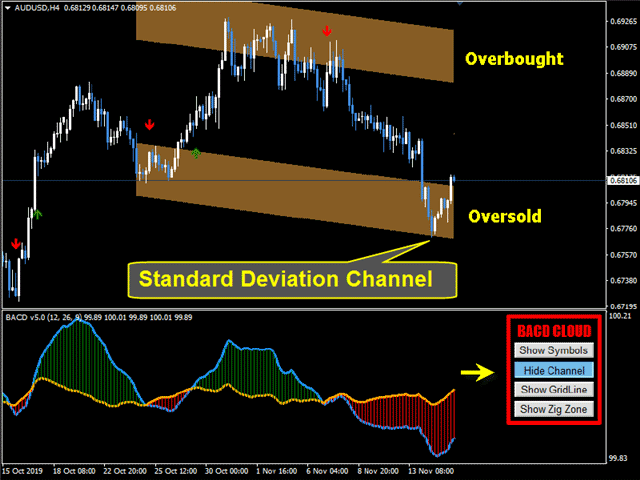
  3. Kâr almak ve zararı durdurmak için kanalları, yuvarlatılmış sayılar ızgarasını ve zig Düzeylerini kullanın.

BACD Bulut Özellikleri.

  • BACD Cloud, sonuçlarını yeniden boyamaz veya yeniden hesaplamaz.
  • Kullanıcının aralarında kolayca gezinmesine yardımcı olacak iyi tasarlanmış parametreler.
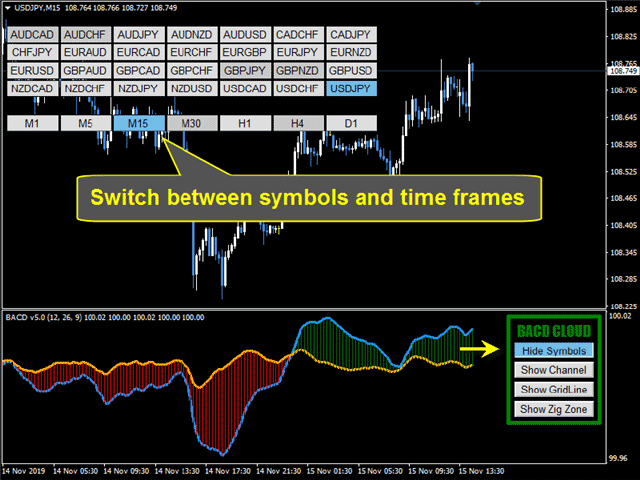
  • Semboller Düğmesine basarak FX çiftleri arasında kolayca geçiş yapabilirsiniz.
  • Kanal Düğmesine basarak bir Standart Sapma Kanalı'nı kolayca ekleyebilirsiniz.
  • Farklı seviyelerdeki yuvarlak sayılardan bir Izgara ekleyebilirsiniz.
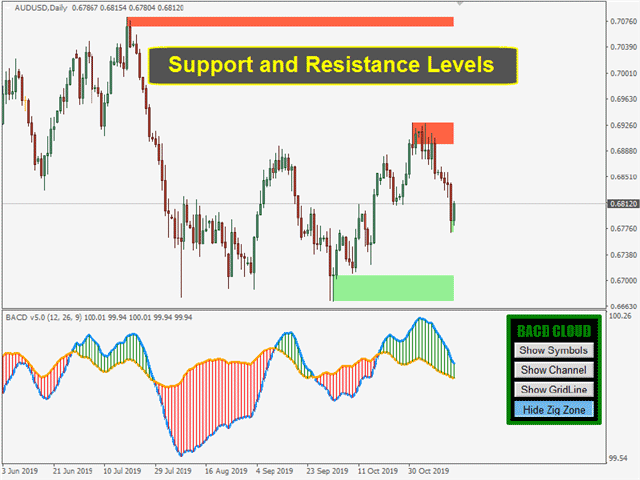
  • Destek ve direnç seviyeleri (Zig Bölge Seviyeleri) ekleyebilirsiniz.
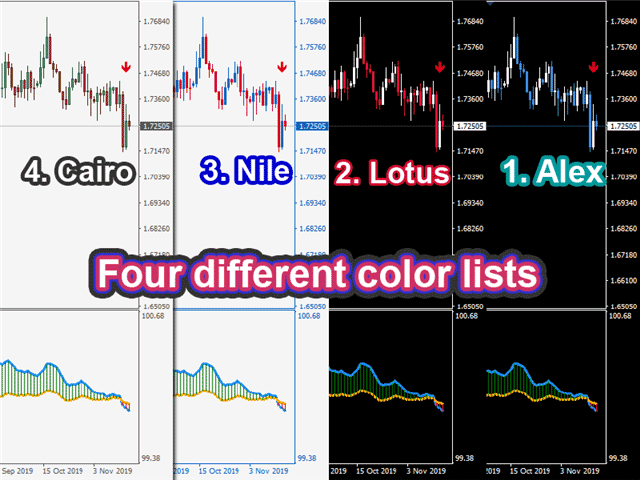
  • Dört farklı renk listesi arasından seçim yapabilirsiniz.
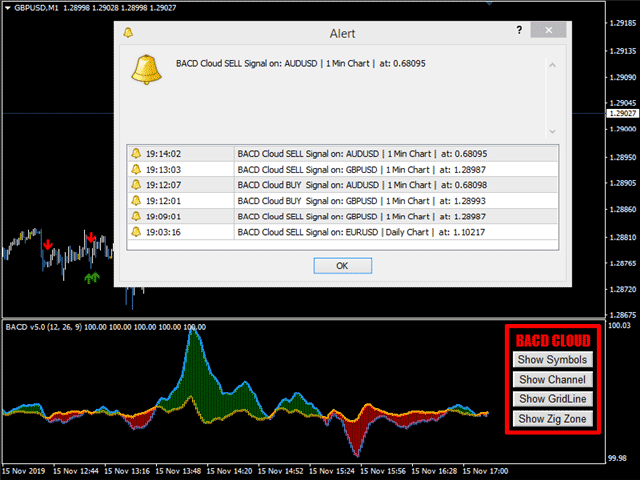
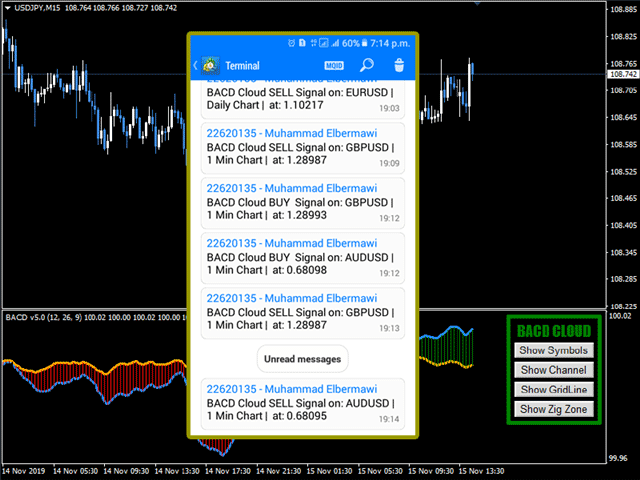
  • Kullanıcının seçimine bağlı olarak Ses, Mobil bildirim ve e-posta uyarıları.
  • BACD Bulut kodu, kullanıcının PC belleğini tüketmeyecek şekilde revize edilmiştir.

BACD Bulut Parametreleri

1) GÖSTERGE PARAMETRELERİ
  • Hızlı MA Dönemi.Varsayılan 12'dir
  • Yavaş MA Dönemi.Varsayılan 26'dır
  • Sinyal Hattı Periyodu.Varsayılan 9'dur
2) OKLAR VE UYARILAR
  • Okları ve Çizgileri Göster:Varsayılan yalnızca okları göster'dir
  • Oklar Boyutu.Varsayılan bir
  • Yeni Okla İlgili Uyarı:Varsayılan doğrudur
  • Yeni Ok ile e-posta Gönder:Varsayılan yanlış
  • Yeni Okta Mobil Bildirim Gönder:Varsayılan yanlıştır
3) UYGULAMA AYARLARI
  • Sembol Kaynağı: Özel sembol listesindenveya Piyasa İzleme'densemboller alın.
  • Sembol listesi (";" ile ayrılmış):Özel bir listeden sembol seçerseniz, semboller arasında ";" ile ayırın.
  • Düğme Yazı Tipi Boyutu.Varsayılan 10'dur.
  • Ön Plandaki Grafik.Tüm gösterge nesnelerinin üzerinde grafik mumlarını gösterin. Varsayılan yanlıştır.
  • Kanal Uzunluğu [> 1].Kanal hesaplamasında kullanılan mum sayısı. Varsayılan 100'dür.
  • Panel Görünür [Üst Karakter + Harf].Panelin görünmesini sağlamak için basılacak harf artı shift. Varsayılan "A"
  • Panel Kaybolur [Shift + Letter].Panelin kaybolmasını sağlamak için basılacak harf artı shift. Varsayılan "D"
  • Tablo Renkleri Listesi:Kullanıcı kendi tablosu için dört farklı renk listesi arasından seçim yapabilir veya kendi listesini kullanmak istiyorsa (Hiçbir Şey Yapma) seçeneğini seçebilir.


Herhangi bir sorunuz varsa lütfen özel mesaj yoluyla bana ulaşın veya yorum bölümüne yazın.
Muhammed Al Bermaui, CMT


İncelemeler 10
Paulina Andrea Madariaga Figueroa
4147
 

Very good indicator, I have spent money in another indicators and with Bermaui tools I have everything.

Deepan Kalaiselvan
231
Deepan Kalaiselvan 2021.04.13 04:35 
 

Nice trend indicator

Kahraman Senol
1635
Kahraman Senol 2021.03.02 14:17 
 

Special Thanks to Muhammad Elbermawi, i bought BACD Cloud, Bermaui Bands, Bermaui Deviation Percent and True direction oscillator. I am using them on my real trading account with MA50 and ichimoku indicators. Successful trade rate is over %70. This is enough for me. i decided to write a EA which uses all 6 indicators.I confirm the entry point buy or sell with all 6 indicators at the same time. It is five star product at the price.

https://www.mql5.com/en/signals/1195681

Önerilen ürünler
Bu işlem aracıyla aynı anda 15 piyasayı tarayabilirsiniz. Karşınızda yeni ticaret göstergesi 2024: ️ Kontrol Paneli Çoklu Para Birimi Çoklu Zaman Çerçevesi Stokastik. Bu ticaret aracını oluşturmamın en az iki nedeni var: Öncelikle tek piyasayı gözlemlemekten sıkıldım. İkincisi, başka bir pazara giriş anını kaybetmek istemiyorum. Bu yüzden aynı zamanda diğer piyasa koşullarını da bilmek istiyorum. Bu nedenle birden fazla piyasanın koşullarını aynı anda tarayabilecek bir tarayıcıya i
PX Trend
Vitalii Zakharuk
PX Trend is a technical indicator that mathematically transforms the price of a currency pair in the form of signaling arrows on the chart, it is used to predict the direction of the market movement. This tool is basic for the interpretation of the parameters of the graphs in technical analysis. PX Trend refers to an arrow indicator Forex - a tool that gives unambiguous signals to buy or sell currencies using arrows. An arrow directed upwards recommends buying, downward - selling. The indicat
Implement
Vitalii Zakharuk
5 (1)
Implement analyzes market dynamics for pivot points. If you want to learn how to spot the correct reversals for consistently likely profitable trading, buy this indicator. Shows favorable moments of entering the market in stripes. Ready-made trading system. The principle of operation of the indicator is to automatically determine the current state of the market when placed on a chart, analyze historical data based on historical data and display instructions for further actions on the trader's
Trend Suffer
Philip Effiong Philip
Alerts you on new trends, with ENTRY and EXIT points. INSTRUCTIONS  Select asset of choice, activate the indicator on the chart and just follow the signals from the arrows. ITS FREE, GIVE ME A GOOD RATING! Platform : Metatrader4 Asset : All Currencies, Gold, BTCUSD, NASDAQ PS : F or newbie and pro traders. Used by more 3,000 traders around the world. Send  a mail for further help and information...........
Dynamic SR Trend Channel Dynamic SR Trend Channel is a simple indicator for trend detection as well as resistance/support levels on the current timeframe. It shows you areas where to expect possible change in trend direction and trend continuation. It works with any trading system (both price action and other trading system that use indicators) and is also very good for renko charting system as well. In an uptrend, the red line (main line) serves as the support and the blue line serves as the
Arrow indicator, to determine adjustments and local trends The arrow appears on the current bar and after closing the bar will not disappear. Allows you to enter the transaction at the very beginning of the movement Thanks to the flexible settings you can use on any currency pairs, metals and cryptocurrency Can be used when working with binary options Distinctive features Does not redraw. Additional parameters for fine tuning. Works on all timeframes and symbols. Suitable for trading c
FBO Impact  is a professional yet simple to use trend following system. It detects the prevailing trend and gives entry points after pullbacks to significant price levels. To determine the trend it uses a unique filtering algorithm. Suitable for defining entry points for scalping as well as for intra-day trading. Features Works with the prevailing market trend. Suitable for all currency pairs. Ideal for all time frames but higher time frames are recommended. Does not redraw/repaint the arrows on
RSI Divergence Scanner
Reza Aghajanpour
4.5 (14)
** All Symbols x All Timeframes scan just by pressing scanner button ** ***Contact me after purchase to send you instructions and add you in "RSI scanner group" for sharing or seeing experiences with other users. Introduction RSI divergence is a main technique used to determine trend reversing when it’s time to sell or buy because prices are likely to drop or pick in the charts. The RSI Divergence indicator can help you locate the top and bottom of the market. This indicator finds Regular div
Trend MagicX
Hafis Mohamed Yacine
A trending market is one in which price is generally moving in one direction. ... When trading a trend-based strategy, traders usually pick the major currencies as well as any other currency utilizing the dollar because these pairs tend to trend and be more liquid than other pairs.  Best Trend Indicator That Tells You the Direction of the Trend   Trend MagicX_v1.1 displays the trend direction, duration, intensity and the resulting trend rating for all time frames in real time. You'll see at
This is a simple PriceTMA bands, non repaint! it can be used for a trend following system or sometimes reversals. as a main signal or a filter for others strategies, it depends on the trader main strategy. calculations for this indicator are a combined Algorithm between moving averages "MA" and average true range"ATR". good luck with your trading! i hope it is helpful Cheers
RoyalPrince Fibo
Richard Louis Pastor
4.93 (29)
Royal Prince Fibonacci , has the most advance Trend detection algorithm built into its Alert system combined with the RoyalPrince Non-repaint Arrows with it's own alert system you will never miss the opportunity of the trade.  2nd picture is how to use Guide on how i use it to Scalp or take long trades. works on all Charts and all Timeframe on mt4. ︎Best Timeframe M15 for scalping  H1 for Day Trading Options: • Fibonacci days High and Lows  • Fibonacci Targets • Fibonacci Alert System • Tren
"Cool volumes" arama göstergesi, Mt4'teki kene hacimlerine dayanarak oluşturulmuştur. Göstergenin kendisi belirli bir zaman diliminde (zaman diliminin seçimi) satın alınacak veya satılacak hacimlerin sayısını izler. Ve satıcıların veya alıcıların hacimlerinde anormal bir fazlalık olduğunda, bir satış veya satın alma sinyali verir. Alt pencerede renkli histogramlar çizilir, burada yeşil renk şu anda alıcıların üstünlüğünü gösterir, bu da belirli bir fiyat aralığındaki artışın potansiyel olar
Global Trend
Vitalii Zakharuk
Global Trend Indicator, shows the signals for entry. Displays both entry points and the trend itself. Shows statistically calculated moments for entering the market with arrows. When using the indicator, the risk factor can be optimally distributed. Settings: Uses all one parameter for settings. Choosing a parameter, it is necessary to visually resemble it so that the appropriate graph has a projection of extremes. Parameters: Length - the number of bars for calculating the indicator.
Note : The slow loading of the indicator issue has been addressed . This new version loads fast and does not slow the platform. Version 1.3 : We have updated the indicator to include an historical bar scanning option . So instead of scanning all bars in the history (which can make the indicator slow sometimes ) , you can select the maximum number of bars it can scan which can increase the performance and make the indicator faster. This indicator scans the 1-3 Trendline pattern . The indic
Market Profile
Artem Titarenko
5 (1)
The "Market Profile" indicator displays the profiles and volumes of periods – weekly, daily, session (8-hour), 4-hour, hour, summary. The VAH/VAL price area is automatically highlighted by a dotted line for each profile (except for the summary). The indicator includes chroma Delta, which colors the profile areas. The areas of prevailing Buys is colored in green, that of Sells - in red. The intensity histogram features blue/red respectively. In the filter mode, the indicator displays the volume a
ROC acceleration-deceleration is the manual system for medium-term scalping. Indicator based on custom ROC system which defines bullish/bearish market and especially  acceleration-deceleration of tendention in the market's main direction. Buy arrow is plotted during bearish market when current trend decelerates and sell  arrow is plotted during bullish market when current trend decelerates. Main Indicator's Features Signals are not repaint,non-late or disappear(exept cases when system recalculat
SFO Trend Racer
Tevin Marshall
5 (1)
SFO Trend Racer system is a trend indicator created by the CEO and Founder of " Simple Forex Options ", Tevin Marshall . It serves 6 different functions all in one. It shows the trader the entry signals as well as exit signals, whether it is a take profit or a stop loss. It also uses trend filters and signal confirmations so that the trader is able to make the most logically fit decision. Trend Racer uses various filters and specific settings from a plethora of indicators. The beauty in this ind
Dictator
Vitalii Zakharuk
The Dictator indicator is based on the process of detecting the rate of change in price growth and allows you to find points of entry and exit from the market. a fundamental technical indicator that allows you to assess the current market situation in order to enter the market of the selected currency pair in a trend and with minimal risk. It was created on the basis of the original indicators of the search for extremes, the indicator is well suited for detecting a reversal or a large sharp jer
Indicador Taurus All4
Fabio Oliveira Magalhaes
Taurus All4 Taurus All4 is a high-performance indicator, it will tell you the strength of the trend, and you will be able to observe the strength of the candle. Our indicator has more than 4 trend confirmations. It is very simple and easy to use. Confirmation Modes Candle Trend Confirmations: When the candle switches to light green the trend is high. When the candle switches to light red the trend is reverting down. When the candle changes to dark red the trend is low. Trendline Trend Conf
Based on the Dow Theory, the system automatically draws a turning point, which is the starting point for buying or selling. It also automatically tells you whether the market is in a buying or selling condition and recognizes the environment. It is also a good tool to prevent false trades and to make profitable trades. We are live-streaming the actual operation of the system. Please check for yourself if it is usable. Please check it out for yourself. https://www.youtube.com/@ganesha_forex
Diamonds Min5   - DM5-   DM5   is an indicator that suggests entering levels (sell or buy) ,it always follow the trends using parabolic sar ,  working on is so easy, you need just to attach it to the chart and all the magic will show , this indicator does not repeat itself or redraw signals . After months of testing, it provides a very good result     it works on all pairs with no excaption 
The Sensitive Oscillator indicator is designed to find trends. It recognizes trends with its own algorithm and changes color. Finds trends relative to the degree of sensitivity. You can use it in all time periods. You can use this indicator alone or in conjunction with other indicators suitable for your other strategies. Transaction strategies You can do breakout strategies with this indicator. Each time you change colors, you can enter the process. You can use it in the long run by putting st
Delta AG
Yurij Kozhevnikov
The difference between the arithmetic and geometric means at the specified range. Since the greater is the difference between the values, the greater the resulting figure is, actually the indicator shows volatility fluctuations. The arithmetic mean of a certain number of values ​​is the sum of the values ​​divided by their number. The geometric mean is the root of the power of the number of values ​​extracted from the product of these values. If all values ​​are equal, the arithmetic mean and th
TH3ENG CURRENCY STRENGTH SCANNER The best currency strength reader based on more than 4 excellent modes, based on Price action and Volume with various algorithms. This indicator reads all pairs data to measure and find the best results of all currencies and arrange it in a separated dashboard panel. You can find the strongest currency and the weakest currency, then trade on them pair. NOT COPLICATED NOT REPAINTING NOT LAGING Input Parameters === SYSTEM SETTING  === Calc. Mode ==> Calculatio
FREE
SuperEntryx
Abdulkarim Karazon
Super Entry, ATR değerine dayalı olan ve değiştirilebilen ve ayarlanabilen yan tp ve sl seviyelerini tek başına uzun ve kısa sinyaller veren, hepsi bir arada ok tipi bir göstergedir; bu gösterge, kazanma oranını ve diğer istatistikleri gösteren bir geriye dönük test paneli sağlar. ne kadar doğruluk bekleneceğine dair net bir görüş sağlar. bu gösterge yeniden boyamaz veya arka boyama yapmaz ve sinyal gecikme olmadan çubuk açıkken gelir. Parametreler: ayarlar: gösterge tp ve sl değerleri ve
A top-quality from the famous XSuper Trend indicator. It is completely loyal to the original algorithm, and implements many useful features Which includes Trend Indicators as Filters like MACD,CCI and Alligator. The Chefs Super Trend Plus Indicator is a great way to identify the current market trend. The indicator shows a clear distinction between uptrends and downtrends. The indicators has optional filters for sound signal. Suitable for the following trending pairs: EUR/USD, GBP/USD, USD/JPY,
Alpha Trend Spotter (ATS) Volume Break Out This is an indicator that combines Volume breakout/breakdown and Moving Average Breakout/breakdown. It is able to predict further price changes. It is not repainted, not recalculated. All lines are shown at the open of a new candlestick, never winking or vanishing in the current candle. These lines are appeared at the beginning of the current candle. Suitable for M5 to D1 Timeframe. How to Use: If Green line appears, that shows the "oversold" area, so t
This indicator shows data from 9 currency pairs by your choice for all 9 Time Frames. If a digital value of the RSI is less or equal to DnLevel = 30 (or whatever number you decided to put) then a Green square will appear. This is potentially an oversold condition and maybe a good time to go Long. If a digital value of the RSI is greater or equal to UpLevel = 70 (or whatever number you decided to put) then a Red square will appear. This is potentially an overbought condition and maybe a good time
Precision Pivot Points Yuri Congia Description: Precision Pivot Points is a sophisticated indicator designed to identify potential market reversal points with accuracy and precision. Utilizing advanced algorithms, this indicator automatically calculates key support and resistance levels based on pivot point analysis. Pivot points are essential tools used by traders worldwide to make informed trading decisions and optimize their trading strategies. Join me in the exciting world of financial trad
FREE
Acemi veya Profesyonel, en çok satan çok zaman dilimli Pivot Prof, alış ve satışlarınızı güzelleştirecek ve uzmanların kullandığı Destek ve Direnç katmanlarıyla size birinci sınıf değişim olanakları sunacaktır. Pivot alış ve satış, anahtar aralıklarda piyasaya giriş ve çıkış yapmak için kolay ve güzel bir tekniktir ve yetkililer tarafından uzun süredir kullanılmaktadır ve tüm semboller üzerinde çalışmaktadır: Forex, Kripto, Hisse Senetleri, Endeksler vb. Pivot Prof top getiriyor Katmanları bayi
Bu ürünün alıcıları ayrıca şunları da satın alıyor
Gann Made Easy
Oleg Rodin
4.93 (71)
Gann Made Easy , bay teorisini kullanarak ticaretin en iyi ilkelerine dayanan, profesyonel ve kullanımı kolay bir Forex ticaret sistemidir. WD Gann. Gösterge, Zararı Durdur ve Kâr Al Seviyeleri dahil olmak üzere doğru SATIN AL ve SAT sinyalleri sağlar. PUSH bildirimlerini kullanarak hareket halindeyken bile işlem yapabilirsiniz. Lütfen satın aldıktan sonra benimle iletişime geçin! Alım satım ipuçlarımı ve harika bonus göstergelerini ücretsiz olarak sizinle paylaşacağım! Muhtemelen Gann ticaret y
Atomic Analyst
Issam Kassas
5 (3)
Öncelikle belirtmek gerekir ki bu Ticaret Göstergesi Yeniden Çizim Yapmaz, Gecikmez ve Gecikme Göstermez, bu da hem manuel hem de robot ticareti için ideal hale getirir. Kullanıcı kılavuzu: ayarlar, girişler ve strateji. Atom Analisti, Piyasada Daha İyi Bir Avantaj Bulmak İçin Fiyatın Gücünü ve Momentumunu Kullanan PA Fiyat Hareketi Göstergesidir. Gürültüleri ve Yanlış Sinyalleri Kaldırmaya ve Ticaret Potansiyelini Artırmaya Yardımcı Olan Gelişmiş Filtrelerle Donatılmıştır. Birden fazla katma
Scalper Inside PRO
Alexey Minkov
4.75 (57)
An exclusive indicator that utilizes an innovative algorithm to swiftly and accurately determine the market trend. The indicator automatically calculates opening, closing, and profit levels, providing detailed trading statistics. With these features, you can choose the most appropriate trading instrument for the current market conditions. Additionally, you can easily integrate your own arrow indicators into Scalper Inside Pro to quickly evaluate their statistics and profitability. Scalper Inside
ŞU ANDA %26 INDIRIMLI Yeni Başlayanlar veya Uzman Tüccarlar için En İyi Çözüm! Bu Gösterge benzersiz, yüksek kaliteli ve uygun fiyatlı bir ticaret aracıdır çünkü bir dizi tescilli özellik ve yeni bir formül ekledik. Sadece BİR grafik ile 28 Forex çifti için Döviz Gücünü okuyabilirsiniz! Yeni bir trendin veya scalping fırsatının tam tetik noktasını belirleyebildiğiniz için ticaretinizin nasıl gelişeceğini hayal edin? Kullanım kılavuzu: buraya tıklayın Bu ilk olan, orijinal! Değersiz bir
TPSpro RFI Levels
Roman Podpora
4.8 (15)
Reversal First Impulse levels (RFI)    INSTRUCTIONS        RUS       -       ENG              R ecommended to use with an indicator   -   TREND PRO -  Version MT5 A key element in trading is zones or levels from which decisions to buy or sell a trading instrument are made. Despite attempts by major players to conceal their presence in the market, they inevitably leave traces. Our task was to learn how to identify these traces and interpret them correctly. Main functions: Displaying active zones
Trend Punch
Mohamed Hassan
5 (8)
Manual guide:   Click here MONDAY PROMO of  $79!  -- Next price is  $149 .  This indicator is unstoppable when combined with our other indicator called  Support & Resistance . After purchase, send us a message and you will get it   for  FREE as a BONUS! I like to use Trend Punch on XAUUSD & BTCUSD on the M1 timeframe!  Introducing Trend Punch , the revolutionary forex trend indicator that will transform the way you trade! Trend Punch is uniquely designed to provide precise buy and
Fiyat tersine döndükçe ve geri çekildikçe piyasa yapısından elde edilen kâr değişir. Piyasa yapısını tersine çevirme uyarısı göstergesi, bir trendin veya fiyat hareketinin ne zaman tükenmeye yaklaştığını ve tersine dönmeye hazır olduğunu tanımlar. Genellikle bir geri dönüş veya büyük bir geri çekilme meydana gelmek üzereyken meydana gelen piyasa yapısındaki değişiklikler konusunda sizi uyarır. Gösterge, olası bir tükenme noktasının yakınında her yeni yüksek veya düşük oluştuğunda, başlangıçta
FX Volume
Daniel Stein
4.6 (35)
Sabah Brifingimiz aracılığıyla ayrıntılar ve ekran görüntüleri ile günlük piyasa güncellemenizi alın burada mql5 ve on Telegram ! FX Volume, bir brokerin bakış açısından piyasa duyarlılığı hakkında GERÇEK bir fikir veren İLK ve TEK hacim göstergesidir. COT raporlarından çok daha hızlı bir şekilde, brokerlar gibi kurumsal piyasa katılımcılarının Forex piyasasında nasıl konumlandıklarına dair harika bilgiler sağlar. Bu bilgileri doğrudan grafiğinizde görmek, ticaretiniz için gerçek oyun değiştir
FX Power MT4 NG
Daniel Stein
5 (10)
Sabah Brifingimiz burada mql5 ve on Telegram! FX Power MT4 NG , uzun zamandır çok popüler olan döviz gücü ölçerimiz FX Power'ın yeni neslidir. Peki bu yeni nesil güç ölçer ne sunuyor? Orijinal FX Power hakkında sevdiğiniz her şey PLUS GOLD/XAU güç analizi Daha da hassas hesaplama sonuçları Ayrı ayrı yapılandırılabilir analiz dönemleri Daha da iyi performans için özelleştirilebilir hesaplama limiti Özel çokluDaha fazlasını görmek isteyenler için örnek ayarlar Her grafikte en sevdiğiniz renkler i
Gold Stuff
Vasiliy Strukov
4.89 (257)
Gold Stuff, özellikle altın için tasarlanmış bir trend göstergesidir ve herhangi bir finansal enstrümanda da kullanılabilir. Gösterge yeniden çizilmez ve gecikmez. Önerilen zaman dilimi H1. Bu göstergede tam otomatik Uzman Danışman EA Gold Stuff çalışır. Profilimde bulabilirsiniz. Ayarları ve kişisel bir bonusu almak için satın alma işleminden hemen sonra benimle iletişime geçin!  Güçlü Destek ve Trend Tarayıcı göstergemizin ücretsiz bir kopyasını pm'den alabilirsiniz. Ben! AYARLAR Ok Ç
TPSproTREND PrO
Roman Podpora
4.78 (18)
TPSpro TRENDPRO  - is a trend indicator that automatically analyzes the market and provides information about the trend and each of its changes, as well as giving signals for entering trades without redrawing! The indicator uses each candle, analyzing them separately. referring to different impulses - up or down impulse. Exact entry points into transactions for currencies, crypto, metals, stocks, indices!  -  Version MT5               DETAILED DESCRIPTION                R ecommended to use with
Advanced Supply Demand
Bernhard Schweigert
4.92 (312)
CURRENTLY 26% OFF !! Best Solution for any Newbie or Expert Trader! This indicator is a unique, high quality and affordable trading tool because we have incorporated a number of proprietary features and a new formula. With this update, you will be able to show double timeframe zones. You will not only be able to show a higher TF but to show both, the chart TF, PLUS the higher TF: SHOWING NESTED ZONES. All Supply Demand traders will love it. :) Important Information Revealed Maximize the potenti
Legacy of Gann
Pavel Zamoshnikov
4.83 (12)
The indicator very accurately determines the levels of the possible end of the trend and profit fixing. The method of determining levels is based on the ideas of W.D.Gann, using an algorithm developed by his follower Kirill Borovsky. Extremely high reliability of reaching levels (according to K. Borovsky  - 80-90%) Indispensable for any trading strategy – every trader needs to determine the exit point from the market! Precisely determines targets on any timeframes and any instruments (forex, met
Enigmera
Ivan Stefanov
5 (2)
ENIGMERA: Pazarın çekirdeği https://www.enigmera.com Giriş Bu gösterge ve ticaret sistemi, finansal piyasalar için dikkate değer bir yaklaşımdır. ENIGMERA, destek ve direnç seviyelerini doğru bir şekilde hesaplamak için fraktal döngüleri kullanır. Gerçek birikim aşamasını gösterir ve yön ve hedefler verir.  İster bir trendde ister bir düzeltmede olalım çalışan bir sistem.  Nasıl çalışır? ENIGMERA üç çizgiden oluşur: destek/direnç çizgisi, hedef çizgisi ve sapma çizgisi. Sistem, geçmiş veril
Break and Retest
Mohamed Hassan
4.33 (12)
New update to V.4 where  Break & Retest automatically draws the take profit & stop loss levels and you also have more signals per day! ‍You can visually backtest Break & Retest to see how it behaved in the past!     Manual guide:   Click here $60 for a very limited time. Next price is $120   This Indicator only places quality trades when the market is really in your favor with a clear break and retest. Patience is key with this price action strategy! If you want more alert s
Şu anda %20 İNDİRİMLİ! Herhangi bir Acemi veya Uzman Tüccar için En İyi Çözüm! Bu gösterge paneli yazılımı 28 döviz çifti üzerinde çalışıyor. Ana göstergelerimizden 2'sine (Gelişmiş Para Birimi Gücü 28 ve Gelişmiş Para Birimi Dürtüsü) dayanmaktadır. Tüm Forex piyasasına harika bir genel bakış sağlar. Gelişmiş Para Birimi Gücü değerlerini, para birimi hareket hızını ve tüm (9) zaman dilimlerinde 28 Forex çifti için sinyalleri gösterir. Trendleri ve / veya scalping fırsatlarını belirlemek içi
Entry Points Pro
Yury Orlov
4.7 (225)
Yeniden boyamadan bir ticarete girmek için doğru sinyaller sağlayan MT5 için en iyi gösterge! Herhangi bir finansal varlığa uygulanabilir: forex, kripto para birimleri, metaller, hisse senetleri, endeksler. MT5 versiyonu burada Oldukça doğru alım satım sinyalleri sağlayacak ve bir alım satımı açıp kapatmanın en iyi zamanını size söyleyecektir. Göstergeyi ödeyen yalnızca bir sinyali işleme örneğiyle videoyu (6:22) izleyin! Çoğu tüccar, Giriş Noktaları Pro göstergesinin yardımıyla ilk işl
ŞU ANDA %31 INDIRIMLI !!! Yeni Başlayanlar veya Uzman Tüccarlar için En İyi Çözüm! Bu gösterge benzersiz, yüksek kaliteli ve uygun fiyatlı bir ticaret aracıdır çünkü bir dizi tescilli özellik ve gizli bir formül ekledik. Yalnızca BİR grafikle 28 döviz çiftinin tümü için Uyarılar verir. Yeni bir trendin veya scalping fırsatının tam tetik noktasını belirleyebildiğiniz için ticaretinizin nasıl gelişeceğini hayal edin! Yeni temel algoritmalar üzerine inşa edilen bu sistem, potansiyel işlemler
Özel MT4 göstergemizle başarılı forex ticaretinin sırrını keşfedin! Forex piyasasında nasıl başarıya ulaşacağınızı hiç merak ettiniz, riski en aza indirirken sürekli olarak kar kazandınız mı? İşte aradığınız cevap! Ticaret yaklaşımınızda devrim yaratacak tescilli MT4 göstergimizi tanıtmamıza izin verin. Benzersiz çok yönlülük Göstergemiz, Renko ve RangeBar Mum oluşumlarını tercih eden kullanıcılar için özel olarak tasarlanmıştır. Bu grafik türlerinin birçok deneyimli tüccar tarafından ter
Trend Screener
STE S.S.COMPANY
4.83 (88)
Trend Göstergesi, Trend Alım Satım ve Filtreleme için Çığır Açan Benzersiz Çözüm, Tüm Önemli Trend Özellikleriyle Tek Bir Araç İçinde Yerleştirildi! Forex, emtialar, kripto para birimleri, endeksler ve hisse senetleri gibi tüm sembollerde/araçlarda kullanılabilen %100 yeniden boyamayan çoklu zaman çerçevesi ve Çoklu para birimi göstergesidir. Trend Screener, grafikte noktalarla ok trend sinyalleri sağlayan etkili bir trend trend göstergesidir. Trend analizörü göstergesinde bulunan özellikler: 1.
PRO Renko Sistemi, RENKO grafikleri ticareti için özel olarak tasarlanmış son derece hassas bir ticaret sistemidir. Bu, çeşitli ticaret araçlarına uygulanabilen evrensel bir sistemdir. Sistemi etkin piyasa sana doğru ters sinyallerine erişim hakkı denilen ses nötralize eder. Göstergenin kullanımı çok kolaydır ve sinyal üretiminden sorumlu tek bir parametreye sahiptir. Aracı, seçtiğiniz herhangi bir ticaret aracına ve renko çubuğunun boyutuna kolayca uyarlayabilirsiniz. Yazılımımla karlı b
ICT, SMC, SMART MONEY CONCEPTS, SMART MONEY, Smart Money Concept, Support and Resistance, Trend Analysis, Price Action, Market Structure, Order Blocks, BOS/CHoCH,   Breaker Blocks ,  Momentum Shift,   Supply&Demand Zone/Order Blocks , Strong Imbalance, HH/LL/HL/LH,    Fair Value Gap, FVG,  Premium  &   Discount   Zones, Fibonacci Retracement, OTE, Buy Side Liquidity, Sell Side Liquidity, BSL/SSL Taken, Equal Highs & Lows, MTF Dashboard, Multiple Time Frame, BigBar, HTF OB, HTF Market Structure, 
Öncelikle, bu Ticaret Aracının Non-Repainting, Non-Redrawing ve Non-Lagging Gösterge olduğunu vurgulamakta fayda var, bu da onu profesyonel ticaret için ideal hale getiriyor. Çevrimiçi kurs, kullanıcı kılavuzu ve demo. Akıllı Fiyat Hareketi Kavramları Göstergesi, hem yeni hem de deneyimli tüccarlar için çok güçlü bir araçtır. İleri ticaret fikirlerini, Inner Circle Trader Analizi ve Smart Money Concepts Ticaret Stratejileri gibi 20'den fazla kullanışlı göstergeyi bir araya getirerek bir araya g
TakePropips Donchian Trend Pro
Eric John Pajarillaga Aldana
4.82 (17)
TakePropips Donchian Trend Pro   (MT4), Donchian Kanalı'nı kullanarak trendin yönünü otomatik olarak tespit eden ve size ticarete giriş ve çıkış sinyalleri sağlayan güçlü ve etkili bir araçtır! Bu çok işlevli gösterge, bir trend tarayıcı, ticaret sinyalleri, istatistiksel panel, tarayıcı, ticaret oturumları ve uyarı geçmişi panosu içerir. Size ticaret sinyalleri sağlamak ve çizelgeleri analiz ederek saatlerce tasarruf etmenizi sağlamak için tasarlanmıştır! Kullanım kılavuzunu ve kurulum kılavuzu
3 Indicators in 1 indicator Strategy based on price action Made specifically for the best forex currency pairs Can be used in the best time frame of the market at a very reasonable price This indicator is basically 3 different indicatos . But we have combined these 3 indicators in 1 indicator so that you can use 3 indicators at the lowest price. All three strategies are based on price action. But based on different trends. Long term, medium term and short term Attributes : No repaintin
Auto Order Block with break of structure based on ICT and Smart Money Concepts (SMC) Futures Break of Structure ( BoS )             Order block ( OB )            Higher time frame Order block / Point of Interest ( POI )    shown on current chart           Fair value Gap ( FVG ) / Imbalance   -  MTF      ( Multi Time Frame )    HH/LL/HL/LH  -  MTF      ( Multi Time Frame )  Choch  MTF      ( Multi Time Frame )  Volume Imbalance     ,  MTF          vIMB Gap’s Power of 3 Equal High
Currency Strength Wizard , başarılı ticaret için size hepsi bir arada çözüm sağlayan çok güçlü bir göstergedir. Gösterge, birden çok zaman dilimindeki tüm para birimlerinin verilerini kullanarak şu veya bu forex çiftinin gücünü hesaplar. Bu veriler, şu veya bu para biriminin gücünü görmek için kullanabileceğiniz, kullanımı kolay para birimi endeksi ve para birimi güç hatları biçiminde temsil edilir. İhtiyacınız olan tek şey, işlem yapmak istediğiniz tabloya göstergeyi eklemektir ve gösterge size
PZ Trend Trading
PZ TRADING SLU
4.75 (4)
Trend Trading is an indicator designed to profit as much as possible from trends taking place in the market, by timing pullbacks and breakouts. It finds trading opportunities by analyzing what the price is doing during established trends. [ Installation Guide | Update Guide | Troubleshooting | FAQ | All Products ] Trade financial markets with confidence and efficiency Profit from established trends without getting whipsawed Recognize profitable pullbacks, breakouts and early reversals The ind
Full Forex Market View Dashboard
Opengates Success International
5 (2)
TAM FOREX PİYASASI GÖRÜNÜMÜ Pano Göstergesi Bu, Yatırımcılara piyasada neler olup bittiğine dair tam bir görüş sağlamak için oluşturulmuş özel bir göstergedir. Piyasaya erişmek ve başarılı ticaret yapmak için gereken her türlü bilgiyi görüntülemek için gerçek zamanlı bir veri kullanır. KURULUM: Bu Göstergeyi pencere grafiğinize eklemeden önce, MT4'ünüzün Piyasa İzleme paneline gidin ve ihtiyaç duymadığınız veya ticaret yapmadığınız tüm Döviz çiftlerini GİZLEYİN ve geri kalanını orada bı
Volatility Trend System - girişler için sinyaller veren bir ticaret sistemi. Oynaklık sistemi, trend yönünde doğrusal ve noktasal sinyaller ve ayrıca yeniden çizme ve gecikme olmaksızın trendden çıkmak için sinyaller verir. Trend göstergesi, orta vadeli trendin yönünü izler, yönünü ve değişimini gösterir. Sinyal göstergesi volatilitedeki değişikliklere dayalıdır ve piyasa girişlerini gösterir. Gösterge, çeşitli uyarı türleri ile donatılmıştır. Çeşitli alım satım araçlarına ve zaman dilimler
Yazarın diğer ürünleri
True Direction Oscillator
Muhammad Elbermawi
4.89 (493)
Veya "Saf Momentum " ilkesini kullanarak fiyat değişim oranını ölçen bir endeks olan (TDO). Bir menkul kıymet fiyatı 10'dan 15'e yükseldiğinde, fiyat değişim oranı %150'dir, ancak 15'ten 10'a düştüğünde, fiyat değişim oranı sadece %33.3'tür. Bu nedenle, "Fiyat Değişim Oranı" (ROC) veya "Momentum" gibi teknik analiz göstergeleri, artan fiyat hareketleri için azalan hareketlere göre daha yüksek değerler verir. TDO, yatırımcıların momentumu doğru okumalarına yardımcı olmak için bu sorunu düzeltir
MASR Bands
Muhammad Elbermawi
5 (10)
Ya da E Oving bir verage S upport R esistance Gruplar. MASR Bantları göstergesi, destek ve direnç seviyeleri olarak birlikte çalışan iki bantla çevrili hareketli bir ortalamadır. İstatistiksel olarak, MASR Bantları zamanın %93'ünde fiyat mumları içerir. Adımlarda şu şekilde hesaplanır: 1. İlk adım, bir X dönemi için en yüksek yüksek (HHV) ve en düşük düşük (LLV) hesaplamaktır. 2. İkinci adım, aralarındaki mesafenin yüzde olarak ne kadar geniş olduğunu bulmak için HHV'yi LLV'ye bölmektir.
Bermaui Channel
Muhammad Elbermawi
5 (27)
This is a price channel that shows five important price levels on the chart. Those levels are: 1. The Highest High (HH) of the previous x bars. 2. The Highest Low (HL) of the previous x bars. 3. The Center Line. 4. The Lowest High (LH) of the previous x bars. 5. The Lowest Low (LL) of the previous x bars. How does Bermaui Channels Captures Overbought  area Think of the distance between HH and HL levels as an overbought area. When the price candles or bars crosses the HL to the upside this
Bermaui Bands
Muhammad Elbermawi
4.94 (89)
Bermaui Bantları (BB), değişen ve trend olan fiyat hareketleri arasında filtrelemeye yardımcı olan bir teknik analiz aracıdır. Bu göstergenin arkasındaki fikir, sonraki adımlarda açıklanabilir: 0 ile 100 arasında hareket eden bir osilatör olarak Standart Sapmayı hesaplayın. Ben buna Bermaui Sapma yüzdesi (BD %) adını vereceğim. "BD %" sıfıra yakınsa, oynaklık en uç noktadadır. Ayrıca "BD %" 100'e yakınsa oynaklık çok düşüktür. Yüksek oynaklık, trend olan bir piyasa için büyük bir olasılık anlamı
Moving Average Cloud
Muhammad Elbermawi
4.93 (14)
Veya "MAC". Bu, trendi yakalamanıza ve takas etmenize yardımcı olmak için tasarlanmış bir göstergedir. Bu göstergenin arkasındaki fikir, sonraki adımlarda açıklanabilir: Hızlı hareket eden bir ortalama Zarf çizin. Yavaş hareket eden bir ortalama Zarf çizin. MAC Üst Bandı, her iki Zarfın en yükseği arasındaki en yüksek değerdir. MAC Alt Bandı, her iki Zarfın alt kısmı arasındaki en düşük değerdir. MAC Histogram Bulutu, yön değişikliğinizi göstermek için iki bant arasındaki mesafeyi doldurur. M
Bermaui Deviation Percent
Muhammad Elbermawi
4.94 (129)
Veya oynaklığı puan yerine yüzde olarak ölçen bir oynaklık endeksi olan ( BD% ). BD% fikri, yüzde 0 ile 100 arasında hareket eden Klasik Standart Sapma'ya (CSD) bağlı bir endeks yapmaktır. Farklı zaman dilimlerinde veya farklı zaman dilimlerinde aynı güvenlik için oynaklığı karşılaştırmak için BD%'yi kullanabilirsiniz. Ayrıca, farklı piyasalardaki farklı menkul kıymetler arasındaki oynaklığı puan yerine yüzde cinsinden karşılaştırmak için BD%'yi kullanabilirsiniz. "BD%" NASIL KULLANILIR
Or DBD%. The indicator consists of colored tape that shows trading signals depending on two Bermaui Deviation Oscillator (BD%) and two moving averages. Bermaui Deviation Percent is a volatility index that measures volatility in percent rather than points. The idea of BD% is to make an index depending on Classic Standard Deviation (CSD) that moves between 0 and 100 percent. Important Information DBD% expert advisor example:  https://www.mql5.com/en/blogs/post/731145 If you want to know mor
Bermaui Manual EA
Muhammad Elbermawi
5 (10)
Bu, ızgara sistemi ticareti yapan yarı otomatik bir uzman danışmandır. Buradaki fikir, piyasada kademeli olarak farklı pozisyonlar almak ve daha sonra onlar için başa baş seviyesini hesaplamaktır. Fiyatlar bu başabaş noktasını önceden belirlenmiş bir mesafe kadar aştığında, açılan tüm emirler kapanır. Önemli bilgi İşte kullanıcı kılavuzu:   https://www.mql5.com/en/blogs/post/730567 Bu EA'yı diğer ürünlerimden herhangi biriyle burada deneyebilirsiniz: https://www.mql5.com/en/users/bermaui314/
Bermaui Pin Bars
Muhammad Elbermawi
5 (22)
Bermaui Pim Çubukları Veya (BPB), grafikte Pin Bar fiyat hareket modelini bulan bir göstergedir. Pin Barlar, Hammer, Inverted-Hammer, Hanging Man, Shooting Star, Dragon Fly Doji veya Grave Stone Doji gibi uzun üst veya alt gölgeli ve çok küçük gövdeli Japon şamdanlarına alternatif olan klasik bir çubuk deseni olan "Pinokyo Çubukları" için bir kısayoldur. . Bermaui Pin Bars göstergesi, sonraki adımlarda açıklanabilecek bir formüle bağlı olarak bu kalıbı bulur: İlk BPB'de mum gövdesinin merkez
Classic Keltner Channel
Muhammad Elbermawi
4.9 (40)
Veya CKC. Bu gösterge, Chester W. Keltner (1909–1998) tarafından tanımlanan klasik on günlük hareketli ortalama kuralına bağlı olarak çalışır. Tüm parametreler varsayılan olarak Keltner sisteminin klasik versiyonuna ayarlanmıştır, kullanıcı isterse bunları değiştirebilir. Önemli bilgi CKC Kılavuzunu okuyun: https://www.mql5.com/en/blogs/post/736577 CKC Uzman Danışman Örneği: https://www.mql5.com/en/blogs/post/734150 Keltner Kanal Formülü Hakkında 1. Merkez Çizgiyi, Tipik Fiyattan (= (Yüks
Bermaui RSI Candles
Muhammad Elbermawi
5 (7)
Bu göstergenin fikri, alım ve satım sinyalleri oluşturmak için fiyat çizelgeleri ile karşılaştırılabilecek mum şeklinde RSI çizmektir. Gösterge benim buluşum değil. Birkaç yıl önce internette kurdum. Kodu güncelledim, uyarı işlevleri ekledim, Bermaui Utilities araç grubunu ekledim. Gösterge, mum çubukları çizmek için kullanılan tüm fiyatların RSI'sını hesaplar (açık, yüksek, düşük ve kapalı RSI). RSI mumlarını yüksek fitili çekmek için en yükseklerini ve RSI mumlarını düşük fitili çekmek için
Horus EA
Muhammad Elbermawi
3.67 (3)
MT4 için Horus EA Binlerce yıl önce, eski Mısırlılar topraklarını ölçmek ve mallarını tartmak için kullandıkları bir sayma sistemi icat ettiler. Bu sistem " Horus'un Gözü " olarak biliniyordu. Horus'un Gözü, tanrı Osiris efsanesiyle ilişkilendirildi ve firavunların kutsal sembollerinden biri oldu. Ünlü "Martingale Sistemi"nden %89 daha güvenli olan negatif ilerlemeli bir para yönetim sistemi oluşturmak için Horus'un Gözü'ndeki Fibonacci dizisiyle matematiksel denklemleri kullandım. EA'nın te
Filtrele:
Paulina Andrea Madariaga Figueroa
4147
 

Very good indicator, I have spent money in another indicators and with Bermaui tools I have everything.

Deepan Kalaiselvan
231
Deepan Kalaiselvan 2021.04.13 04:35 
 

Nice trend indicator

Kahraman Senol
1635
Kahraman Senol 2021.03.02 14:17 
 

Special Thanks to Muhammad Elbermawi, i bought BACD Cloud, Bermaui Bands, Bermaui Deviation Percent and True direction oscillator. I am using them on my real trading account with MA50 and ichimoku indicators. Successful trade rate is over %70. This is enough for me. i decided to write a EA which uses all 6 indicators.I confirm the entry point buy or sell with all 6 indicators at the same time. It is five star product at the price.

https://www.mql5.com/en/signals/1195681

Tim Rijnbeek
1341
Tim Rijnbeek 2020.07.25 20:08 
 

Useless too many false signals , two stars for the effort

Ferrari888
593
Ferrari888 2020.07.12 21:07 
 

Хороший индикатор .Мухаммед очень любезен подробно все объяснит и всегда отвечает на вопросы. Честный и порядочный человек.Спасибо Мухаммед.

[Silindi] 2020.06.04 01:23 
 

Kullanıcı incelemeye herhangi bir yorum bırakmadı

MAKARIOS YACOUBIAN
2901
MAKARIOS YACOUBIAN 2020.04.17 01:25 
 

its my Second Indicators From Mr.Muhammad , again thanks for your excellent service, professional job . update 09.06.2020 , so far i am using this indicator in daily basis . good

Frank Paetsch
7112
Frank Paetsch 2020.03.16 01:03 
 

verry good. thank you

Nieco Pama
248
Nieco Pama 2020.01.20 14:17 
 

Kullanıcı incelemeye herhangi bir yorum bırakmadı

IK°L
815
IK°L 2019.12.31 18:13 
 

Kullanıcı incelemeye herhangi bir yorum bırakmadı

İncelemeye yanıt
Sürüm 2.1 2020.03.30
1. Fixed a small bug in the de-initialization function, that used to cause the "Symbols Switch" tool not to work properly.
2. Organized the indicator parameters in a better style.
.
Note:
I didn't make any changes on TDO basic formula. It is still the same.
I didn't make serious changes in indicator parameters or buffers.
Sürüm 2.0 2020.02.24
Fixed small bugs in the alert messages.
Fixed a small bug in the de-initialization function, that used to cause the symbols switch tool not to work properly.
.
Note:
I didn't make any changes on TDO basic formula. It is still the same.
I didn't make any changes in indicator parameters or buffers.