• Genel bakış
  • İncelemeler
  • Yorumlar (2)
  • Yenilikler

Probability distribution PRO

Indicator is used for:

  1. defining price probability distributions. This allows for a detailed representation of the channel and its borders and forecast the probability of a price appearing at each segment of its fluctuations;
  2. defining the channel change moment.


Operation principles and features

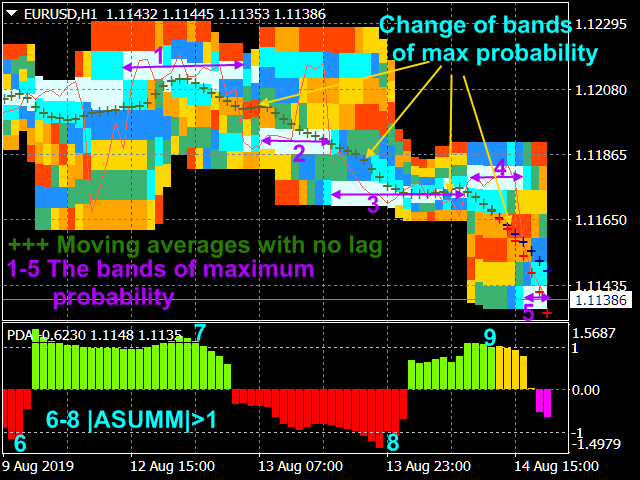
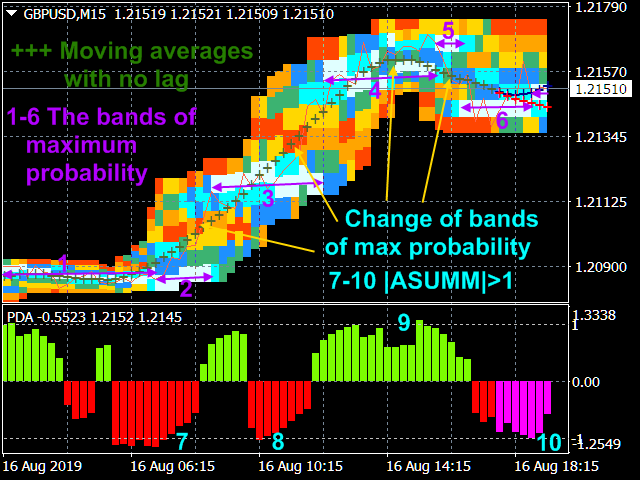
Indicator analyzes a quote history on lower timeframes and calculates a price probability distribution on higher ones. Forecast algorithms allow the indicator to calculate probability distributions and moving averages without delays that usually accompany conventional moving averages.

The indicator operation is based on processing a deep and detailed quote history. Therefore, before launching indicator on a symbol chart, make sure to download the quote history ( Tools/History Center) of the symbol and increase "Max bars in history" and "Max bars in chart" to the maximum possible value ( Tools/Options/Charts). Indicator produces a large amount of calculations and therefore is resource-intensive. It requires at least a 4-core 2.8 GHz CPU and 4.00 GB of RAM. If the indicator causes much load on MetaTrader 4, decrease the "Number of countable bars of the current chart" parameter in the indicator settings having the default value of 200.

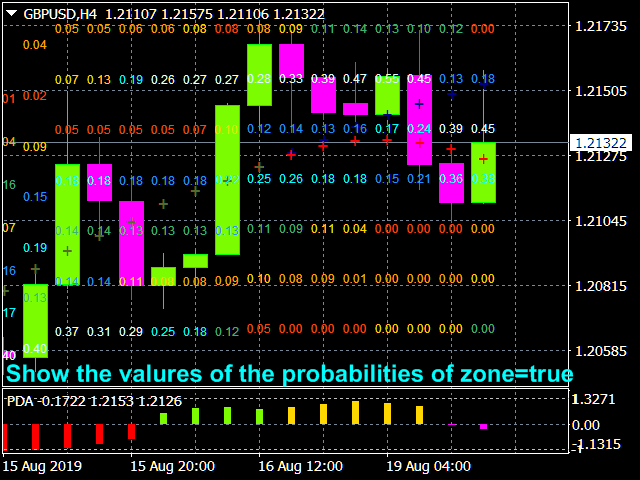
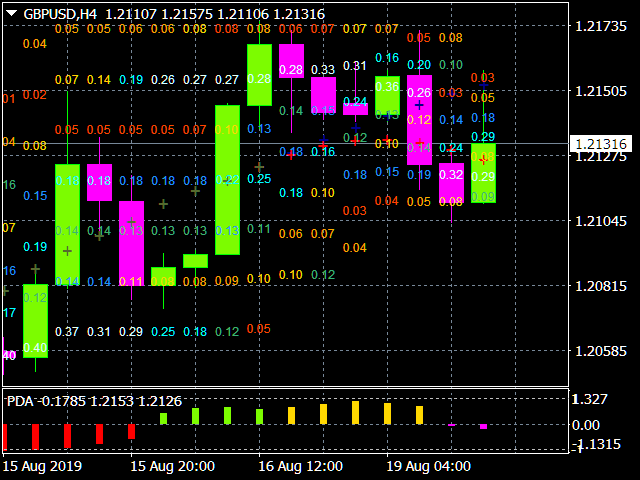
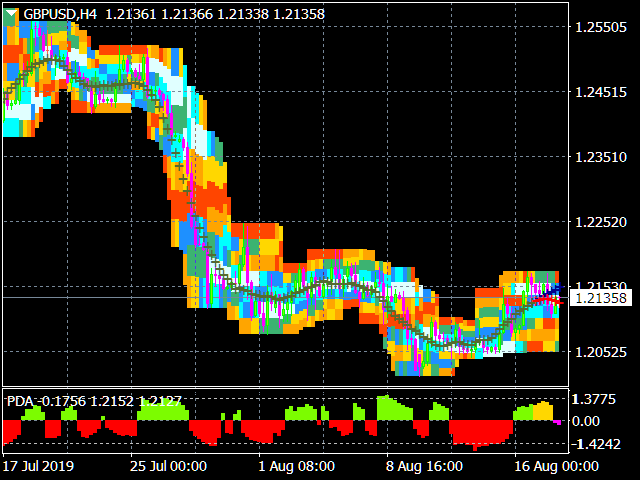
The program splits the total price fluctuation for a given averaging period by seven equal intervals and calculates the frequency of price hits at these intervals. Based on these calculations, the indicator builds the probability columns, which can be displayed in the main terminal window in two ways:

  1. as a color code, by the type of the visible light spectrum when the most probable values are closer to the violet area, while the least probable values ​​are close to the red one. The intervals are colored accordingly (the order of coding of the decreasing probability by means of the color scale is specified in the settings and can be changed by users);
  2. as values specifying the probability of hitting the given intervals with the corresponding color.

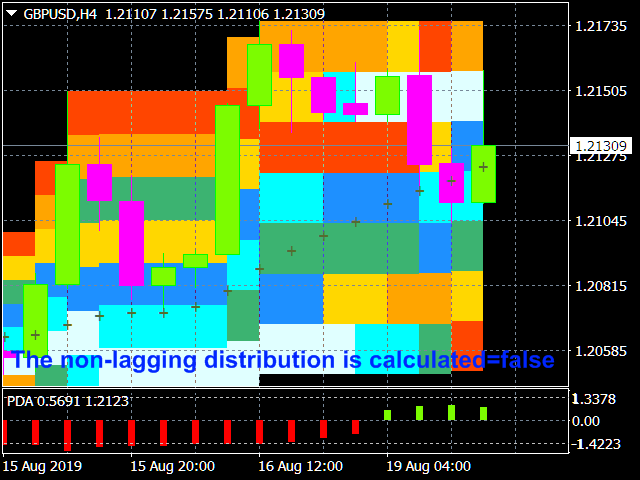
The indicator also calculates non-lagging  normalized asymmetry

ASUMM=   (< (x - <x>)^3 >)^(1/3)/ (< (x - <x>)^2 >)^(1/2)  ,

where <...> is the averaging sign, which, when it is module exceeded  the unit, serves as a powerful signal to change the direction of a previously established trend.     


Operation modes and settings
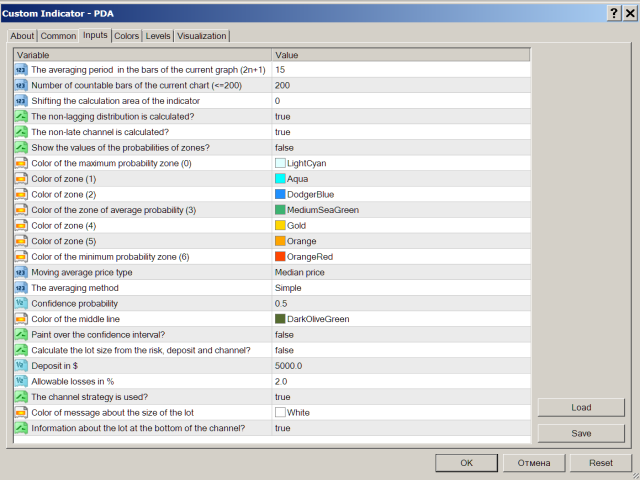
Algorithm settings:

  • The averaging period in the bars of the current graph (2n+1) - averaging period (1-99).
  • Number of countable bars of the current chart (<=200) - number of calculated indicator graph bars (1-200).
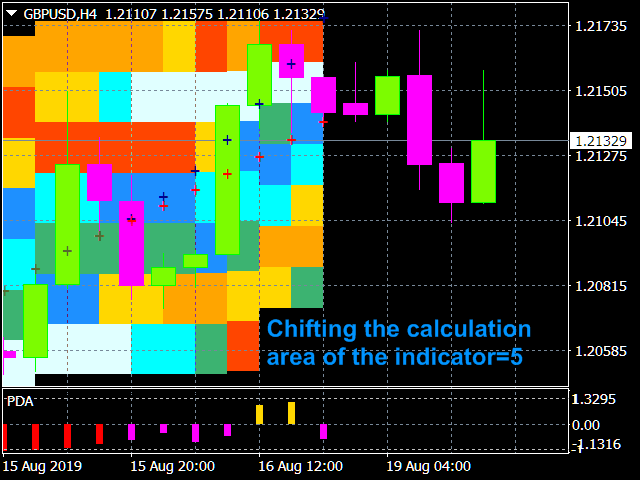
  • Shifting the calculation area of the indicator - global indicator shift (0-100).
  • The non-lagging distribution is calculated - calculate a non-lagging distribution.
  • The non-late channel  is calculated - calculate the current non-lagging channel.
  • Show the values of the probabilities of zones - display area probability values.

Color and display settings:

Colors in probability density descending order.

  • Color of the maximum probability zone (0);
  • Color of zone (1);
  • Color of zone (2);
  • Color of the zone of average probability (3);
  • Color of zone (4);
  • Color of zone (5);
  • Color of the minimum probability zone (6);
  •    

Parameters of non-lagging moving average.

  • Moving average price type.
  • The averaging method.
  • Confidence probability -   Values:   from 0  to  0.999 (0.5 by default).
  • Color of the moving average line=clrDarkOliveGreen; - The color of the indicator line and its figure sector.
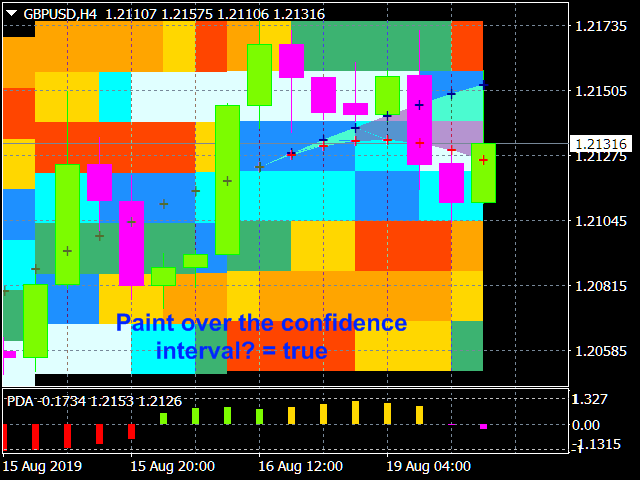
  • Paint over the confidence interval? Values: true,   false(by default).


Trading mode settings:

  • Calculate the lot size from the risk, deposit and channel
  • Deposit in $
  • Allowable losses in %
  • The channel strategy is used - true - intra-channel strategy (false - channel breakthrough strategy)
  • Color of message about the size of the lot
  • Information about the lot at the bottom of the channel (false - information at the top of the channel)


Using in trading


Intra-channel strategy. The strategy is used in case of a formed white line - area of maximum probability. Open order when the price deviates into the yellow or orange areas. Close when the price returns to the white area.

Trend-following strategy. An order is opened when a change of band is identified (the middle falls into the red or yellow sector).

StopLoss is placed slightly further than the channel borders.

Önerilen ürünler
Middle Volume
Stefan Stoyanov
3.5 (2)
The indicator measures volumes on different charts and instruments. Its main advantage is the ability to compare separate brokers. The less Middle Volume and Tick / Second , the more reliable is the broker. There is a comment in the upper left corner Comment data: Tick/Second — number of ticks per second for a selected instrument Middle Volume — average volumes in the penultimate bar This indicator allows tracking a relative market activity for different timeframes. If the volumes are lower than
FREE
Market Profile 3
Hussien Abdeltwab Hussien Ryad
4 (4)
Market Profile 3 MetaTrader 4 indicator  — is a classic Market Profile implementation that can show the price density over time, outlining the most important price levels, value area, and control value of a given trading session. This indicator can be attached to timeframes between M1 and D1 and will show the Market Profile for daily, weekly, monthly, or even intraday sessions. Lower timeframes offer higher precision. Higher timeframes are recommended for better visibility. It is also possible t
FREE
In the age of speed, everyone wants to gets what he/she wants quickly. Trading is all about gaining money, and scalping is a way of doing it in a short time. The "Scorpion Scalper Pro" has been named on the scorpion because of its speed. The indicator serves to provide signals for the M15 timeframe. It also sends Alerts (window alert, email alert, push notification alert) whenever a buy/sell signal occurs, and the alerts are customizable (they can be turned ON or OFF). Indicator inputs : - Buy
Volume Delta Panel
Chantal Sala
4.54 (13)
Volume DeltaPanel is a very powerful indicator that read the supply on Market. It calculates the Delta from movement of the price and the difference of BUY volumes and SELL volumes. The Volumes are added to price and normalized to symbol points. Its special structure allows you to get all Time Frames values available on the platform MT4. Panel can show 28 instruments simultaneously all customizable according to the offer of the Broker. A good observation of this instrument can suggest great en
The indicator allows you to trade binary options. The recommended time frame is М1 and the expiration time is 1,2,3 minutes. The indicator suitable for auto and manual trading. A possible signal is specified as a arrows above/under a candle. You should wait until the candle closes! Arrows are not re-painted Trade sessions: TOKYO section (Half-end) Currency pairs: USD/JPY Working time frame: M1 Expiration time: 1,2,3 minutes. The indicator also shows good results when using the martingale strateg
FREE
Max Volume
Maksim Slovakov
Подкрашивает аномально большие тиковые объёмы в красный цвет. Имеет следующие настройки: "Процент" по умолчанию "70"  (Процент на который аномальный объём должен быть больше предыдущего) "Уровень" по умолчанию "500" (Количество тиков, больше которого будем брать во внимание аномальный объём) Внимание! Данный индикатор был разработан для мелких таймфреймов M1,M5,M15. Идея в том, что на таких Таймфреймах увеличение количества тиков говорит об увеличении количество сделок, увеличения интереса к цен
Market Profile
Artem Titarenko
5 (1)
The "Market Profile" indicator displays the profiles and volumes of periods – weekly, daily, session (8-hour), 4-hour, hour, summary. The VAH/VAL price area is automatically highlighted by a dotted line for each profile (except for the summary). The indicator includes chroma Delta, which colors the profile areas. The areas of prevailing Buys is colored in green, that of Sells - in red. The intensity histogram features blue/red respectively. In the filter mode, the indicator displays the volume a
VWAPIndicator
Ahmet Metin Yilmaz
Volume-weighted average price In finance, volume-weighted average price (VWAP) is the ratio of the value traded to total volume traded over a particular time horizon (usually one day). It is a measure of the average price at which a stock is traded over the trading horizon. VWAP is calculated using the following formula: *It is shown second screenshot in the screenshots. trade that takes place over the defined period of time, excluding cross trades and basket cross trades. for more informatio
This is the FXTraderariel PowerTrend . It compute a trendfollowing system based on it own algorithm. It gives you a buy or sell signal based on the trend. It based on the Supertrend, but our Version is not repainting. Furthermoore we added some Improvements and you can get an Arrow, Push or Alert when the trend changes. Depending on the settings it and trading style, it can be used for scalping or long-term trading . The indicator can be used on every time frame , but we advise to use it on H1
Impulse fractals indicator - is counter-trend oriented complex market fractal pattern.  Market creates bull/bear impulse, trend starts, fractals on impulsed wave are an agressive pullback signals. Buy arrow is plotted when market is bearish and it's impulse showed up-side fractal, and sell arrow is plotted when market is bullish and it's impulse showed dn-side fractal. Main indicator's adjustable inputs : impulsePeriod - main period of impulse histogram  filterPeriod  - smoothes impulse accordi
The SPV Volatility indicator is one of the most effective filters. Volatility filter. Shows three volatility options. The so-called limit, real, and the last most effective filter for the filter is the percentage filter. Percentage display of folatility shows the ratio of limit to real volatility. And thus, if we trade in the middle of the channel, then it is necessary to set a condition that the percentage is less than a certain indicator value. If we trade on the channel breakout - following t
Rhino NW
Sergei Shishaev
Нестандартный индикатор определения текущего тренда. Альтернативный подход к определению текущей рыночной тенденции. В основе лежит уникальный алгоритм. Не используются   скользящие средние , осцилляторы , супер-тренды и прочие стандартные индикаторы. Для таймфреймов:   от M15 до D1 . Для стилей торговли:  интрадэй, свинг, долгосрок . Может стать готовой торговой стратегией совместно с любым канальным индикатором. Например таким, как индикатор   "Snake" . Внимание! Это индикатор, а не советни
Multi Level Trend Direction
Filip Maurice Daelman
1 (1)
Multi Level Trend Direction is an indicator that identifies the most accurate buy/sell swing points with the highest probability, based on multi-level Zig Zag Swings. The indicator draws a color Zig Zag at the Higher Highs, Higher Lows, Lower Lows and Higher Lows in the chart, but based on two level Zig Zag Swing. If the fast price swing is in line with the trend of the slow price swing, then the buy/sell trend lines are bigger. If the price swing is against the trend, no lines are drawn to si
Blahtech VWAP
Blahtech Limited
5 (2)
Was: $69    Now: $34   Blahtech VWAP - Volume Weighted Average Price (VWAP) is the ratio of price to total volume. It provides an average price over a specified time interval.  Links [  Install  |  Update  |  Documentation   ] Feature Highlights Configurable VWAP Line Sessions, intervals, anchored or continuous Previous day settlement line Standard Deviation bands Alerts at bar close or real time Automatic Broker or Tick volumes Significantly reduced CPU usage Input Parameters Expert Advis
İşlem hacimlerine ilişkin okumaları hesaplayan teknik bir gösterge. Histogram biçiminde, ticaret enstrümanının hareket gücünün birikimini gösterir. Yükseliş ve düşüş yönleri için bağımsız hesaplama sistemlerine sahiptir. Herhangi bir ticaret enstrümanı ve zaman dilimi üzerinde çalışır. Herhangi bir ticaret sistemini tamamlayabilir. Gösterge değerlerini yeniden çizmez, sinyaller mevcut mum üzerinde görünür. Kullanımı kolaydır ve grafiği yüklemez, ek parametre hesaplamaları gerektirmez. Değiştir
'Zig Zag Percentage strenght'   This indicator is awesome. Why? It's able to show the percentage of the last leg, compared with the previous leg. In this way you have a better understanding of the forces in play in that moment.   In fact, for example, if you see that the up extensions are, in percentage, greater of the down legs, that means that there is more bullish pressure or maybe the market is starting to reverse from downtrend to uptrend.   Hope you will ind it useful !
The intelligent algorithm of the Godfather indicator accurately determines the trend, filters out market noise and generates entry and exit levels. The indicator will help in finding entry points when analyzing the price chart. The program first receives a "snapshot" of the graph, then analyzes it. The results are reported to the trader in the form of signals. The main purpose of this indicator is to determine the moments of entries and exits from transactions, so the indicator displays only th
Snake NW
Sergei Shishaev
5 (1)
Канальный индикатор "Snake" . Отлично показывает точки входа и выхода. Не перерисовывает! Хорошо подойдет для стратегий с сетками (усреднения), стратегий с пирамидами (стратегий добора), обычной торговли по тренду, торговли на коррекции. Для любых типов инструментов:   валюты, нефть, металлы, криптовалюты. Для любых таймфреймов:   от M1 до D1 . Для любых стилей торговли:   скальпинг, интрадэй, свинг, долгосрок . Используйте в сочетании с трендовым индикатором, чтобы исключить риски вх
Pips forex - is a ready trading system . This indicator shows with arrows on the chart when and in what direction you need to open an order. If the arrow is green, then we open a buy deal, and if the arrow is red, then we open a sell deal. Everything is very simple and quite effective. TakeProfit set 15-25 points. StopLoss set at the level of points. When the dots move, we immediately override the StopLoss. Recommended timeframe for trading M1 and M5. This is a scalping strategy and works best
Qv2 OBOS
Joao Marcilio
Qv² OBOS is an indicator that aims to identify overbought and oversold regions considering price standard deviation and volume analysis. Oversold signals are indicated by arrows pointing upwards. Overbought signals are indicated by arrows pointing downwards. Can be used in all timeframes. Can be used on all pairs. I use in H1 Important note, the histogram is displayed to improve the trader's analysis. But the signs of overbought and oversold are the arrows as mentioned above. Important no
Blahtech Market Profile
Blahtech Limited
4.61 (18)
Was: $249  Now: $99   Market Profile defines a number of day types that can help the trader to determine market behaviour. A key feature is the Value Area, representing the range of price action where 70% of trading took place. Understanding the Value Area can give traders valuable insight into market direction and establish the higher odds trade. It is an excellent addition to any system you may be using. Blahtech Limited presents their Market Profile indicator for the MetaTrader community. Ins
TPO Profile MT4
Kyra Nickaline Watson-gordon
5 (1)
Definition : TPO is a Time Price Opportunity. Instead of using bars or candles with an Open, High, Low, and Close price, each "bar" in a Market Profile is represented by horizontal bars against the price It is called Market Profile terminology. In other words time-price-opportunity (TPO) profiles are histograms of how much time was spent at each price within the span of the profile. By using a TPO chart, you are able to analyze the amount of trading activity, based on time, for each price lev
Time Bubble ***Specialized for GBPJPY 1H time frame*** (tested for two years with success rates about 82%) Time Circle's smart algorithm detects the price circles with time . give strong signals at the right time as result of combine the price and time. our team spent months to develop this indicator specially for GBPJPY ..with high success rates about 82% win trades over two years .tested from December 2016 to November 2018. *** in last two years total signals 1012 with 829 Wins and
This indicator will allow you to evaluate single currency linear regression. WHAT IS LINEAR REGRESSION?(PIC.3) Linear regression is an attempt to model a straight-line equation between two variables considering a set of data values. The aim of the model is to find the best fit that can serve the two unknown values without putting the other at a disadvantage. In this case, the two variables are price and time, the two most basic factors in the Forex market. Linear regression works in such a wa
MSHT Head&Shoulders indicator for MT4 automatically scans the chart for head and shoulders candlestick patterns. Obviously, the scanner shows the Symbol, Timeframe, Direction, Pattern Name, Age, and Chart time frame in which the head and shoulders pattern is identified. Furthermore, the scanner displays the inverted head and shoulders pattern also. So, forex traders can BUY or SELL based on the head and shoulders candlestick pattern. Additionally, the indicator also scans and plots emerging head
PipFinite Impulse PRO
Karlo Wilson Vendiola
4.95 (87)
Are You Tired Of Getting Hunted By Spikes And Whipsaws? Don't become a victim of the market's erratic moves.. Do Something About It! Instantly make smarter decisions with Impulse Pro's precise balance of filters and accurate statistics. Timing Is Everything In Trading To learn more, please visit www.mql5.com/en/blogs/post/718212 Anticipate the next big move before it unfolds in 3 Simple Steps! Advantages You Get Early impulse detection algorithm. Flexible combination to different tr
The GENEVA trading system this is a tool that can conduct a comprehensive analysis of the Forex market, stock market, and cryptocurrency market. With this tool, you will receive ready-made signals to enter the market. Let's see what the system looks like: To begin with, the system is exclusively trend-based, which means that you are already in a winning situation, because you only work on the trend. The system has its own trend/flat analyzer built in. This means that during lateral moveme
Reverse side scalper is the manual trading system, that works on choppy(anti-trend) market. As a rule markets are on 80% choppy and only 20% is trend phase. System is based on custom step Moving and RSI and reverse pattern. System defines up movement, down movement, trend / choppy phases. Indicator plots Buy signal arrow when current direction is down and phase is trend, Sell signal arrow is plotted when currently is up movement and phase is trend. As a rule it allows to "catch" local maximum/mi
The Market Sentiment Meter indicator calculates the saturation levels of the price chart. A signal to exit the oversold zone indicates a buying opportunity, and a signal to exit the overbought zone indicates a selling opportunity. Typically, for this indicator you need to set relative values for the overbought (Top) and oversold (Bottom) levels. Often a good trend can be seen visually on the price chart. However, an experienced trader must clearly understand the current distribution of forces
Forex Gump Dot is a ready-made mechanical trading system for the +10 pips strategy. This strategy has been actively discussed and developed on the Internet for several years. The essence of this strategy is to open trade operations during the day and fix the minimum profit on each trade operation. That is, scalp. Our development team decided to adapt the indicators of the Forex Gump family and release a new product that will best match the scalping trading strategy. This product is Forex Gump Do
Bu ürünün alıcıları ayrıca şunları da satın alıyor
Atomic Analyst
Issam Kassas
5 (1)
Öncelikle belirtmek gerekir ki bu Ticaret Göstergesi Yeniden Çizim Yapmaz, Gecikmez ve Gecikme Göstermez, bu da hem manuel hem de robot ticareti için ideal hale getirir. Atom Analisti, Piyasada Daha İyi Bir Avantaj Bulmak İçin Fiyatın Gücünü ve Momentumunu Kullanan PA Fiyat Hareketi Göstergesidir. Gürültüleri ve Yanlış Sinyalleri Kaldırmaya ve Ticaret Potansiyelini Artırmaya Yardımcı Olan Gelişmiş Filtrelerle Donatılmıştır. Birden fazla katmanlı karmaşık göstergeler kullanarak, Atom Analisti
ŞU ANDA %26 INDIRIMLI Yeni Başlayanlar veya Uzman Tüccarlar için En İyi Çözüm! Bu Gösterge benzersiz, yüksek kaliteli ve uygun fiyatlı bir ticaret aracıdır çünkü bir dizi tescilli özellik ve yeni bir formül ekledik. Sadece BİR grafik ile 28 Forex çifti için Döviz Gücünü okuyabilirsiniz! Yeni bir trendin veya scalping fırsatının tam tetik noktasını belirleyebildiğiniz için ticaretinizin nasıl gelişeceğini hayal edin? Kullanım kılavuzu: buraya tıklayın Bu ilk olan, orijinal! Değersiz bir
TPSproTREND PrO
Roman Podpora
5 (15)
TPSpro TRENDPRO  - is a trend indicator that automatically analyzes the market and provides information about the trend and each of its changes, as well as giving signals for entering trades without redrawing! The indicator uses each candle, analyzing them separately. referring to different impulses - up or down impulse. Exact entry points into transactions for currencies, crypto, metals, stocks, indices!  -  Version MT5               DETAILED DESCRIPTION        /       TRADING SETUPS           
Tanıtım       Kuantum Trend Keskin Nişancı Göstergesi   , trend tersine dönmeleri belirleme ve ticaret yapma şeklinizi değiştiren çığır açan MQL5 Göstergesi! 13 yılı aşkın ticaret tecrübesine sahip deneyimli tüccarlardan oluşan bir ekip tarafından geliştirilmiştir.       Kuantum Trend Keskin Nişancı Göstergesi       trend dönüşlerini son derece yüksek doğrulukla belirlemenin yenilikçi yolu ile ticaret yolculuğunuzu yeni zirvelere taşımak için tasarlanmıştır. ***Kuantum Trend Keskin Nişancı Gö
Scalper Inside PRO
Alexey Minkov
4.75 (55)
SALE NOW! Limited Time Offer! An exclusive indicator that utilizes an innovative algorithm to swiftly and accurately determine the market trend. The indicator automatically calculates opening, closing, and profit levels, providing detailed trading statistics. With these features, you can choose the most appropriate trading instrument for the current market conditions. Additionally, you can easily integrate your own arrow indicators into Scalper Inside Pro to quickly evaluate their statistics and
Advanced Supply Demand
Bernhard Schweigert
4.92 (310)
CURRENTLY 26% OFF !! Best Solution for any Newbie or Expert Trader! This indicator is a unique, high quality and affordable trading tool because we have incorporated a number of proprietary features and a new formula. With this update, you will be able to show double timeframe zones. You will not only be able to show a higher TF but to show both, the chart TF, PLUS the higher TF: SHOWING NESTED ZONES. All Supply Demand traders will love it. :) Important Information Revealed Maximize the potenti
TPSpro RFI Levels
Roman Podpora
5 (13)
A key element in trading is zones or levels from which decisions to buy or sell a trading instrument are made. Despite attempts by major players to conceal their presence in the market, they inevitably leave traces. Our task was to learn how to identify these traces and interpret them correctly. Reversal First Impulse levels (RFI)   -  Version MT5                INSTRUCTIONS                 RUS                 ENG                                       R ecommended to use with an indicator   -  
TrendMaestro
Stefano Frisetti
5 (2)
note: this indicator is for METATRADER4, if you want the version for METATRADER5 this is the link: TRENDMAESTRO recognizes a new TREND in the bud, he never makes mistakes. The certainty of identifying a new TREND is priceless. DESCRIPTION TRENDMAESTRO identifies a new TREND in the bud, this indicator examines the volatility, volumes and momentum to identify the moment in which there is an explosion of one or more of these data and therefore the moment in which prices have strong probability of f
Şu anda %20 İNDİRİMLİ! Herhangi bir Acemi veya Uzman Tüccar için En İyi Çözüm! Bu gösterge paneli yazılımı 28 döviz çifti üzerinde çalışıyor. Ana göstergelerimizden 2'sine (Gelişmiş Para Birimi Gücü 28 ve Gelişmiş Para Birimi Dürtüsü) dayanmaktadır. Tüm Forex piyasasına harika bir genel bakış sağlar. Gelişmiş Para Birimi Gücü değerlerini, para birimi hareket hızını ve tüm (9) zaman dilimlerinde 28 Forex çifti için sinyalleri gösterir. Trendleri ve / veya scalping fırsatlarını belirlemek içi
Mucizevi Forex Göstergesi Tanıtımı: Keskin Ticaretin Gücünü Serbest Bırakın Tüm zaman dilimlerinde gerçekten olağanüstü sonuçlar sunan en iyi Forex göstergesini aramaktan sıkıldınız mı? Artık aramayın! Mucizevi Forex Göstergesi, ticaret deneyiminizi devrimleştirip kazançlarınızı yeni zirvelere taşımak için burada. Gelişmiş teknoloji ve yılların özenli geliştirmesi temelinde Mucizevi Forex Göstergesi, döviz piyasasında güç ve keskinlik açısından doruğa çıkar. Bu olağanüstü araç, tüm seviyelerdeki
Entry Points Pro
Yury Orlov
4.7 (224)
Yeniden boyamadan bir ticarete girmek için doğru sinyaller sağlayan MT5 için en iyi gösterge! Herhangi bir finansal varlığa uygulanabilir: forex, kripto para birimleri, metaller, hisse senetleri, endeksler. MT5 versiyonu burada Oldukça doğru alım satım sinyalleri sağlayacak ve bir alım satımı açıp kapatmanın en iyi zamanını size söyleyecektir. Göstergeyi ödeyen yalnızca bir sinyali işleme örneğiyle videoyu (6:22) izleyin! Çoğu tüccar, Giriş Noktaları Pro göstergesinin yardımıyla ilk işl
Quantum Breakout Indicator PRO
Bogdan Ion Puscasu
4.96 (26)
Tanıtım       Quantum Breakout PRO   , Breakout Bölgeleri ile ticaret yapma şeklinizi değiştiren çığır açan MQL5 Göstergesi! 13 yılı aşkın ticaret deneyimine sahip deneyimli tüccarlardan oluşan bir ekip tarafından geliştirilen   Quantum Breakout PRO   , yenilikçi ve dinamik koparma bölgesi stratejisiyle ticaret yolculuğunuzu yeni zirvelere taşımak için tasarlanmıştır. Kuantum Breakout Göstergesi, size 5 kar hedefi bölgesi ile kırılma bölgelerinde sinyal okları ve kırılma kutusuna dayalı ol
PRO Renko Sistemi, RENKO grafikleri ticareti için özel olarak tasarlanmış son derece hassas bir ticaret sistemidir. Bu, çeşitli ticaret araçlarına uygulanabilen evrensel bir sistemdir. Sistemi etkin piyasa sana doğru ters sinyallerine erişim hakkı denilen ses nötralize eder. Göstergenin kullanımı çok kolaydır ve sinyal üretiminden sorumlu tek bir parametreye sahiptir. Aracı, seçtiğiniz herhangi bir ticaret aracına ve renko çubuğunun boyutuna kolayca uyarlayabilirsiniz. Yazılımımla karlı b
FX Power MT4 NG
Daniel Stein
5 (8)
Sabah Brifingimiz burada mql5 ve on Telegram! FX Power MT4 NG , uzun zamandır çok popüler olan döviz gücü ölçerimiz FX Power'ın yeni neslidir. Peki bu yeni nesil güç ölçer ne sunuyor? Orijinal FX Power hakkında sevdiğiniz her şey PLUS GOLD/XAU güç analizi Daha da hassas hesaplama sonuçları Ayrı ayrı yapılandırılabilir analiz dönemleri Daha da iyi performans için özelleştirilebilir hesaplama limiti Özel çokluDaha fazlasını görmek isteyenler için örnek ayarlar Her grafikte en sevdiğiniz renkler i
ŞU ANDA %31 INDIRIMLI !!! Yeni Başlayanlar veya Uzman Tüccarlar için En İyi Çözüm! Bu gösterge benzersiz, yüksek kaliteli ve uygun fiyatlı bir ticaret aracıdır çünkü bir dizi tescilli özellik ve gizli bir formül ekledik. Yalnızca BİR grafikle 28 döviz çiftinin tümü için Uyarılar verir. Yeni bir trendin veya scalping fırsatının tam tetik noktasını belirleyebildiğiniz için ticaretinizin nasıl gelişeceğini hayal edin! Yeni temel algoritmalar üzerine inşa edilen bu sistem, potansiyel işlemler
Shepherd Harmonic Pattern
Abdullah Alrai
4.68 (59)
Bu gösterge, manuel ve otomatik yöntemlerle çizilen harmonik desenleri algılar. Kullanım kılavuzuna şu bağlantıdan erişebilirsiniz: İncelemenizi ekleyin ve ürünü almak için bizimle iletişime geçin. Bu ürünü mt4'te denemek için ücretsiz bir sürümü vardır. Gartley ve Nenstar desenlerini algılamak için kullanabilirsiniz: https://www.mql5.com/en/market/product/30181 Tam MT4 sürümünü şuradan satın alabilirsiniz: https://www.mql5.com/en/market/product/15212 Notlar Gösterge kontrol paneline sahiptir ve
FX Volume
Daniel Stein
4.6 (35)
Sabah Brifingimiz aracılığıyla ayrıntılar ve ekran görüntüleri ile günlük piyasa güncellemenizi alın burada mql5 ve on Telegram ! FX Volume, bir brokerin bakış açısından piyasa duyarlılığı hakkında GERÇEK bir fikir veren İLK ve TEK hacim göstergesidir. COT raporlarından çok daha hızlı bir şekilde, brokerlar gibi kurumsal piyasa katılımcılarının Forex piyasasında nasıl konumlandıklarına dair harika bilgiler sağlar. Bu bilgileri doğrudan grafiğinizde görmek, ticaretiniz için gerçek oyun değiştir
Öncelikle, bu Trading Sisteminin Non-Repainting, Non-Redrawing ve Non-Lagging Gösterge olduğunu vurgulamak önemlidir, bu da profesyonel ticaret için ideal hale getirir. "Smart Support and Resistance Trading System", yeni ve deneyimli tüccarlar için özel olarak tasarlanmış gelişmiş bir göstergedir. Forex piyasasında tüccarları hassasiyet ve güvenle donatır. Bu kapsamlı sistem, 7'den fazla strateji, 10 gösterge ve günlük ticaret stratejisi, swing ticaret stratejisi, destek ve direnç stratejisi,
How to use Pair Trading Station Pair Trading Station is recommended for H1 time frame and you can use it for any currency pairs. To generate buy and sell signal, follow few steps below to apply Pair Trading Station to your MetaTrader terminal. When you load Pair Trading Station on your chart, Pair Trading station will assess available historical data in your MetaTrader platforms for each currency pair. On your chart, the amount of historical data available will be displayed for each currency pai
Cycle Sniper
Elmira Memish
4.4 (35)
NEW YEAR SALE PRICE FOR LIMITED TIME!!! Please contact us after your purchase and we will send you the complimentary indicators to complete the system Cycle Sniper is not a holy grail but when you use it in a system which is explained in the videos, you will feel the difference. If you are not willing to focus on the charts designed with Cycle Sniper and other free tools we provide, we recommend not buying this indicator. We recommend watching the videos about the indiactor and system before pu
Precision Index Osilatörü (Pi-Osc) - Precision Trading Systems'dan Roger Medcalf Sürüm 2, grafiklerinizde hızlı bir şekilde yüklenmek üzere dikkatle yeniden kodlandı ve deneyimi artırmak için bazı teknik geliştirmeler de içerdi. Pi-Osc, herkesin stoplarını almak için zorlanan pazarların gitmek zorunda kaldığı aşırı yorgunluk noktalarını bulmak için tasarlanmış doğru ticaret zamanlama sinyalleri sunmak amacıyla oluşturuldu. Bu ürün, aşırı noktaların nerede olduğunu bilmek gibi yaşlı bir so
TakePropips Donchian Trend Pro
Eric John Pajarillaga Aldana
4.82 (17)
TakePropips Donchian Trend Pro   (MT4), Donchian Kanalı'nı kullanarak trendin yönünü otomatik olarak tespit eden ve size ticarete giriş ve çıkış sinyalleri sağlayan güçlü ve etkili bir araçtır! Bu çok işlevli gösterge, bir trend tarayıcı, ticaret sinyalleri, istatistiksel panel, tarayıcı, ticaret oturumları ve uyarı geçmişi panosu içerir. Size ticaret sinyalleri sağlamak ve çizelgeleri analiz ederek saatlerce tasarruf etmenizi sağlamak için tasarlanmıştır! Kullanım kılavuzunu ve kurulum kılavuzu
IX Power MT4
Daniel Stein
5 (5)
IX Power nihayet FX Power'ın rakipsiz hassasiyetini Forex dışı sembollere getiriyor. En sevdiğiniz endeksler, hisse senetleri, emtialar, ETF'ler ve hatta kripto para birimlerindeki kısa, orta ve uzun vadeli eğilimlerin yoğunluğunu doğru bir şekilde belirler. Terminalinizin sunduğu her şeyi analiz edebilirsiniz. Deneyin ve işlem yaparken zamanlamanızın nasıl önemli ölçüde iyileştiğini deneyimleyin. IX Power Temel Özellikler 100 hassas, yeniden boyanmayan hesaplama sonuçları - terminalini
Precision Divergence Finder, Precision Trading Systems tarafından piyasa diplerini kesinlikle ve sıkça bulmak amacıyla tasarlandı. Teknik analizde, dipleri seçme sanatı genellikle zirveleri seçmekten çok daha kolaydır ve bu ürün tam olarak bu görev için tasarlandı. Boğa ayrıştırması tanımlandıktan sonra alım yapmadan önce trendin yukarı dönmesini beklemek mantıklıdır. Bir giriş yapmak için 10 veya 20 çubuk yüksekliği kullanabilir veya trend değişikliğini belirlemek için yükselen bir 15-30 har
Roger Medcalf tarafından geliştirilen PTS Divergence Finder Satış Göstergesi - Precision Trading Systems. Bu gösterge yalnızca Ayı - Satış İşaretleri vermektedir. Öncelikle, neden birçok yıl boyunca alım sinyali farklılaşma bulucu sağlarken satış farklılaşma göstergesi sağlamadığımı birçok kez sordular. Cevabım, satış farklılaşmalarının alım farklılaşmalarından daha güvenilir olmadığı yönündeydi, ki bu hala doğrudur. Bunu değiştirmek için bazı çözümler bulundu, ancak bunlar daha katı varsayılan
Up down v6T
Guner Koca
5 (1)
Thise indicator is up down v6  comes with tradingwiev version. purchased people, after installed on terminal ,contact me on mql5  to get BONUS  TradingView version. up-down indicator is no repaint and works all pairs and lower than weekly time frames charts. it is suitable also 1 m charts for all pairs. and hold long way to signal. dont gives too many signals. when red histogram cross trigger line that is up signal.and price probably will down when blue histogram cross trigger line that is dow
Price Action Entry Alerts
Stephen Sanjeeve Sahayam
5 (3)
Bu gösterge, alış veya satış baskısı için her çubuğu tarar ve en yüksek hacme sahip 4 tip mum modelini tanımlar. Bu mumlar daha sonra Alış veya Satış sinyallerini göstermek için birkaç doğrusal filtre kullanılarak filtrelenir. Sinyaller, daha yüksek zaman çerçevesi yönüyle bağlantılı olarak ve yüksek hacimli saatlerde alım satım yapıldığında en iyi sonucu verir. Tüm filtreler özelleştirilebilir ve bağımsız çalışır. Bir düğmeyi tıklayarak tek bir yönün sinyallerini görüntüleyebilir. Bu gösterge
XQ Indicator MetaTrader 4
Marzena Maria Szmit
3 (2)
Step into the realm of Forex trading with confidence and precision using XQ, a cutting-edge Forex indicator designed to elevate your trading game to unprecedented heights. Whether you're a seasoned trader or just stepping into the world of currency exchange,   XQ Forex Indicator   empowers you with the insights and signals needed to make informed trading decisions. The signal conditions are a combination of three indicators, and XQ Forex Indicator only display  medium and long-term trends . The
Quantum Heiken Ashi PRO MT4
Bogdan Ion Puscasu
4.43 (7)
Tanıtımı       Quantum Heiken Ashi PRO   çizelgeleri Pazar eğilimleri hakkında net bilgiler sağlamak için tasarlanan Heiken Ashi mumları, gürültüyü filtreleme ve yanlış sinyalleri ortadan kaldırma yetenekleriyle ünlüdür. Kafa karıştırıcı fiyat dalgalanmalarına veda edin ve daha sorunsuz, daha güvenilir bir grafik sunumuna merhaba deyin. Quantum Heiken Ashi PRO'yu gerçekten benzersiz kılan şey, geleneksel şamdan verilerini okunması kolay renkli çubuklara dönüştüren yenilikçi formülüdür. Kırmızı v
Currency Strength Exotics
Bernhard Schweigert
4.88 (33)
ŞU ANDA %20 INDIRIMLI! Herhangi bir Acemi veya Uzman Tüccar için En İyi Çözüm! Bu Gösterge, Egzotik Çiftler Emtialar, Endeksler veya Vadeli İşlemler gibi herhangi bir sembol için para birimi gücünü göstermek için uzmanlaşmıştır. Türünün ilk örneğidir, Altın, Gümüş, Petrol, DAX, US30, MXN, TRY, CNH vb. gerçek para birimi gücünü göstermek için 9. satıra herhangi bir sembol eklenebilir. Bu benzersiz, yüksek kaliteli ve uygun fiyatlı bir ticaret aracıdır çünkü bir dizi tescilli özelliği ve yeni
Yazarın diğer ürünleri
Profit MACD
Aleksey Ivanov
5 (2)
I present an indicator for professionals. ProfitMACD is very similar to classic MACD in appearance and its functions . However, ProfitMACD is based on completely new algorithms (for example, it has only one averaging period) and is more robust, especially on small timeframes, since it filters random price walks. The classic MACD indicator (Moving Average Convergence / Divergence) is a very good indicator following the trend, based on the ratio between two moving averages, namely the EM
Identify Trend
Aleksey Ivanov
4.25 (32)
The Identify Trend indicator, using fairly simple but robust filtering methods (based on the moving median – algorithm XM )  and more complex algorithms (XC, XF, XS, four types of non-lagging moving averages   SMAWL, EMAWL,  SSMAWL, LWMAWL ) developed by the author , allows determined (1) the beginning of a true trend movement very precisely and, most importantly, with a small delay, and (2) identifying the flat. Such an indicator can be used for trading scalper strategies as well
FREE
TrueChannel
Aleksey Ivanov
5 (7)
The TrueChannel   indicator shows us the true price movement channels. This indicator resembles Donchian Channel   in its appearance, but is built on the basis of completely different principles and gives (in comparison with Donchian Channel , which is better just to use to assess volatility) more adequate trading signals.              As shown in the article , the price actually moves in channels parallel to the time axis and jumps abruptly from the previous channels to the subsequ
FREE
Scientific trade
Aleksey Ivanov
5 (1)
An extremely convenient indicator that truly makes the process of making money on the exchange easy. It is based on the scientifically rigorous theory of the market developed by the author, the beginning of which is presented here .                The full algorithm of this indicator operation is presented in the article .               The indicator calculates the most probable price movement trajectory and displays it on the chart. Based on the predicted price movement trajectory
Absolute Bands
Aleksey Ivanov
4.5 (4)
Principles of construction of the indicator.               The Absolute Bands (AB) indicator is reminiscent of the Bollinger Bands indicator with its appearance and functions, but only more effective for trading due to the significantly smaller number of false signals issued to them. This effectiveness of the Absolute Bands indicator is due to its robust nature.               In the Bollinger Bands indicator, on both sides of the moving average - Ma, there are lines spaced from Ma by the standa
FREE
Quality trend
Aleksey Ivanov
5 (1)
The Quality trend indicator expresses the ratio of the strength of a trend or the speed of its growth (fall) to the degree of its noisiness or a certain norm of amplitudes of chaotic fluctuations of a growing (falling) price. The position of the indicator line above zero shows an increasing trend, below zero - a falling trend, the fluctuation of the indicator line near zero shows a flat. If the indicator line begins to fluctuate rapidly around zero and approach it, then this indica
Casual Channel
Aleksey Ivanov
5 (1)
Grafiklerde gördüğünüz trendler her zaman kazanılabilecek trendler değildir. İki tür eğilim vardır:  1)   istikrarlı olan ve bu nedenle tüccar için güvenilir bir kâr sağlayabilen temel ekonomik nedenlerin neden olduğu gerçek eğilimler;  2)    sadece bir trend gibi görünen ve rastgele olaylar zinciri nedeniyle ortaya çıkan yanlış trend bölümleri - fiyatı (esas olarak) tek yönde hareket ettirmek. Bu yanlış trend bölümleri kısadır ve her an yönünü tersine çevirebilir.;  bu nedenle, ya
Alligator Analysis
Aleksey Ivanov
4.75 (4)
Indicator description.            The “ Alligator Analysis ” ( AA ) indicator allows you to build various (by averaging types and by scales) “ Alligators ” and their combinations, i.e. allows you to analyze the state of the market based on the correlation of this state with a whole range of different " Alligators ".  The classic " Alligator " by Bill Williams is based on moving averages and Fibonacci numbers, which makes it one of the best indicators now. The classic " Alligator "   is based on
FREE
The Signal Envelopes   indicator uses the robust filtering method based on: (1) the moving median Buff0 = <Median> = (Max {x} + Min {x}) / 2 and (2) the averaging algorithm developed by the author Buff1 = <(<Median> ) ^ (- 3)> * (<Median>) ^ 4  based on the moving median. The Signal Envelopes   indicator allows you to most accurately and with the minimum possible delay set the beginning of a new trend.  The Signal Envelopes indicator can be used both for trading according to scalpe
Iterative Moving Average – IMA.   IMA is obtained by correcting the usual   MA.   The correction consists in addition   to MA averaged difference between the time series (X) and its MA, i.e.   IMA(X)=MA(X) + MA ( Х -MA(X)). Correction is done in several iterations (and, exactly, 2 iterations in this indicator) and with a change in the averaging period.               As a result, the time-series points begin to cluster around (on all sides) of the getting   IMA and with a smaller de
Firstly , the script estimates how many Mx bars of the chart (on which this script is applied) the future trend will most likely continue and what is its quality. Secondly (and most importantly), the script is an auxiliary tool for the extremely mathematically advanced and extremely effective ScientificTrade indicator in trading. The script calculates the optimal averaging period, which is also equal to Mx, of the ScientificTrade indicator, which gives the maximum profit according to the strate
The Identify Market State   indicator allows you to set the beginning of a new trends and pullbacks on an existing trend. This indicator can be used both for trading on scalper strategies and for long-term trading strategies.               The indicator is based on the 14 periodic DeMarker   indicator and the 8 periodic simple moving average from this indicator. Statistical studies have shown that the sharp peaks of the DeMarker   indicator curve when they drop below its minimum li
The principle of constructing indicator lines .               Profit Trade  indicator is very effective for trading. Profit Trade  is a deep development of the well-known Donchian channel  indicator. The upper (BlueViolet color) Dup and the lower (IndianRed) Ddn lines of the indicator are constructed in the same way as in the Donchian channel , based on the highest (high of High) and lowest (low of Low) prices for the previous n1 = 20 periods. The middle line (Gold) Dm is constructed in the sam
The indicator visualizes the result of the   CalculateScientificTradePeriod    script (which, of course, also needs to be downloaded), which, firstly , estimates how many Mx bars of the active chart the future trend will most likely continue and what is its quality, and, secondly , calculates the optimal the averaging period (which is also equal to Mx) of the ScientificTrade   indicator, which gives the maximum profit according to the extremely effective   ScientificTrade strategy. For the FindS
Asummetry
Aleksey Ivanov
The principle of the indicator.                             The Asummetry  indicator allows you to predict the beginning of a change in the direction of trends, long before their visual appearance on the price chart.               The author statistically revealed that before changing the direction of the trend, the probability distribution function of the price is made as asymmetric as possible. More precisely, the price movement in any direction always pulls sideways the function of its dis
Channel Builder
Aleksey Ivanov
4.67 (6)
The Channel Builder (CB) or Ivanov Bands indicator is a broad generalization of the Bollinger Bands indicator. First, in CB, the mean line <X> is calculated using various averaging algorithms. Secondly, the mean deviations calculated by Kolmogorov averaging are plotted on both sides of the middle line <X>.                The middle line <X>, besides the standard SMA, EMA, SMMA and LWMA averaging algorithms, can be Median = (Max + Min) / 2 sliding median (which is the default). In
FREE
PDP indicator is used for: defining price probability distributions. This allows for a detailed representation of the channel and its borders and forecast the probability of a price appearing at each segment of its fluctuations; defining the channel change moment. Operation principles and features PDP analyzes a quote history on lower timeframes and calculates a price probability distribution on higher ones. Forecast algorithms allow the indicator to calculate probability distributions and m
Signal Bands is a sensitive and convenient indicator, which performs deep statistical processing of information. It allows to see on one chart (1) the price trend, (2) the clear price channel and (3) latent signs of trend change. The indicator can be used on charts of any periods, but it is especially useful for scalping due to its high sensitivity to the current market state. The functions of the indicator : First, the Signal Bands indicator draws channels into which all price fluctuations ex
Structure of the indicator.               The Cunning crocodile indicator consists of three moving averages (applied to the price   Median price   = (high + low)/2 ) :   1) the usual MA ( SMA , EMA , SMMA ,   LWMA )  or the mean <X> of the process X and her two generalizations 2) <XF> = <X / <X >> * <X> and 3) <XS> = <X * <X >> / <X> with the same averaging period. All three curves intersect at common points that (such an intersection in which the cunning crocodile, unlike the usual one, "never
Sensitive Signal
Aleksey Ivanov
5 (2)
The Sensitive Signal ( SS ) indicator, using the filtering methods  (which includes cluster multicurrency analysis) developed by the author, allows, with a high degree of probability, to establish the beginning of the true (filtered from interference - random price walks) trend movement. It is clear that such an indicator is very effective for trading on the currency exchange , where signals are highly distorted by random noise. The filtration developed by the author is carried out
The principle of the indicator.               A simple moving average (SMA) with an averaging period (2n + 1) of bars is always obtained lagging by n bars. If SMA or other types of moving averages are the basis for making trading decisions, then their strong delay does not allow   to open positions in time and close positions, which leads to losses.                            The Estimation moving average without lag ( EMAWL ) indicator calculates the non-lagging moving average, which is calcula
The principle of the indicator.               The Strong Trend Flat Signal (STFS) indicator is the intersection of two, developed by the author, non-lagging moving averages with averaging periods 21 and 63.               A simple moving average (SMA) with an averaging period (2n + 1) of bars is always obtained lagging by n bars. If SMA or other types of moving averages are the basis for making trading decisions, then their strong delay does not allow  to open positions in time and close positi
StatChannel
Aleksey Ivanov
5 (1)
The principle of the indicator.               The StatChannel ( SC ) indicator is a development of the Bollinger Bands indicator ( ВВ ).  BB is a moving average, on both sides of which two lines are drawn, separated from it by standard deviations std multiplied by the corresponding coefficient. At the same time, a moving average with an averaging period (2n + 1) bars is always obtained lagging behind n bars.  Sliding std is also lagging behind on n bars, also calculated by (2n + 1) points. Such
Introduction.             The indicator predicts the price in accordance with the prevailing trend  and its own small statistical price fluctuations around this trend. At the same time, in StatPredict , you need to set the time horizon of the forecasted events, which is set by the parameter settings of the “ Length of forecast in bars ” indicator and determined by the characteristic time scale of the current   trend, which is best measured by the ProfitMACD indicator or by the previous price co
The principle of constructing indicator lines and their meaning .               The Signal Channel   indicator uses a robust filtering method based on two moving medians applicable to the High and Low prices, i.e. the lines <High> and <Low>, where <..> is the sign of linear averaging, which are shifted by certain values ​​in an uptrend and by opposite values ​​in a downtrend, which allows you to get a narrow channel, approximately outlining each bar. Sharp kinks of the lines of such a channel a
Robust Filter
Aleksey Ivanov
5 (1)
The Robust filter   indicator is based on the robust filtering algorithm developed by the author using the multi-period averaged moving median. The algorithm for this averaging is shown in the last screenshot.                The indicator calculates and shows: 1. The direction of the trend; 2. Entry and exit points of positions; 3. StopLoss   lines calculated from current price probability distributions and selected probability of closing an order by StopLoss before the trend revers
This   indicator is intended for professionals assessing fundamental market trends.  This indicator calculates the index of any instrument and analyzes it.              The index of the state currency shows the real purchasing power of this currency, and the dynamics of this index shows the dynamics of the economic state of the corresponding state. An analysis of the indices of both currencies included in a currency pair makes it much more reliable to identify the trend of this cur
The Multicurrency Trend Detector ( MTD ) indicator allows you to immediately and on one chart on a selected time interval (extending from a zero bar to a bar set in the settings by the value horizon) determine the presence, direction and strength of trends in all major currencies, as well as assess the reliability of these trends.               This is achieved by calculating indices (non-relative purchasing power) of eight major currencies, namely: AUD, CAD, CHF, EUR, GBP, JPY, NZ
StatZigZag
Aleksey Ivanov
The StatZigZag  indicator looks like a regular ZigZag , but is built on the basis of completely different algorithms. The StatZigZag  indicator is a broken line built from segments of regression lines of different lengths, the beginning of each of which comes from the end of the previous segment. Each regression segment is built until the variance or spread of price around it begins to exceed a certain critical value, after which the construction of this segment ends and the constr
The Velocity of price change   ( VP ) indicator shows the average rate of price change at those characteristic time intervals where this rate was approximately constant. The robust algorithm used in VP   to smooth out the price from its random jumps, ensures the reliability of the indicator reading, which does not react to simple price volatility and its insignificant movements.             The indicator allows you to track trends and the moments of their reversals , during which t
Filtrele:
İnceleme yok
İncelemeye yanıt
Sürüm 1.10 2020.08.23
Small bug fixed.