• Genel bakış
  • İncelemeler (1)
  • Yorumlar (5)

DFP Reconnoiter Ultimate

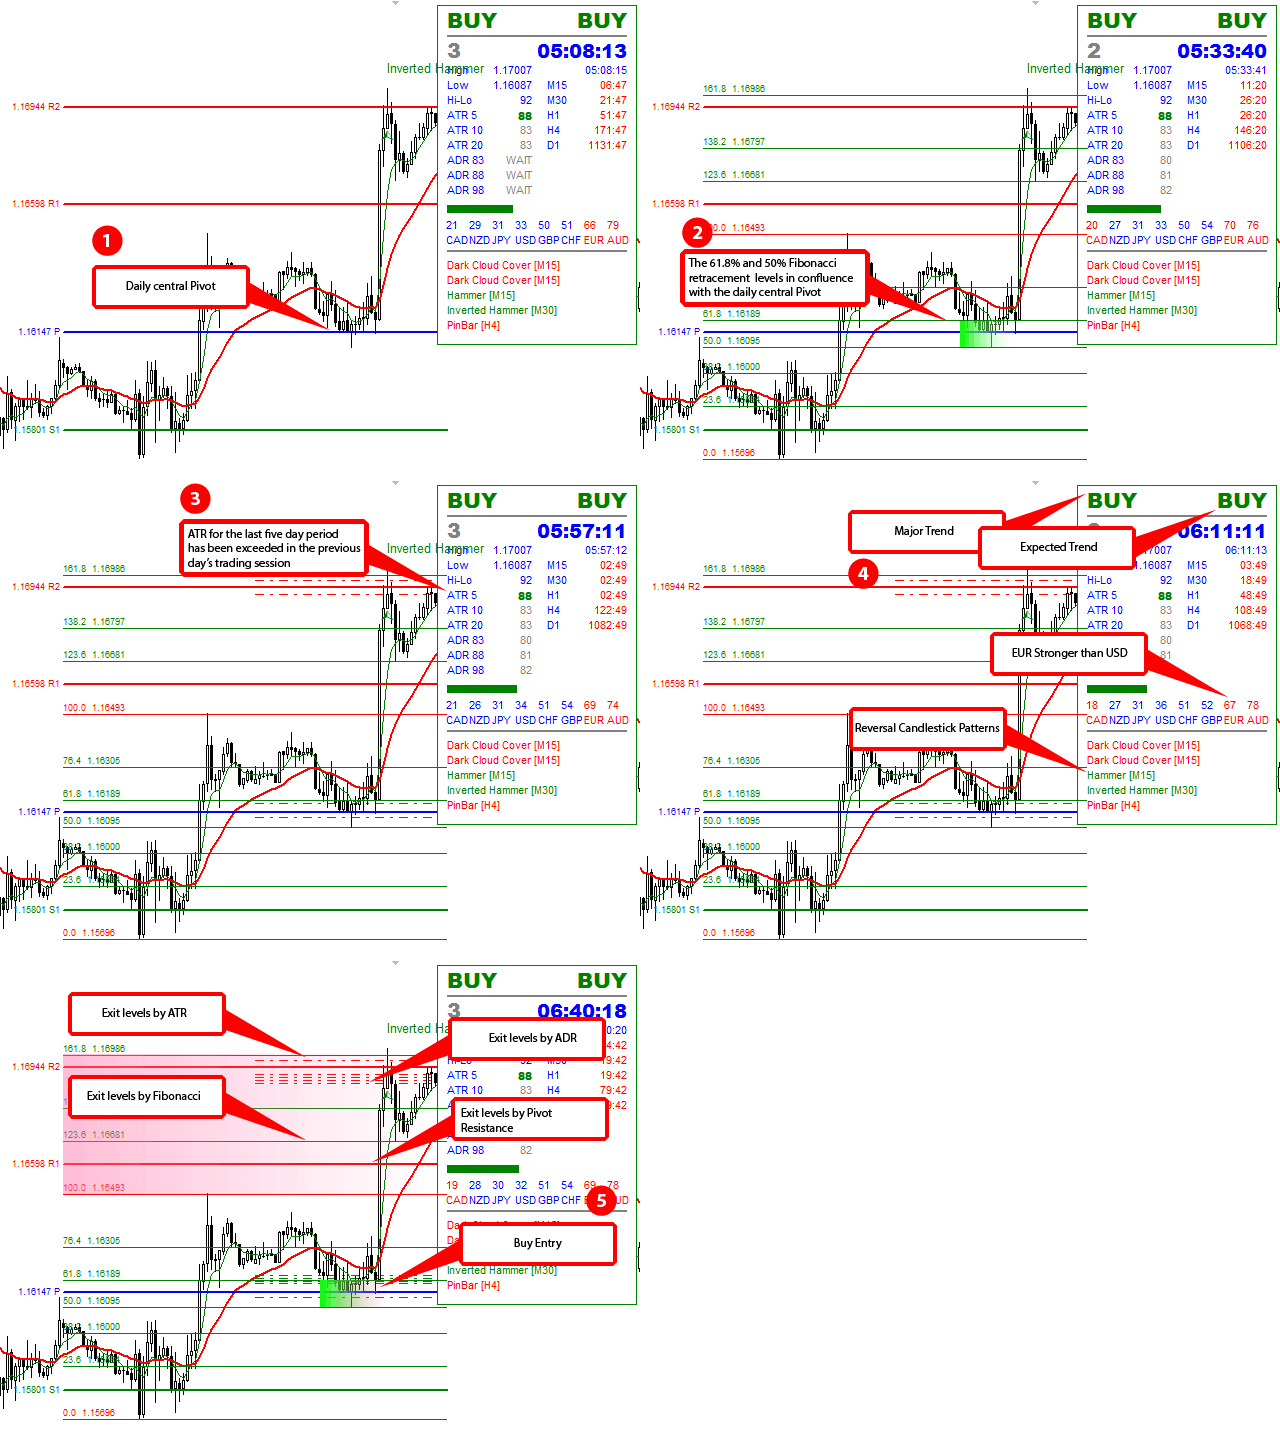
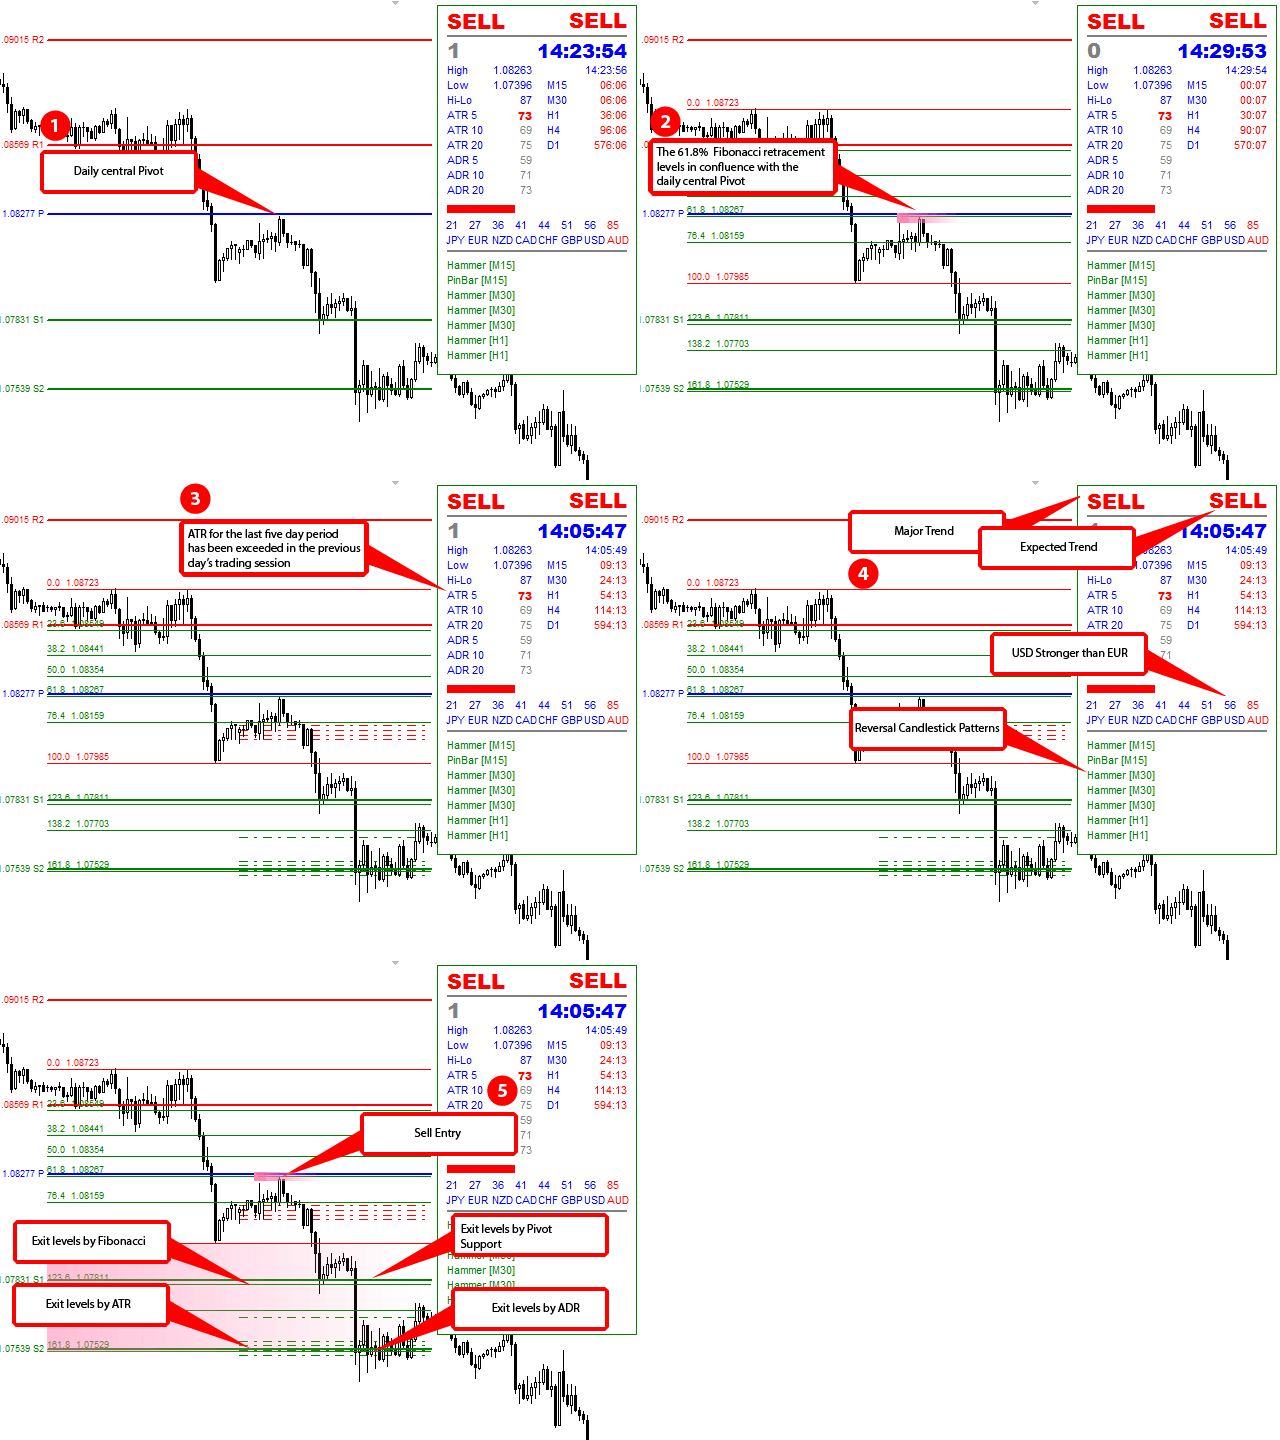
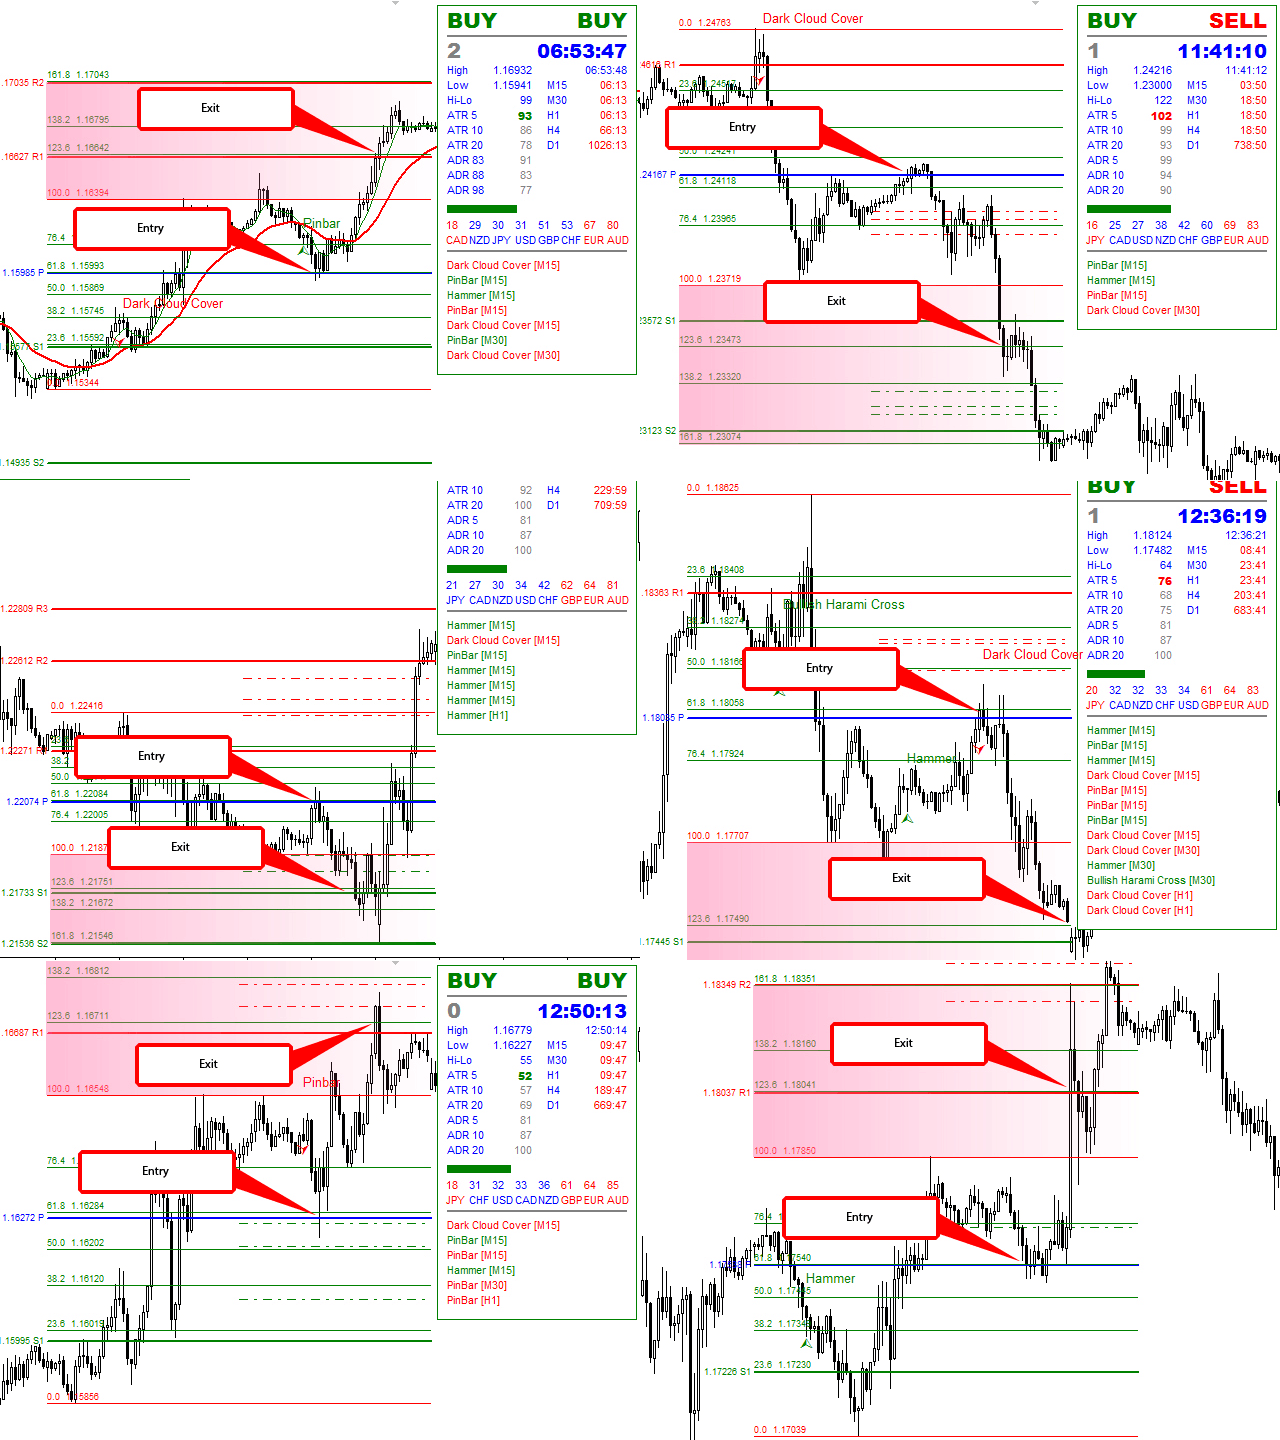
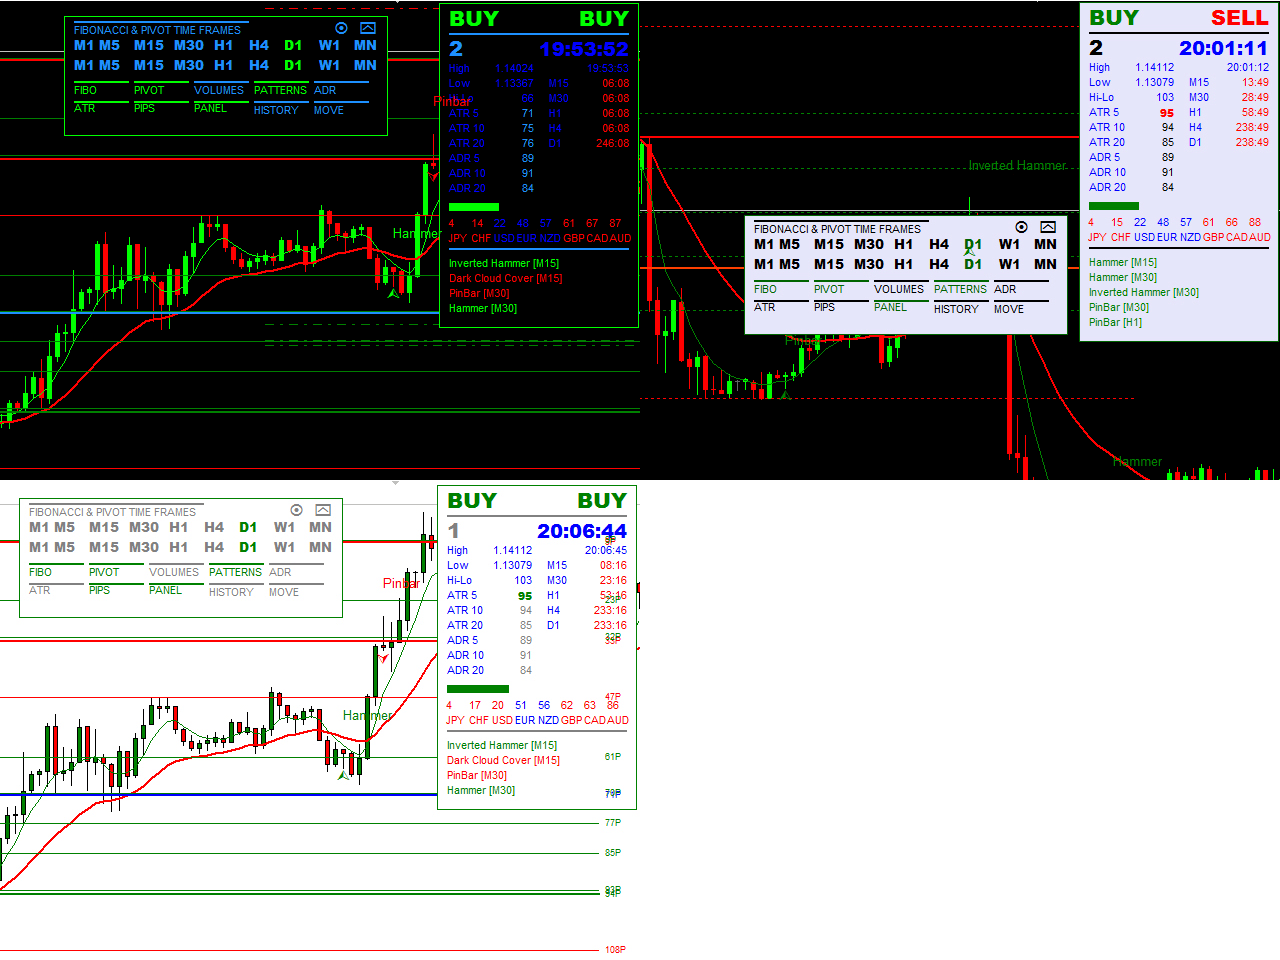
Günlük Fibonacci Pivot Stratejisi yatırımcıları için özel olarak tasarlanmış teknik bir gösterge olan DFP Reconnoiter Ultimate ile tanışın. Bu gösterge, iyi zamanlanmış girişlerle sonuçlanan geri dönüş ve çıkış alanlarını belirlemek için standart Fibonacci düzeltmelerini, günlük Pivot seviyelerini, Şamdan modellerini, ATR ve ADR seviyelerini içerir. Günlük merkezi pivot ile bağlantılı olarak %38,2, %50,0 veya %61,8'lik temel Fibonacci düzeltme seviyeleri tercih edilir.

Strateji, bir önceki işlem seansındaki beş günlük süreyi aşan Ortalama Gerçek Aralığın (ATR) izlenmesini içerir. Fibonacci seviyeleri, fiyat şu anda o günün merkezi pivotunun üzerindeyse bir önceki günün en düşük seviyesinden en yükseğine veya fiyat o günün merkezi pivotunun altındaysa önceki günün en yüksek seviyesinden en düşüğüne çekilir. Odak noktası, Fibonacci düzeltme seviyelerinin günlük merkezi pivot ile birleştiği noktayı belirlemektir. Tanımlanan kesişme noktasında bir geri dönüş gerçekleştiğinde, tüccarlar bir ticarete girmeden önce piyasaya girmeyi veya doğrulayıcı mum sinyallerini veya para birimi gücü değişikliklerini beklemeyi seçebilirler.

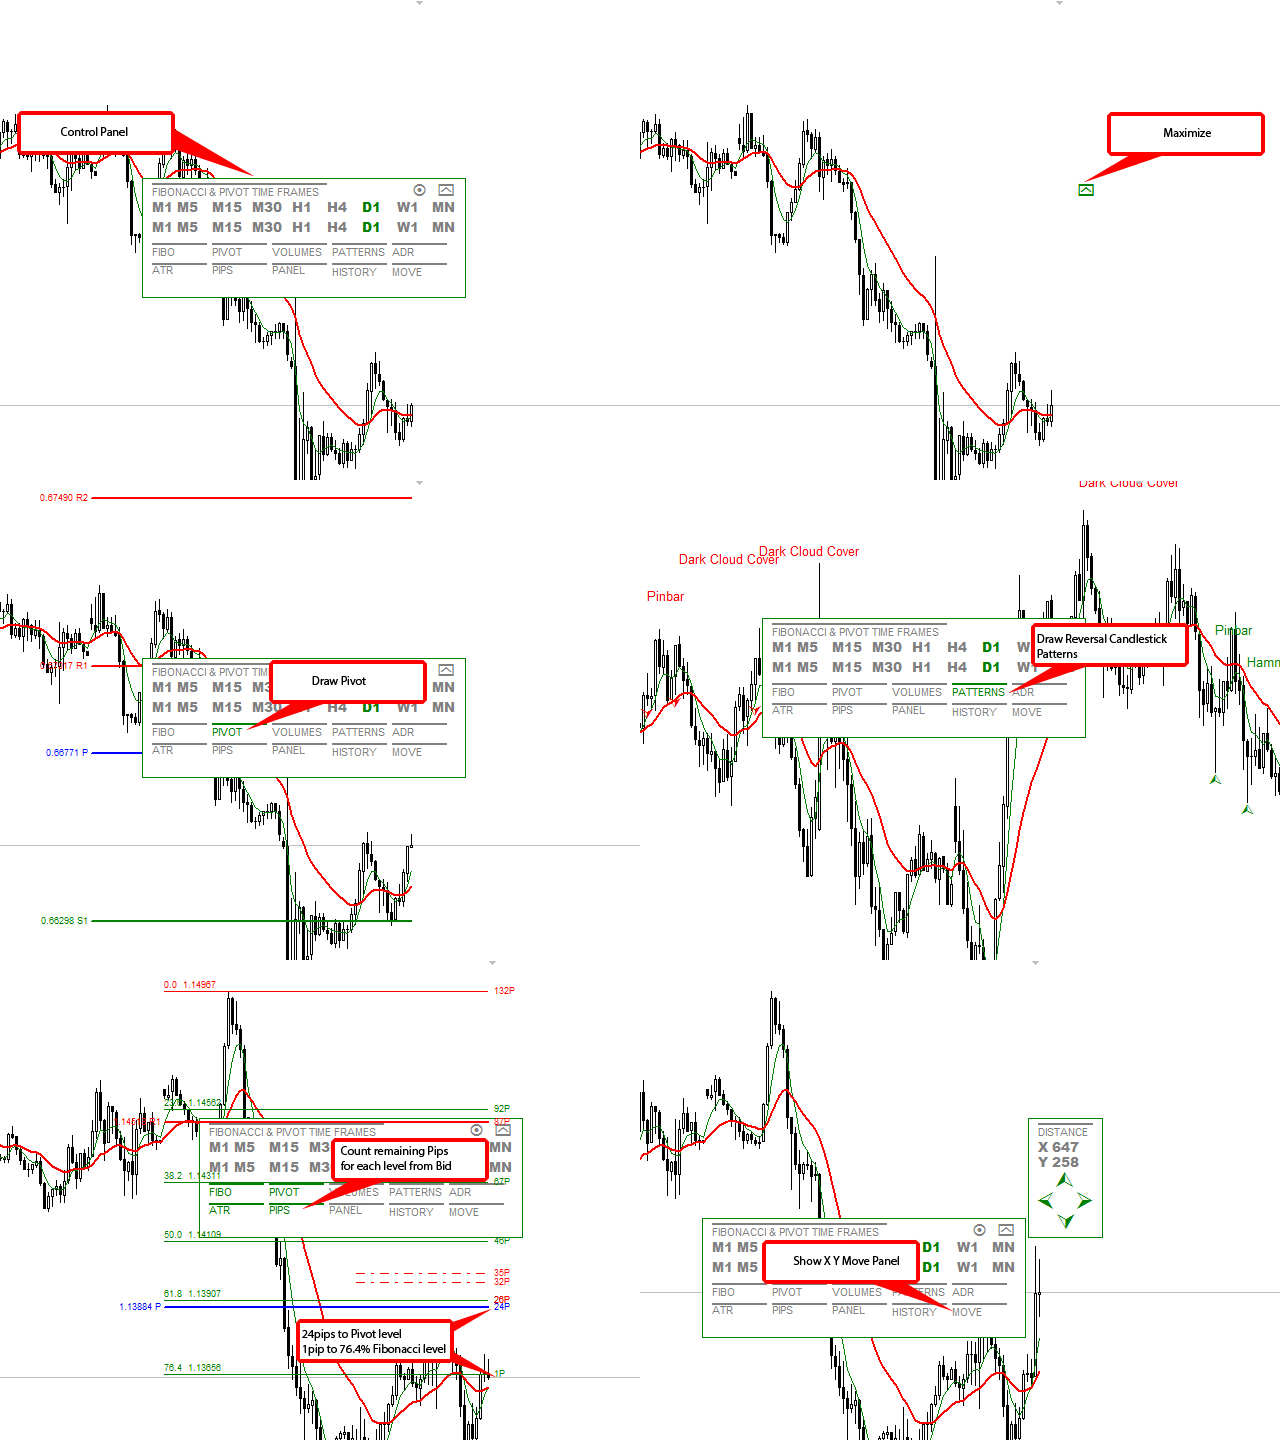
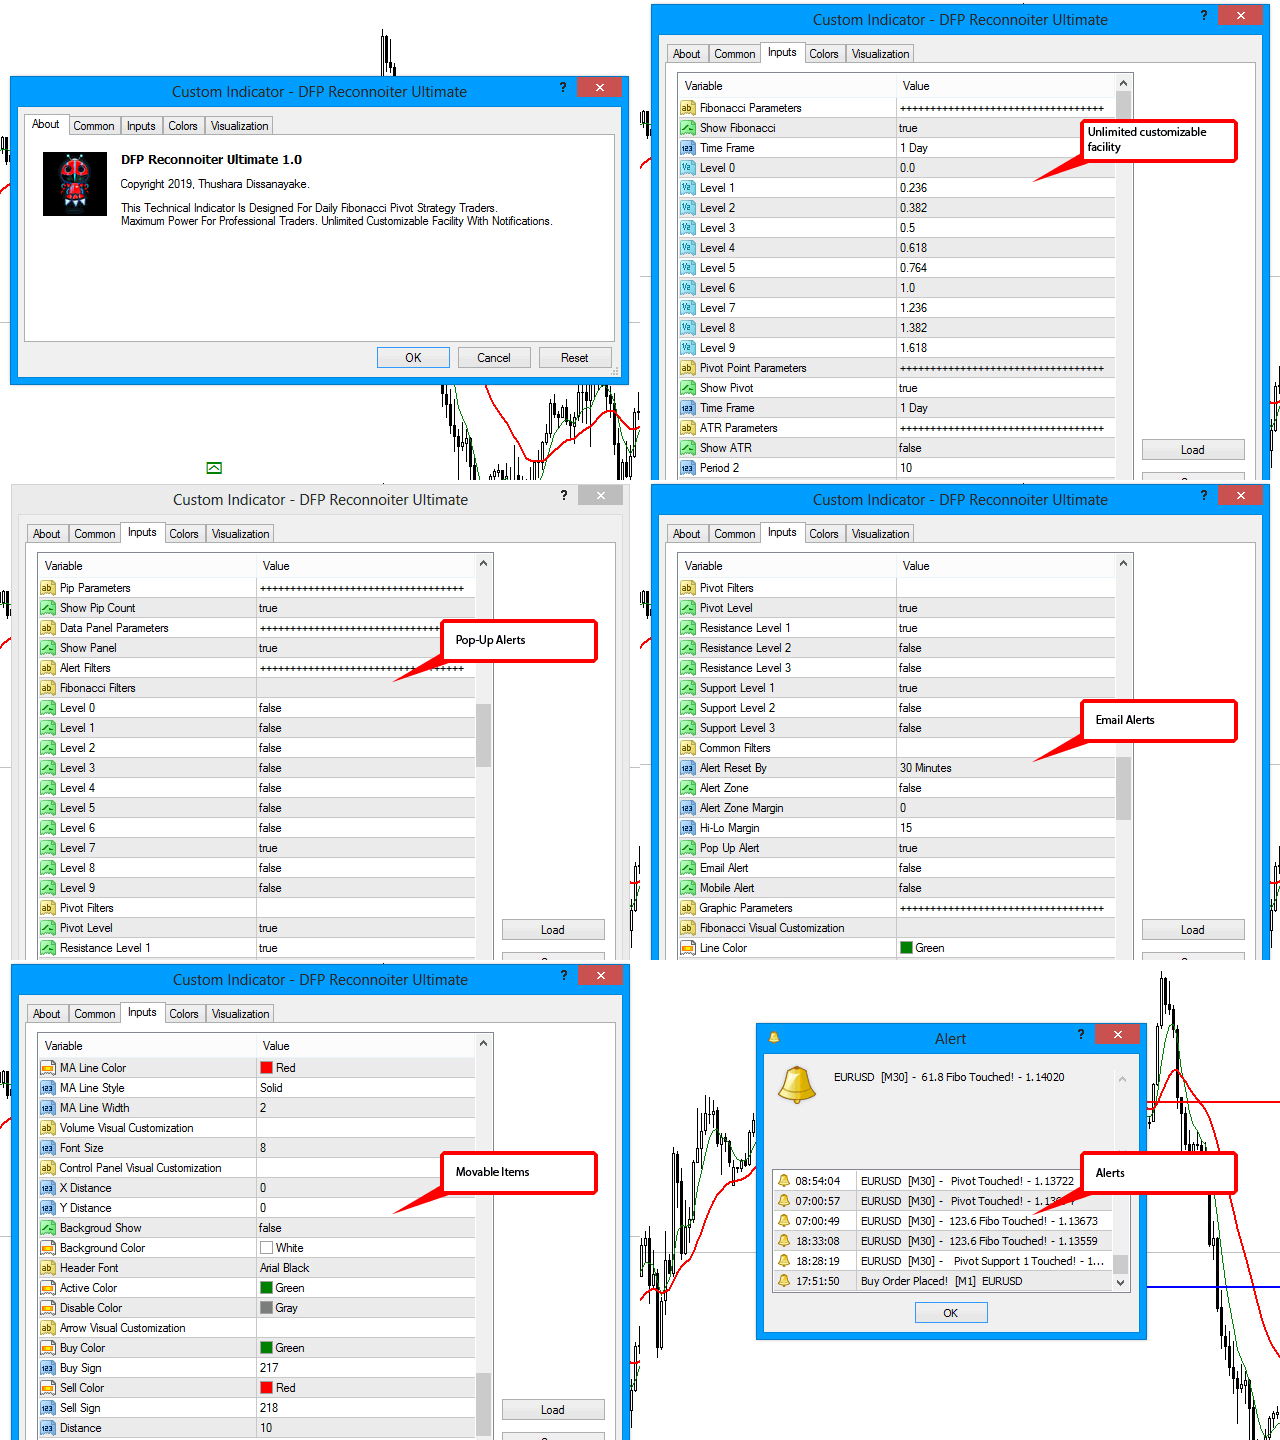
DFP Reconnoiter Ultimate, Pivot, Fibonacci, ADR, ATR ve Hareketli Ortalama (MA) dahil olmak üzere kapsamlı bir dizi göstergeye sahiptir. Sinyal doğruluğunu artırmak için Ters Şamdan Modeli Tarayıcı, Döviz Ölçer ve Mum Gücü Çıkarıcı içerir. Tüm göstergeler tamamen özelleştirilebilir ve tacirlerin bunları kendi stratejilerine göre uyarlamasına olanak tanır. Gösterge verileri, kolay başvuru için ek bir Veri panelinde uygun şekilde görüntülenir.

Bu çok yönlü gösterge, herhangi bir sembolün ticareti için uygundur ve hızlı sinyal tanımlaması sağlar. Bildirimler, mobil uyarılar, e-posta uyarıları ve açılır pencere uyarıları gibi çeşitli yöntemlerle alınabilir. Her gösterge, bireysel tercihlere göre kolayca etkinleştirilebilir veya devre dışı bırakılabilir.

DFP Reconnoiter Ultimate'ın parametreleri, kullanıcıların Fibonacci düzeylerini, Pivot noktalarını, ATR düzeylerini, ADR düzeylerini, hacim yüzdelerini ve şamdan kalıplarını özelleştirmesine olanak tanır. Hızlı ve yavaş dönemler, vardiya, yöntem ve uygulanan fiyat dahil olmak üzere hareketli ortalamalar da ayarlanabilir. Ek olarak, tüccarlar her Fibo, Pivot, ATR ve ADR seviyesi için pip sayılarının görüntülenmesini etkinleştirebilir/devre dışı bırakabilir.

Gösterge, kullanıcıların her gösterge için çizgi renklerini, stilleri, genişlikleri, yazı tiplerini ve yazı tipi boyutlarını ayarlamasına olanak tanıyan, tamamen özelleştirilebilir bir grafik arayüz sunar. Fibonacci, Pivot, ADR, ATR, hızlı MA, yavaş MA, hacim, kontrol paneli ve ok öğeleri için görsel özelleştirme mevcuttur.

DFP Reconnoiter Ultimate ile tüccarlar, kapsamlı bir gösterge seti ve özelleştirilebilir parametreler kullanarak Günlük Fibonacci Pivot Stratejisini verimli bir şekilde uygulayabilir, bu da daha bilinçli ticaret kararlarına ve piyasa tersine dönüşlerini ve çıkışlarını yakalamada gelişmiş doğruluğa yol açar.


    parametreler

    • Fibonacci Parametreleri - Fibonacci özelleştirme seçenekleri  
    • Pivot Noktası Parametreleri -   Pivot noktası özelleştirme seçenekleri
    • ATR Parametreleri - ATR göstergesini etkinleştir
    • ADR Parametreleri - Etkinleştir   ADR   gösterge
    • Hacim Parametreleri - Hacmi etkinleştir   gösterge
    • Desen Parametreleri - Etkinleştir   c ve sopa desenleri gösterge
    • Trend Parametreleri - Hareketli ortalama göstergesini ve özelleştirme seçeneklerini etkinleştirin
      • Pip Parametreleri - p ip sayısı göstergesini etkinleştir
      • Veri Paneli Parametreleri - Veri panelini etkinleştir
      • Uyarı Filtreleri - Belirli koşullar için uyarıları özelleştirin.
        • Grafik Parametreleri - Görsel görünümü ve renkleri özelleştirin.


        Önerilen ürünler
        Smooth price for Monarch MT4
        Konstantin Gruzdev
        3.67 (3)
        The Smooth Price technical indicator is used for plotting a smoothed line as close to the price of the financial instrument as possible, and serves to eliminate its noise components. The indicator is part of the Monarch trading system, but here it is presented as an independent technical analysis tool. The indicator is based on the cluster digital filter , which, unlike the ClusterSMA , is applied directly to the price time series. Smooth Price does not redraw (except the very last, zero bar) an
        Owl smart levels
        Sergey Ermolov
        4.63 (54)
        MT5 versiyonu  |  FAQ Owl Smart Levels Indicator ,   Bill Williams'ın gelişmiş fraktalları , piyasanın doğru dalga yapısını oluşturan Valable ZigZag ve kesin giriş seviyelerini gösteren   Fibonacci seviyeleri   gibi popüler piyasa analiz araçlarını içeren tek gösterge içinde eksiksiz bir ticaret sistemidir. pazara ve kar elde edilecek yerlere. Stratejinin ayrıntılı açıklaması Gösterge ile çalışma talimatı Baykuş Yardımcısı ticaretinde Danışman Yardımcısı Kullanıcıların özel sohbeti -> Satın ald
        VR Cub
        Vladimir Pastushak
        VR Cub , yüksek kaliteli giriş noktaları elde etmenin bir göstergesidir. Gösterge, matematiksel hesaplamaları kolaylaştırmak ve bir pozisyona giriş noktalarının aranmasını basitleştirmek için geliştirildi. Göstergenin yazıldığı ticaret stratejisi uzun yıllardan beri etkinliğini kanıtlamaktadır. Ticaret stratejisinin basitliği, acemi yatırımcıların bile başarılı bir şekilde ticaret yapmasına olanak tanıyan büyük avantajıdır. VR Cub, pozisyon açılış noktalarını ve Kâr Al ve Zararı Durdur hedef sev
        System Trend Pro - This is the best trend trading indicator!!! The indicator no repaint!!!   The indicator has   MTF   mode, which adds confidence to trading on the trend (   no repaint   ). How to trade? Everything is very simple, we wait for the first signal (big arrow), then wait for the second signal (small arrow) and enter the market in the direction of the arrow. (See screens 1 and 2.) Exit on the opposite signal or take 20-30 pips, close half of it, and keep the rest until the oppo
        Trendiness Index
        Libertas LLC
        5 (3)
        "The trend is your friend" is one of the best known sayings in investing, because capturing large trendy price movements can be extremely profitable. However, trading with the trend is often easier said than done, because many indicators are based on price reversals not trends. These aren't very effective at identifying trendy periods, or predicting whether trends will continue. We developed the Trendiness Index to help address this problem by indicating the strength and direction of price trend
        BinaryScalping
        Andrey Spiridonov
        BinaryScalping is a professional indicator for trading binary options and scalping. The algorithm of the indicator is based on the calculation of pivot points for each time period separately, the location of the price of the trading instrument relative to the pivot points is analyzed and the probability of a trading operation is calculated. The indicator has a built-in filter of trading signals based on the global trend. The indicator is installed in the usual way and works with any trading inst
        Trend Yakalayıcı: Alarm İndikatörü ile Trend Yakalayıcı Stratejisi, piyasa trendlerini ve potansiyel giriş ve çıkış noktalarını belirlemede yardımcı olan çok yönlü bir teknik analiz aracıdır. Piyasa koşullarına uyum sağlayarak trend yönünün net görsel temsili için dinamik bir Trend Yakalayıcı Stratejisi sunar. Tüccarlar tercihlerine ve risk toleranslarına göre parametreleri özelleştirebilirler. Gösterge, trendleri tanımlamaya yardımcı olur, potansiyel ters dönüşleri sinyaller, trailing stop m
        FREE
        This is the finest structure marking you will ever find in any market. indicator is coded considering the actual structure any trader would use. indicator is coded based on actual candle breaks and not coded based on any pivot or predefined values or specific number of candles high and low. please check out the screenshot. if you want me to fine tune it according to your needs then i am open for it.
        FX Flow
        Eva Stella Conti
        FX Flow   indicator can be used as an anticipator of the next trend, preferably confirmed by Price Action or another oscillator (RSi, Stochastic ..). It takes the money flows of the major currencies USD EUR GBP AUD NZD CAD CHF JPY into account, and processes them. Excellent tool for indices, but also for correlations between currencies. Works on each timeframes.  Blue line: Bull market Yellow line: Bear market Note : if the indicator opens the window, but does not draw lines, load the histo
        The indicator allows you to trade binary options. The recommended time frame is М1 and the expiration time is 1,2,3 minutes. The indicator suitable for auto and manual trading. A possible signal is specified as a arrows above/under a candle. You should wait until the candle closes! Arrows are not re-painted Trade sessions: TOKYO section (Half-end) Currency pairs: USD/JPY Working time frame: M1 Expiration time: 1,2,3 minutes. The indicator also shows good results when using the martingale strateg
        FREE
        WanaScalper MT4
        Isaac Wanasolo
        1 (1)
        A scalping indicator based on mathematical patterns, which on average gives signals with relatively small SL, and also occasionally helps to catch big moves in the markets (more information in the video) This indicator has three main types of notifications: The first type warns of a possible/upcoming signal on the next bar The second type indicates the presence of a ready signal to enter the market/open a position The third type is for SL and TP levels - you will be notified every time price r
        Trend PA
        Mikhail Nazarenko
        5 (3)
        The Trend PA indicator uses   Price Action   and its own filtering algorithm to determine the trend. This approach helps to accurately determine entry points and the current trend on any timeframe. The indicator uses its own algorithm for analyzing price changes and Price Action. Which gives you the advantage of recognizing, without delay, a new nascent trend with fewer false positives. Trend filtering conditions can be selected in the settings individually for your trading style. The indicator
        TrendPlus
        Sivakumar Subbaiya
        4.21 (14)
        Trend Plus   Trendplus  Indicator   Time Frame: Suitable for any time frame.  Purpose: Trend Prediction. Blue and red candle indicate the buy and sell call respectively. Buy: When the blue candle is formed buy call is initiated. close the buy trades when the next red candle will formed.   Sell: When the Red candle is formed Sell call is initiated. close the Sell trades when the next blue candle will formed.   Happy trade!!
        FREE
        Fibonacci Magic Pivot Levels
        Savia Forex Software Solutions
        Fibonacci Magic Pivot Levels The  Fibonacci Magic Pivot Levels  is a  powerful yet easy to use indicator . It   continuously monitor s intra-day  price action  and uses complex algorithms to calculate and detect key support, resistance and pivot levels, using the D1 timeframe as a filter.  The    Fibonacci Magic Pivot Levels is optimized for H4, H1, M30, M15, M5 & M1 timeframes and  can be used on ALL Currencies, Indices, Commodities, and Cryptocurrency pairs . Trade with improved confidence an
        Title : UT_Bot - ATR-Based Trading Indicator Introduction : Discover the power of "UT_Bot," the ultimate trading indicator that leverages the Average True Range (ATR) to provide unparalleled accuracy in your trading decisions. If you're seeking a more reliable alternative to the Super Trend indicator, look no further. UT_Bot is your key to precision trading. Key Features : ATR-Powered Precision: UT_Bot uses the ATR to deliver accurate signals that adapt to market volatility. Enhanced Trend Detec
        That is my master piece invented new Forex indicator Copyright 2010 to 2100 (316009) for Sami A. Saydam. This indicator is showing the real Support and Resistance levels in dynamical ways as movable red lines with time, also works on all time charts' intervals. The price movements are strongly respecting those red lines and either confirmed break them or just touching them and can't break them up or down then move toward the right directions. This new techniques are the real alerting system ca
        NostradamusMT4
        Andrey Spiridonov
        1 (1)
        NostradamusMT4 is a powerful indicator from the set of professional trader. The indicator is based on Andrei Spiridonov's original price calculation method (ESTIMATED PRICE) for the current candle price. Advantages The indicator does not redraw. It works on any timeframes. Works with any trading instruments. Perfectly suitable for scalping and trading binary options. Parameters Color - color of the ESTIMATED PRICE FUTURE line. How to work with the indicator The indicator forms the ESTIMATE
        Market Profile 3
        Hussien Abdeltwab Hussien Ryad
        4 (4)
        Market Profile 3 MetaTrader 4 indicator  — is a classic Market Profile implementation that can show the price density over time, outlining the most important price levels, value area, and control value of a given trading session. This indicator can be attached to timeframes between M1 and D1 and will show the Market Profile for daily, weekly, monthly, or even intraday sessions. Lower timeframes offer higher precision. Higher timeframes are recommended for better visibility. It is also possible t
        FREE
        Shark Deal Book
        Philip Pankaj Suthagar
        4 (3)
        Term  "shark"  in the business world denotes a high volume investor who just made a good investment in a highly Potential business deal.So, sharks are the ones who make the market move. In our case, if an American shark bought a Japanese company, he/she has to convert American dollars into Japanese yen to make the deal. So, the demand for the Japanese yen will increase sharply. Thus USD/JPY will go short rapidly if the deal was from the shark. Another example, In the case of forex, if fed increa
        Black series MT4
        Dmitriy Kashevich
        1 (1)
        Black series MT4 - The indicator is designed for trading on binary options with Timeframe M1-M5-M15 Multicurrency (Works on cryptocurrency and currency pairs) The signal appears when the candle opens Up to 90% correct signals There is no signal redrawing at all Can be used with other indicators. Good for scalping! In Settings there is: -Indicator working methods -I Allert Arrow color Red signal down Blue signal up Also watch the video how the indicator works and signals
        Limitless MT4
        Dmitriy Kashevich
        Limitless MT4 is a universal indicator suitable for every beginner and experienced trader. works on all currency pairs, cryptocurrencies, raw stocks Limitless MT4 - already configured and does not require additional configuration And now the main thing Why Limitless MT4? 1 complete lack of redrawing 2 two years of testing by the best specialists in trading 3 the accuracy of correct signals exceeds 80% 4 performed well in trading during news releases Trading rules 1 buy signa
        Strength and weakness of currencies : Shows the currency status at any time, values between 50 and -50 are neutral, everything outside indicates a trend change  Waves : Current state of waves, daily, weekly monthly and yearly Recommended volume for trading a specific number of waves Yearly High Low Drawn waves on which the market will react in advance, without redrawing Yearly candle with bonus levels used to display deviations  For more info contact me
        PZ Trend Trading
        PZ TRADING SLU
        4.75 (4)
        Trend Trading is an indicator designed to profit as much as possible from trends taking place in the market, by timing pullbacks and breakouts. It finds trading opportunities by analyzing what the price is doing during established trends. [ Installation Guide | Update Guide | Troubleshooting | FAQ | All Products ] Trade financial markets with confidence and efficiency Profit from established trends without getting whipsawed Recognize profitable pullbacks, breakouts and early reversals The ind
        Gyroscope        professional forex expert   (for EURUSD, GBPUSD, USDJPY, AUDUSD, USDCHF, EURGBP, EURJPY, NZDUSD, USDCAD, EURCHF, AUDJPY, CADJPY pairs)   alyzing the market using the Elliot Wave Index. Elliott wave theory is the interpretation of processes in financial markets through a system of visual models (waves) on price charts. The author of the theory, Ralph Elliott, identified eight variants of alternating waves (of which five are in the trend and three are against the trend). The mo
        Power Renko is an indicator which plots Renko bricks underneath the chart using a histogram. You can select the brick size and the timeframe of the Renko bricks as well as whether or not to use the close price or the high/low price of the candles. Renko bricks are based on price alone, not time, therefor the Renko bricks will not be aligned with the chart's time. They are extremely useful for trend trading and many different strategies can be formed from them. Buffers are provided allowing you t
        Простое визуальное и эффективное обнаружение тренда.Сигнал поступает на " закрытой свече  ".Работает на всех символах и таймфреймах.Индикатор не использует входных параметров.Все алгоритмы для расчета заложены в код.Индикатор может использовать для разработки советников.Изменение цвета индикатора,характеризует поведение рынка.Зеленый цвет сигнализирует восходящее движение.Красный цвет сигнализирует о нисходящем движении.Желтый цвет показывает флет.Желаю всем удачной торговли!!!
        Gösterge, tarihsel olanlarla karşılaştırılabilecek güncel teklifler oluşturur ve bu temelde bir fiyat hareketi tahmini yapar. Gösterge, istenen tarihe hızlı navigasyon için bir metin alanına sahiptir. Seçenekler: Sembol - göstergenin göstereceği sembolün seçimi; SymbolPeriod - göstergenin veri alacağı dönemin seçimi; GöstergeRenk - gösterge rengi; Ters - doğru tırnakları tersine çevirir, yanlış - orijinal görünüm; Sonraki, tarihi girebileceğiniz ve 'enter' tuşuna basa
        Blahtech Market Profile
        Blahtech Limited
        4.61 (18)
        Was: $249  Now: $99   Market Profile defines a number of day types that can help the trader to determine market behaviour. A key feature is the Value Area, representing the range of price action where 70% of trading took place. Understanding the Value Area can give traders valuable insight into market direction and establish the higher odds trade. It is an excellent addition to any system you may be using. Blahtech Limited presents their Market Profile indicator for the MetaTrader community. Ins
        [V 1.00] MTF NRPA 5 RSI RTD yayınlandı! Yeniden boyanmayan ok gerçek zamanlı pano. Çeşitli RSI göstergelerini kullanmaktan sıkıldıysanız ancak bunların hatalı olduğunu düşünüyorsanız, bu aracı deneyin. Genellikle insanlar bir zaman diliminde OBOS seviyesini belirlemek için yalnızca 1 RSI kurarlar. Kötü haber şu ki, aynı anda çeşitli zaman dilimlerinde OBOS seviyelerini ve trendlerini göremiyorsunuz. Bu ticaret aracını bu yüzden geliştirdim. İşte nasıl açıklandığı: Bu ticaret aracında be
        BSA Indicator
        Ahmet Metin Yilmaz
        BSA indikatörü ZigZag bazlı bir indikatördür. Bu indikatör fiyatın geri dönüş seviyesini bulmakta kullanılır. Girdilerde mevcut risk oranı ve hesaplama timeframe ini kullanım tercihinize göre optimize ederek kullanabilirsiniz.  Düşük zaman dilimlerinde indikatör yeniden boyama yapabilir. Daha sağlıklı sonuçlar için uygulayacağınız grafiğe göre bir süre gözlem yaparak en az yeniden boyamayı tespit edebilirsiniz. 
        Bu ürünün alıcıları ayrıca şunları da satın alıyor
        Mucizevi Forex Göstergesi Tanıtımı: Keskin Ticaretin Gücünü Serbest Bırakın Tüm zaman dilimlerinde gerçekten olağanüstü sonuçlar sunan en iyi Forex göstergesini aramaktan sıkıldınız mı? Artık aramayın! Mucizevi Forex Göstergesi, ticaret deneyiminizi devrimleştirip kazançlarınızı yeni zirvelere taşımak için burada. Gelişmiş teknoloji ve yılların özenli geliştirmesi temelinde Mucizevi Forex Göstergesi, döviz piyasasında güç ve keskinlik açısından doruğa çıkar. Bu olağanüstü araç, tüm seviyelerdeki
        TrendMaestro
        Stefano Frisetti
        5 (2)
        note: this indicator is for METATRADER4, if you want the version for METATRADER5 this is the link: TRENDMAESTRO recognizes a new TREND in the bud, he never makes mistakes. The certainty of identifying a new TREND is priceless. DESCRIPTION TRENDMAESTRO identifies a new TREND in the bud, this indicator examines the volatility, volumes and momentum to identify the moment in which there is an explosion of one or more of these data and therefore the moment in which prices have strong probability of f
        How to use Pair Trading Station Pair Trading Station is recommended for H1 time frame and you can use it for any currency pairs. To generate buy and sell signal, follow few steps below to apply Pair Trading Station to your MetaTrader terminal. When you load Pair Trading Station on your chart, Pair Trading station will assess available historical data in your MetaTrader platforms for each currency pair. On your chart, the amount of historical data available will be displayed for each currency pai
        Indicator : RealValueIndicator Description : RealValueIndicator is a powerful tool designed specifically for trading on the EURUSD pair. This indicator analyzes all EUR and USD pairs, calculates their real currency strength values, and displays them as a single realistic value to give you a head start on price. This indicator will tell you moves before they happen if you use it right. RealValueIndicator allows you to get a quick and accurate overview of the EURUSD currency pair tops and bottoms,
        Gann Signal
        Kirill Borovskii
        Gann Signal is a very simple indicator at first glance, but hidden inside is many years of experience in studying W.D.Ganna methods. The indicator gives accurate BUY/SELL signals, without redrawing. The indicator is very easy to use. All you need to do is attach it to your chart and follow its recommendations. The indicator constantly analyzes the market for entry opportunities. When such an opportunity appears, the indicator gives a signal in the form of an arrow. I repeat, all signals are NOT
        Candle Power Pro
        Thushara Dissanayake
        4.33 (6)
        Candle Power Pro   göstergesi ile gerçek hacim bilgisinin gücünü ortaya çıkarın. Bu dinamik araç, her mum için gerçek hacim verilerini yakalar ve toplam hacmin yüzdesi olarak sunar. Bunu yaparak, pazarda alıcılar ve satıcılar arasında süregelen mücadeleyi fark etmenizi sağlar. Candle Power Pro, alıcılar ve satıcılar arasındaki savaşı toplam hacmin yüzdesi olarak göstererek size pazar dinamikleri hakkında değerli bilgiler verir. Alıcı ve satıcıların hacmini analiz ederek kırılmaları kolayca onayl
        Market Breaker Updated version 3
        Allistair Kabelo Mandow
        1 (1)
        Features for software Main functions: Accurate entry signals WITHOUT REPAINTING! Once a signal appears, it remains valid! This is a significant distinction from repainting indicators that might provide a signal and then alter it, potentially leading to deposit losses. Now, you can enter the market with higher probability and precision. There's also a function to colour candles after an arrow appears until the target (take profit) is reached or a reversal signal appears . Display of STOP LOSS
        Weis Wave with Alert
        Trade The Volume Waves Single Member P.C.
        4.79 (19)
        Rental/Lifetime Package Options and Privileges' * For optimum results the yearly or lifetime package is suggested due to live training and Discord  channel trading with the  creator! Rent Monthly Six Months   Yearly/Lifetime Weis Wave with Speed with Alert+Speed Index x x x Manual  x x x Quick Set up Video x x x Blog x x x Lifetime Updates x x x Setup and Training Material x x Free Rectangle Break Alert Tool      x Discord Access Channel "The SI traders" x 2-hour live methodology traini
        Full STO
        Roman Smoroda
        Tam STO göstergesi (üç STO göstergesinin tüm sürümlerini içerir: Premium, Gold, Silver) - STABLE TRADE OPTION, otomatik ikili opsiyon ticareti için tasarlanmıştır.  DİKKATLİCE OKUYUN!!!!! ÖNEMLİ Bir terminalde farklı sürelere sahip iki şablon oluşturun: 18:01, 18:02 için 1 ila 15 dakika arasında süreleri olan bir şablon ve 22:00 için 10 ila 20 dakika arasında süreleri olan bir şablon. Kazanma oranı: Son 5 yılda %71 Para yönetimi: Mevduattan %0,3 Göstergenin bu sürümü yalnızca Gümüş ve
        Connect Indicator
        Sukunthakan Ngernbamrung
        Connect Indicator is a tool used for connecting indicators between the MQL market and MT4. The connected indicators are made by our group and can be used for other applications, such as sending messages to the Line application or Telegram application. If you have any questions, please don't hesitate to ask us to receive support. Function and indicator buffer Buffer one is the high price of the previous candle. Buffer two is the high price of the previous candle. Usage To connect indicators to fu
        Idea: RSI ( Relative Strength Index) and CCI ( Commodity Channel Index ) are powerfull to solved the market.  This indicator has Smoothed Algorithmic signal of RSI and CCI. So that, it separates the market into buy and sell zones, these areas are marked with arrows, red for downtrend, green for uptrend. This algorithm has the effect of predicting the next trend based on the historical trend, so users need to be cautious when the trend has gone many candles. Please visit screenshots
        DESCRIPTION The CHAOS INDICATOR has been developed to be used for the TRADING STRATEGY OF CHAOS, as described in the book. The book is in italian language only and can be obtained only on my website indicated below. DATAS COLLECTED AND SHOWN ON GRAPHS The CHAOS INDICATOR apply easily to any graph and any asset, and it is a TRADING FACILITATOR, as it identify immediately the following items on any graph: - The GP (= RIGHT PRICE) i.e. the price to which the asset should be attracted within 24
        Gann Swing Structure
        Kirill Borovskii
        5 (1)
        This indicator is based on the mathematics of the great trader W.D. Ganna. With its help, you can easily find strong levels by analyzing swings to find the optimal entry point. The indicator works on all instruments and all timeframes. The indicator is fully manual and has control buttons. All you need to do is press the NEW button, a segment will appear, which you can place on any movement, swing or even 1 candle that you want to analyze. By placing the segment, press the OK button. A grid (th
        A. A2SR nedir ?   * Önde gelen bir teknik göstergedir (yeniden boyama yok, gecikme yok). -- Rehberlik : -- https://www.mql5.com/en/blogs/post/734748/page4#comment_16532516 adresinde -- ve https://www.mql5.com/en/users/yohana/blog A2SR, Destek (talep) ve Direnç (arz) seviyelerini belirlemede özel bir tekniğe sahiptir. İnternette gördüğümüz sıradan yoldan farklı olarak A2SR, gerçek SR seviyelerini belirlemede özgün bir konsepte sahiptir. Orijinal teknik internetten alınmadığı gibi internette
        BB Reversal Arrows Teknik Ticaret Sistemi, perakende kararları almak için ters noktaları tahmin etmek için geliştirilmiştir. Mevcut pazar durumu gösterge ile analiz edilir ve çeşitli kriterler için yapılandırılır: ters anlar beklentisi, potansiyel dönüm noktaları, satın alma ve satış sinyalleri. Gösterge fazla bilgi içermez, tüccarların makul kararlar vermesine izin veren görsel anlaşılabilir bir arayüze sahiptir. Tüm oklar mumu kapatıyor gibi görünüyor, yeniden çizim yapmadan, birkaç uyarı
        Gann Zone Pro
        Kirill Borovskii
        This indicator identifies and displays zones, as it were areas of strength, where the price will unfold. The indicator can work on any chart, any instrument, at any timeframe. The indicator has two modes. The indicator is equipped with a control panel with buttons for convenience and split into two modes. Manual mode: To work with manual mode, you need to press the NEW button, a segment will appear. This segment is stretched over the movement and the LVL button is pressed. The level is displayed
        Full Forex Market View Dashboard
        Opengates Success International
        5 (2)
        TAM FOREX PİYASASI GÖRÜNÜMÜ Pano Göstergesi Bu, Yatırımcılara piyasada neler olup bittiğine dair tam bir görüş sağlamak için oluşturulmuş özel bir göstergedir. Piyasaya erişmek ve başarılı ticaret yapmak için gereken her türlü bilgiyi görüntülemek için gerçek zamanlı bir veri kullanır. KURULUM: Bu Göstergeyi pencere grafiğinize eklemeden önce, MT4'ünüzün Piyasa İzleme paneline gidin ve ihtiyaç duymadığınız veya ticaret yapmadığınız tüm Döviz çiftlerini GİZLEYİN ve geri kalanını orada bı
        The indicator is designed to work on any trading platform. The program is based on proprietary algorithms and W.D.Ganna's mathematics, allowing you to calculate target levels of price movement based on three points with the highest degree of certainty. It is a great tool for stock trading. The indicator has three buttons: NEW - call up a triangle for calculation. DEL - delete the selected triangle. DELS - completely remove all constructions. The probability of achieving the goals is more than 80
        EZT Trend
        Tibor Rituper
        4 (1)
        EZT Trend göstergesi size trendi, geri çekilmeyi ve giriş fırsatlarını gösterecektir. İsteğe bağlı filtreleme ve her türlü uyarı mevcuttur. E-posta ve anlık bildirim uyarıları eklendi. Ayrıca bu göstergeyi temel alan ve yakında kullanıma sunulacak bir EA da geliştiriyoruz. İki renkli histogram ve bir çizgiden oluşan çok işlevli bir göstergedir. Bu, bir trendin yönünün ve gücünün görsel bir temsilidir; ayrıca çizgide veya histogramda birçok kez sapma bulacaksınız. Gösterge, otomatik parametr
        IA Trendx3 PRO
        Marco Aurelio Santos Costa
        What if God Created a Trade System? No miracles... Just see how mathematics can be effective in the market. We managed to combine technical analysis / price action into indicators, creating the best setup for trading, be it in Forex, Indices, or stocks. It took us 2 years to create something that really works, and now it's time for you to discover it. TrendX3 is a revolution in trend analysis. Based on advanced algorithms and real-time data, it provides valuable insights so that you can make inf
        This is a trend Predictor. Honestly I have to give some credit to some few developers I know personally because they helped pulled this off.  The trend indicator uses special optics to direct the flow of price . it detects where the trend is moving into  It uses price action and a few other embedded custom indicator. You can use it in all timeframes and will be available at a much cooler price.  Please test this Indicator before buying to make sure you like what you see. I can't guarantee th
        The breakout algorithm is a technique based on price, price features, to shape a breakout strategy. The strategy in this indicator will not be redrawn (none-repaint indicator), it is suitable for short or long term traders In the screenshot is the EURUSD pair, these currency pairs, commodities or stocks, it have similar strength *Non-Repainting (not redrawn) *For Metatrader4 Only *Great For Scalping *Great For Swing Trading *Arrow Entry, Green is Long, Red is Short *Works On Any Timeframe *Work
        Yalnızca tek bir gösterge kullandığınız için sık sık işlem kaybediyorsanız bu işlem aracını deneyin. Bu ticaret aracı birden fazla gösterge kullanır. Yalnızca RSI göstergesini kullanan tüccarları sıklıkla gözlemliyorum. Çoğu zaman piyasa aşırı satıştadır ancak hala aşağıdadır veya piyasa aşırı alımdadır ancak hala yüksektir. Bu nedenle birden fazla gösterge kullanmanız gerekir. Yeni sürüm V 3.40 MTF PPAAF ile tanışın: Çoklu Zaman Çerçevesi Hassas Fiyat Eylem Oku Filtrelendi. Bu ticaret aracı, p
        Market Breaker Pro
        Allistair Kabelo Mandow
        PYTHONFX INCEPTION TRADING SYSTEM THE BROKERS WORST NIGHTMARE... IMPORTANT! After the purchase please send me a private message to receive the installation manual and the setup instructions. We proudly introduce the PYTHONFX ROYAL CIRCLE Inception trading system, your key to financial freedom.   This is the brokers worst nightmare. Seriously! Modern market conditions require modern solutions & if you are still struggling to analyse the charts and struggling to find consistency in the
        "Dragon's Tail" is an integrated trading system, not just an indicator. This system analyzes each candle on a minute-by-minute basis, which is particularly effective in high market volatility conditions. The "Dragon's Tail" system identifies key market moments referred to as "bull and bear battles". Based on these "battles", the system gives trade direction recommendations. In the case of an arrow appearing on the chart, this signals the possibility of opening two trades in the indicated directi
        SMCpro VIP MT4  Original Price  $620   ---  Currently Price 20% OFF ( for unlimited use )   BONUS  AUX VIP Club 2024 : Include  EA Airbag  and  Load Data History  to enhance the performance of this tool to its maximum potential  Click Here to Download Files   ( for users only )   Hello World! Introducing.. SMCpro VIP tool and Indicator for MetaTrader 4, designed to revolutionize your trading experience with the ICT Smart Money Concept. This system is meticulously crafted to empower trad
        PZ Harmonacci Patterns
        PZ TRADING SLU
        3.43 (7)
        This is arguably the most complete harmonic price formation auto-recognition indicator you can find for the MetaTrader Platform. It detects 19 different patterns, takes fibonacci projections as seriously as you do, displays the Potential Reversal Zone (PRZ) and finds suitable stop-loss and take-profit levels. [ Installation Guide | Update Guide | Troubleshooting | FAQ | All Products ] It detects 19 different harmonic price formations It plots primary, derived and complementary Fibonacci pro
        Intro to APAMI, PROfessional edition Trace exactly how far prices trend between two price levels with fractional pip precision, while qualifying price movement between the same price levels. Completely automate when trends change direction and volatility, without any lag .  This is possible because the Accurate Price Action Measurement Indicator (APAMI) actually does what no other indicator can:  measure price distance between two points and simultaneously qualify the price action that occurs
        Fibonacci Retracements Pro
        Savia Forex Software Solutions
        Fibonacci Retracements Pro The Fibonacci Retracements Pro is a powerful yet easy to use indicator. It automatically plots all the important Fibonacci retracement and extension levels for you. FRP is dynamic powerful and seamlessly adjusts to whatever timeframe you are analyzing. Fibonacci Retracement Pro is optimized for ALL timeframes and ALL Currency pairs, Indices, Commodities, and Cryptocurrency pairs. Trade with improved confidence and maximize your success rate. Benefits Dynamic and Power
        The Stochastic Basket Currency Strenght  brings the Stochastic indicator to a new level.  Expanding the boundaries of TimeFrames and mono-currency analysis, the SBCS take the movements of each currency that composes the cross and confront them in the whole basket of 7 crosses.  The indicator works with any combination of AUD, CAD, CHF, EUR, GBP, JPY, NZD, USD pairs and with full automation takes in account every stochastic value (main line) for the selected Time Frame.  After that, the indicator
        Yazarın diğer ürünleri
        Candle Power Pro
        Thushara Dissanayake
        4.33 (6)
        Candle Power Pro   göstergesi ile gerçek hacim bilgisinin gücünü ortaya çıkarın. Bu dinamik araç, her mum için gerçek hacim verilerini yakalar ve toplam hacmin yüzdesi olarak sunar. Bunu yaparak, pazarda alıcılar ve satıcılar arasında süregelen mücadeleyi fark etmenizi sağlar. Candle Power Pro, alıcılar ve satıcılar arasındaki savaşı toplam hacmin yüzdesi olarak göstererek size pazar dinamikleri hakkında değerli bilgiler verir. Alıcı ve satıcıların hacmini analiz ederek kırılmaları kolayca onayl
        BullsBears Action
        Thushara Dissanayake
        3.91 (22)
        BullsBears Action Expert Advisor,   ticaret kararları için   Boğalar   ve   Ayılar   hacim verilerini kullanmak üzere tasarlanmış güçlü bir araçtır. Mum hacmine göre piyasadaki Boğa ve Ayı yüzdesini analiz eden bu EA, kullanıcı tanımlı parametrelere göre Alış veya Satış emirlerini otomatik olarak açar. Risk yönetimi, otomatik durdurma kaybı ayarı ve özelleştirilebilir ayarlar içeren kullanıcı dostu bir ticaret çözümü sunar. Bu uzman danışmanın en önemli özelliklerinden biri, toplam marja dayalı
        FREE
        Volume Percentage Line Graph
        Thushara Dissanayake
        4.75 (4)
        Hacim Yüzdesi Çizgi Grafiği,   hacim verisi bilgileri sağlamak için tasarlanmış bir göstergedir. Her mum için toplam hacim bilgisini alır ve bunu toplam hacmin yüzdesi olarak sunar. Gösterge, bu verileri ayrı bir pencerede grafik çizgiler olarak göstererek, kullanıcıların alıcılar ve satıcılar arasındaki savaşı kolayca görselleştirmesine olanak tanır. Bu göstergenin en önemli özelliklerinden biri, hacim yüzdesini grafik çizgiler olarak gösterebilmesidir. Satıcılar ve alıcılar arasındaki hacim da
        FREE
        Ms Fibonacci
        Thushara Dissanayake
        3.75 (8)
        Grafiğinizde Fibonacci seviyelerini çizme ve ayarlama sürecini basitleştirmek için tasarlanmış güçlü ve ücretsiz bir gösterge olan   Bayan Fibonacci ile   tanışın. Bu gösterge, yeni en yüksek ve en düşük Fibonacci seviyelerini otomatik olarak tanımlayıp işaretleyerek doğru ve kesin yerleştirme sağlar. Bayan Fibonacci'nin en önemli özelliklerinden biri, Fibonacci seviyelerini doğru bir şekilde çizme, noktadan noktaya ve karşılık gelen fiyat seviyelerini işaretleme yeteneğidir. Bu özellik, Fibonac
        FREE
        Ez Channel
        Thushara Dissanayake
        Ez Channel   göstergesi, grafikte gerçek trend kanallarını otomatik olarak tanımladığından, trendi takip eden tüccarlar için önemli bir araçtır. Bu gösterge ile artık grafiklerinize manuel olarak trend çizgileri çizmek için saatler harcamanıza gerek yok. Herhangi bir sembol ve zaman çerçevesi için hızlı bir şekilde trend kanalları çizerek zamandan ve emekten tasarruf etmenizi sağlar. Ez Channel'ın en önemli özelliklerinden biri, zaman dilimlerini tercihinize göre kolayca ayarlamanıza olanak tanı
        Extract Candle Power
        Thushara Dissanayake
        5 (2)
        Extract Candle Power,   her mum sırasında satıcıların ve alıcıların davranışlarına ilişkin değerli bilgiler sağlayan gerçek zamanlı bir hacim çıkarıcı göstergesidir. Tüccarlar, hacim verilerini analiz ederek, geleneksel Hareketli Ortalama göstergelerinin yeteneklerini aşarak, piyasa eğilimleri ve potansiyel geri dönüşler hakkında daha bilinçli kararlar alabilir. Bu güçlü araç, mevcut mumun satıcı ve alıcı hacmini çıkarmanıza ve analiz etmenize ve ayrıca önceki mumların hacmiyle karşılaştırmanıza
        RSI Geçiş Uyarısı,   ticaret stratejilerinde   Göreceli Güç Endeksi'ni (RSI)   kullanan tüccarlar için özel olarak tasarlanmış güçlü bir bildirim sistemidir. Bu gösterge, hızlı RSI çizgisi yavaş RSI çizgisinin üstünden veya altından geçtiğinde meydana gelen RSI geçişlerini belirlemeye odaklanır. Gösterge, bu geçişleri birleştirerek yanlış sinyalleri etkili bir şekilde filtreleyerek tacirlerin daha doğru ticaret kararları vermesini sağlar. RSI Crossover Alert, işlevselliğini ve kullanılabilirliğ
        Fibo Scalper Pro
        Thushara Dissanayake
        2.33 (3)
        Fibo Scalper Pro Expert Advisor,   popüler   Fibonacci Ticaret Stratejilerini   otomatikleştirmek için tasarlanmış güçlü bir araçtır. Grafik üzerinde Fibonacci seviyelerini otomatik olarak çizerek ve ayarlayarak ticaret sürecini basitleştirir. Bu özellik, analizlerinde Fibonacci düzeltmelerini ve uzantılarını kullanan tüccarlar için kolaylık ve doğruluk sağlar. Fibo Scalper Pro'nun en önemli özelliklerinden biri, özelleştirme olanağıdır. Profesyonel tüccarların, kendi özel ticaret tercihlerin
        Breakout Robot
        Thushara Dissanayake
        4.5 (4)
        Çok rağbet gören EURJPY Breakout Stratejisini benzersiz bir kolaylıkla otomatikleştirmek için tasarlanmış devrim niteliğinde bir araç olan   Breakout Robot Expert Advisor   ile tanışın. Bu güçlü EA, 22:00 - 02:00 GMT arasında yüksek ve düşük değerleri kullanarak zahmetsizce bir kutu çizen basit ama etkili bir sisteme sahiptir. Daha sonra, tümü M15 zaman çerçevesi için optimize edilmiş, fiyat kutunun üstüne/altına düştüğünde SATIN AL/SAT emirlerini otomatik olarak yürütür. Eksiksiz özelleştirme y
        Mr Fibonacci
        Thushara Dissanayake
        5 (2)
        Grafiğinizde Fibonacci seviyelerini çizme ve ayarlama sürecini basitleştirmek için tasarlanmış harika bir gösterge olan   Mr. Fibonacci ile   tanışın. Bu gösterge, profesyonel tüccarlar için olağanüstü özelleştirme seçenekleri sunarak, herhangi bir Fibonacci seviyesini hassasiyetle çizmelerine olanak tanır. Ayrıca, fiyat Fibonacci seviyelerine girdiğinde mobil bildirimler, e-posta uyarıları ve pop-up uyarıları sunarak potansiyel ticaret fırsatlarını asla kaçırmamanızı sağlar. Bu göstergeyi kulla
        Three MA Alert
        Thushara Dissanayake
        Üç MA Uyarı   göstergesi   , Hareketli Ortalamalar Geçiş Stratejisine   güvenen tacirler için önemli bir araçtır. Mobil cihazınıza, e-postanıza bildirimler göndererek ve üç hareketli ortalamanın kesiştiği her yerde sesli pop-up uyarıları görüntüleyerek işlem hayatınızı basitleştirir. Yaygın olarak kullanılan bu tekniği izleyerek, her zaman trendin doğru tarafında olduğunuzdan emin olabilir ve hakim piyasa yönüne karşı işlem yapmaktan kaçınabilirsiniz. Üç MA Uyarısı göstergesi ile artık oturup ha
        Two MA Crossover
        Thushara Dissanayake
        5 (3)
        İki MA Geçişi,   Hareketli Ortalama Geçiş Stratejisine   güvenen tacirler için özel olarak tasarlanmış güçlü bir bildirim sistemidir. Bu tam otomatik gösterge, önemli bir ticaret olayını asla kaçırmamanızı sağlayan kapsamlı bir uyarı sistemi görevi görür. Mobil cihazınıza, e-postanıza bildirimler gönderir ve tercih ettiğiniz parametrelere dayalı olarak hareketli bir ortalama geçişi algıladığında bilgisayarınızda sesli açılır uyarılar görüntüler. Dikkate değer özelliklerinden biri, en popüler Har
        Pivot Bro
        Thushara Dissanayake
        5 (1)
        Pivot Bro   teknik göstergesi   , Pivot, Fibonacci, ATR   ve   ADR   seviyelerini kullanarak düzeltme alanlarını belirlemek için tasarlanmış güçlü bir araçtır. Fiyat eylemine dayalı ters   şamdan modellerini   de tanıyarak bunun ötesine geçer. Ek olarak,   Para Birimi Ölçer   , büyük para birimlerinin gerçek gücünü değerlendirmek için değerli bir yol arkadaşıdır. 28 döviz çiftini analiz ederek ve güçlerini renk değişimleri ile grafik üzerinde göstererek, tüccarların giriş ve çıkış noktalarında b
        ReversalPatterns
        Thushara Dissanayake
        Bu teknik gösterge, grafikteki çeşitli   Ters Şamdan Modellerini   kullanarak fiyat hareketini otomatik olarak tanımlar ve analiz eder. Ok işaretlerini karşılık gelen kalıp adlarıyla birlikte çizerek en son ters şamdan kalıplarını bulmayı kolaylaştırır. Bu gösterge ile grafik analizini hızlı bir şekilde tanımlayabilir ve önceden tanımlanmış mum modelleriyle karşılaştırabilirsiniz. Gösterge, Dragonfly Doji, Gravestone Doji, Hammer, Pin Bar ve daha fazlası gibi hem basit hem de karmaşık bir dizi u
        Reversal Alert Pro
        Thushara Dissanayake
        2.5 (2)
        Reversal Alert Pro   göstergesi, piyasadaki geri dönüş alanlarını otomatik olarak tespit etmek için tasarlanmış güçlü bir araçtır. Doğrudan mobil cihazınıza gönderilen uygun bildirimler sunar ve sesli açılır uyarıları görüntüler. Bu göstergeyi ticaret stratejinize dahil ederek, ticaret pozisyonlarını etkili bir şekilde filtreleyebilirsiniz. Ayrıca gösterge, üretilen sinyalleri daha da hassaslaştırmak için CCI, RSI ve Stokastik göstergelerini kullanma seçeneği sunarak çok yönlülüğünü ve uygulanab
        Currency Strength 7
        Thushara Dissanayake
        Para Birimi Gücü 7   teknik göstergesi, yatırımcıların en popüler yedi para biriminin gücünü ölçmesine yardımcı olmak için tasarlanmış güçlü bir araçtır. AUD, USD, EUR, GBP, JPY, CHF ve CAD'in gücünü analiz eden bu gösterge, para birimi dinamikleri hakkında değerli bilgiler sağlar. Grafikte para birimi gücünü çizgiler kullanarak temsil eder ve tüccarların farklı para birimlerinin göreli gücünü hızlı bir şekilde değerlendirmesine olanak tanır. Bu göstergenin göze çarpan özelliklerinden biri, graf
        Crossover Action Expert Advisor,   en popüler ticaret stratejilerinden biri olan Hareketli   Ortalama Geçiş Stratejisini   otomatikleştirmek için tasarlanmış gelişmiş bir araçtır. Sezgisel arayüzü ve güçlü özellikleriyle bu uzman danışman, manuel alım satımın karmaşıklığını ortadan kaldırır ve alım satımları hareketli ortalama geçişlerine dayalı olarak otomatik olarak yürütür. Bu uzman danışmanın en önemli özelliklerinden biri, alım satımların uygun parti büyüklükleri ve maksimum risk limitleri
        CCI Action
        Thushara Dissanayake
        CCI Action Expert Advisor,   CCI (Commodity Channel Index) Stratejisini   otomatikleştirmek için tasarlanmış güçlü bir araçtır ve tacirlerin CCI düzeyindeki dokunuşlardan yararlanmalarına olanak tanır. Kullanıcı dostu ayarları ve güçlü risk yönetimi sistemi ile bu EA, CCİ göstergesini ticaret yaklaşımlarına dahil etmek isteyen tüccarlar için güvenilir ve verimli bir çözüm sunar. Bu Uzman Danışmanın en önemli özelliklerinden biri, tacirlerin ticari sermayeleri üzerinde kontrol sahibi olmalarına y
        News Robo
        Thushara Dissanayake
        2 (1)
        Haber Robo Uzman Danışmanı, haber tüccarlarının haber bültenleri sırasında gizli zarar durdurma ile bekleyen emirleri açmasına yardımcı olmak için tasarlanmış güçlü bir araçtır. Alım satım deneyiminizi geliştiren ve alım satımlarınızı koruyan çeşitli özellikler sunar. News Robo'nun en önemli özelliklerinden biri, zarar durdurma işlemlerini piyasa yapıcı brokerlerden gizlemeyi tercih eden haber yatırımcıları için ideal olan gizli zarar durdurma özelliğidir. Kârlı bir pozisyona ulaşıldığında, zara
        RSI Action
        Thushara Dissanayake
        3.67 (3)
        RSI Action Expert Advisor,   popüler   RSI (Göreceli Güç Endeksi)   stratejilerini otomatikleştirerek verimli ve doğru ticarete olanak tanıyan güçlü bir araçtır. Aşırı alım ve aşırı satım seviyelerini kullanarak, bu EA alış ve satış emirleri için en uygun giriş noktalarını belirler. Ayrıca, RSI geri dönüş noktaları, bekleyen emirler, ana trend belirleme ve Hareketli Ortalama Geçiş sinyalleri dahil olmak üzere ticaret hassasiyetini artırmak için çeşitli sinyal filtreleme seçenekleri sunar. Ek ola
        Candle GAP
        Thushara Dissanayake
        Mum GAP   göstergesi, haftanın her günü için mum boşluklarını otomatik olarak belirlediğinden,   Boşluk Ticareti Stratejilerini   kullanan tacirler için önemli bir araçtır. Boşluk, art arda iki günün kapanış ve açılış arasındaki fiyat seviyesi farkını ifade eder. Bu gösterge dört tür boşluk modelini tanır: Ortak, Koparma, Devam ve Tükenme. Tüccarlar, bu göstergeyi herhangi bir tabloya dahil ederek sinyallerini doğrulayabilir ve alım satım kararlarını geliştirebilir. Mum GAP göstergesinin temel ö
        Zararı Durdur ve Kar Al yönetimini otomatikleştirerek alım satım deneyiminizi geliştirmek için tasarlanmış güçlü bir araç olan   TPSL Sürücü Yardımcı Programı   ile tanışın. Bu yardımcı program, kesintisiz sipariş yönetimi ve gelişmiş kar koruma teknikleri isteyen her tacire hitap eder. TPSL Driver Utility ile, iki sipariş yönetimi modu arasında seçim yapma esnekliğine sahipsiniz: Gizli ve Görsel. Gizli mod, Kârı Al ve Zararı Durdur seviyelerini gizlemenize izin vererek işlemlerinizi yönetmek iç
        Entry Point
        Thushara Dissanayake
        Al/Sat bildirimleri sağlamak için tasarlanmış güçlü bir teknik gösterge olan   Giriş Noktası   ile tanışın. Bu gösterge, doğru sinyaller üretmek için 5 hareketli ortalamayı, CCI, RSI, Stokastik, Bill Williams ve hacim göstergelerini 3 farklı zaman diliminde analiz eder. Profesyonel tüccarlar için sınırsız özelleştirme seçenekleri sunarak göstergeyi deneyimlerine ve stratejilerine göre uyarlamalarına olanak tanır. Giriş Noktası, kullanıcılara mobil cihazlar, e-posta ve sesli açılır uyarılar aracı
        6 döviz çifti için Alış/Satış bildirimleri sağlamak üzere tasarlanmış güçlü bir teknik gösterge olan   Entry Point Dashboard Ultimate   ile tanışın. Bu gösterge, doğru sinyaller üretmek için 5 hareketli ortalamayı, CCI, RSI, Stokastik, Bill Williams ve hacim göstergelerini 3 farklı zaman diliminde analiz eder. Profesyonel tüccarlar için sınırsız özelleştirme seçenekleri sunarak göstergeyi deneyimlerine ve stratejilerine göre uyarlamalarına olanak tanır. Entry Point Dashboard Ultimate, kullanıcıl
        Fibonacci ticaret stratejinizde devrim yaratmak için tasarlanmış güçlü bir araç olan   Fibo Channels Ultimate   teknik göstergesiyle tanışın. Gelişmiş işlevselliği ile bu gösterge, grafiğinizdeki tüm geçmiş Fibonacci kanallarını otomatik olarak çizerek size zaman ve emek kazandırır. Fibo Channels Ultimate'ı diğerlerinden ayıran şey, profesyonel tüccarların arzu ettikleri herhangi bir Fibonacci seviyesini çekmelerine olanak tanıyan olağanüstü özelleştirme yetenekleridir. Bu esneklik seviyesi, gös
        Crossover Tactics Ultimate Expert Advisor,   popüler   Hareketli Ortalama Geçiş Stratejilerini   otomatikleştirmek için tasarlanmış güçlü bir araçtır. Sinyallerin güvenilirliğini artırmak için gelişmiş filtreleme teknikleri kullanırken, üç hareketli ortalamanın kesişimine dayalı olarak en uygun giriş noktalarını belirlemede mükemmeldir. Ancak, bu EA'yı diğerlerinden ayıran şey, TPSL Sürücü Yardımcı Programı algoritması olarak bilinen kapsamlı ticari yönetim sistemidir. Bu uzman danışmanın göze ç
        Currency Heat Wave Ultimate
        Thushara Dissanayake
        5 (1)
        Currency Heat Wave Ultimate   teknik göstergesi, tüccarlara ana para birimlerinin gücü hakkında gerçek zamanlı içgörüler sağlayan değerli bir araçtır. 28 döviz çifti analiziyle, doğrudan grafik üzerinde döviz gücüne ilişkin kapsamlı bir genel bakış sunarak kullanımı inanılmaz derecede kolay hale getirir. Renkleri dinamik olarak değiştirerek, tüccarların para birimlerinin pozisyonlarını hızlı bir şekilde belirlemelerine ve bilinçli kararlar vermelerine olanak tanır. Currency Heat Wave'in dikkate
        Exit Area Ultimate
        Thushara Dissanayake
        3 (1)
        Exit Area Ultimate,   grafikte günlük   Ortalama Gerçek Aralık (ATR)   ve   Ortalama Günlük Oran (ADR)   seviyelerini göstererek alım satım kararlarını geliştirmek için tasarlanmış teknik bir göstergedir. Bu seviyeleri anlayarak, tüccarlar bir varlığın gün boyunca ortalama hareketini kolayca değerlendirebilir. Bu çok yönlü gösterge, günlük tüccarlar için birden çok amaca hizmet eder, sipariş vermeye yardımcı olur, gün içi eğilimleri belirler, takip eden zarar durdurma seviyelerini belirler ve gü
        Level Scanner
        Thushara Dissanayake
        Seviye Tarayıcı   göstergesi, tüm   Destek ve Direnç seviyeleriyle   birlikte tablodaki   Yüksek   ve   Düşük   alanların tanımlanmasını otomatikleştirmek için tasarlanmış güçlü bir araçtır. Gerçek eğilimin daha net ve pürüzsüz bir temsilini sağlamak için   Gövde Hareketli Ortalamasının   kullanımını içerir. Bu gösterge olağanüstü bir hızla çalışarak, tacirlerin önemli ilgi alanlarını hızlı bir şekilde belirlemelerine ve daha bilinçli ticaret kararları vermelerine olanak tanır. Seviye Tarayıcını
        Infinity Oscillators Ultimate,   RSI, Stokastik, MACD, CCI ve Hacim stratejilerini kullanan tacirler için ticaret deneyimini geliştirmek üzere tasarlanmış her şey dahil bir   OSCI-KIT'dir   . Kapsamlı özellik yelpazesiyle bu gösterge, piyasa trendlerini analiz etmek, tersine çevirmeleri ve geri çekilmeleri belirlemek, ATR'yi kullanarak gün içi hedefleri hesaplamak ve önemli ticari olaylardan haberdar olmak için güçlü bir araç seti sunar. Bu göstergenin göze çarpan özelliklerinden biri, en popül
        Filtrele:
        watchout cafe
        107
        watchout cafe 2019.06.29 23:35 
         

        Good Work ;)

        İncelemeye yanıt