• Genel bakış
  • İncelemeler (7)
  • Yorumlar (2)
  • Yenilikler

Institucional Color Candle

4.86
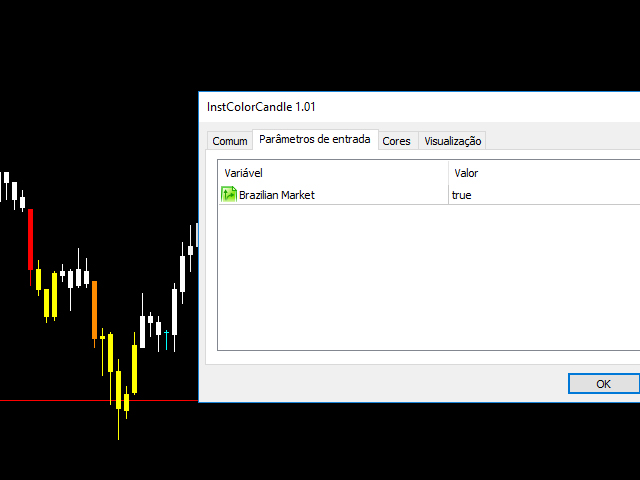
Idea extracted from the books by Anna Coulling and Gavin Holmes using Volume and Spread Analysis (VSA) techniques coupled with Al Brooks' expertise with Price Action these candles are magical, identify the exact moment
  of the performance of the big players are acting in the market represented by the colors:

1) Red Candles we have an Ultra High activity,
2) Candles Orange we have a Very High Activity
3) Candles Yellow we have one High Activity
4) White Candles represent normal activity in the market
5) Blue Candles, market activity is very low without interest in the continuation of the movement here I fear we usually have the end of the wave of a pullbacks

Download <SmoothAlgorithms.mqh> and include in the include folders of your metatrader
İncelemeler 7
Alessandro Lopes Da Silva
353
Alessandro Lopes Da Silva 2023.03.14 12:44 
 

Melhor indicador que já conheci aqui, se souber trabalhar com ele no momento certo, você vai ganhar muito dinheiro!!!!

RKE
660
RKE 2022.11.06 13:50 
 

Thank you. very helpful!

Rogerio1985
387
Rogerio1985 2022.10.20 21:27 
 

Mostra claramente atuação dos grandes volumes!!!

Önerilen ürünler
Time Scale for MT5
Taras Slobodyanik
4.88 (16)
The indicator draws the time scale on the chart. You can specify the time offset, adjust the size and font to display on the chart ( it is displaying your local time on your chart instead of MT time ). You can also select the desired format for displaying the date and time. You may be interested in my other product , which contains a more advanced version of the Time Scale . Parameters Hours (time shift) — time shift (hours); Minutes (time shift) — time shift (minutes); Show time on mouse — sh
FREE
Tick Bars
Henrique Helmuth Kreutz Pfeifer
Indicator that show candlestick bars with an different sampling method than time fixed. Real time data is sourced to the indicator and it may be used as substitute of the default graph. Each bar is formed when a predefined amount of ticks is received, showing in the graph the OHLC of this clusteri of ticks. The input variable is the amount of ticks of each bar. It's a different approach of sampling, the amount of bars is proportional to the amount of negotiations insted of a sample in a fixed am
FREE
ColorLine Indicator
MetaQuotes Ltd.
3.8 (5)
The ColorLine indicator shows the line of the price moving average on the chart. The line has diffrent colors (100 bars have the same color). The color settings of the line is changing every 5 ticks, there are 3 color schemes.  Indicator for demonstrating the DRAW_COLOR_LINE style. Draws a line at Close prices in colored pieces of 20 bars. The thickness, style and color of the line sections are changed randomly. The indicator code is published in the MQL5 Documentation in the section Indicator S
FREE
This indicator will mirror the assets in use in another metatrader, being able to choose the timeframe and a template. This is the Metatrader 5 Client, it needs the Metatrader 4 or 5 Server versions: Metatrader 4 Mirror Chart Server:   https://www.mql5.com/en/market/product/88644 Metatrader 5 Mirror Chart Server: https://www.mql5.com/en/market/product/88652 Details of how it works in the video.
FREE
High Low Open Close
Alexandre Borela
4.97 (36)
Bu projeyi seviyorsanız, 5 yıldız incelemesi bırakın. instagram'da izleyin: borelatech Bu gösterge açık, yüksek, düşük ve belirtilen fiyatlar için çizer Dönem ve belirli bir zaman bölgesi için ayarlanabilir. Bunlar birçok kurumsal ve profesyonel tarafından görünen önemli seviyelerdir. tüccarlar ve daha fazla olabileceği yerleri bilmeniz için yararlı olabilir Aktif. Mevcut dönemler şunlardır: Önceki gün. Önceki Hafta. Önceki Ay. Previous Quarter. Önceki yıl. Veya: Mevcut gün. Hafta. Şimdi Ay.
FREE
This indicator displays fractal symbols and bars Use this indicator to show different symbols for bearish and bullish fractals: Choose from 144 symbols (refer to table below) Colors, size and offset of fractals can be modified Fractal price bar or candle color can be changed Hide fractals and show fractal price bar only Frequency in fractal calculation can be changed How to use 1. Select which symbols to use for bearish and bullish fractals; 2. Select which colors to use for bearish and bulli
FREE
HMA Color with Alerts MT5
Pavel Zamoshnikov
4.73 (51)
Hull Moving Average (HMA) is well-deservedly popular among traders because of the effective averaging of market noise and a relatively small delay. The current MetaTrader 5 version changes its color when the movement direction changes. Sound and text signals are available. It also supports sending email and push messages. It is possible to trigger a signal on the current incomplete bar, although such a signal may be canceled before completion if conditions are no longer appropriate. One of the p
FREE
The utility is designed for two purposes: Automatic setting of stop loss and take profit levels. Automatic modification of stop loss and take profit levels when a certain profit is reached. Application: When the utility is started, the default values are configured as follows. Stops type:  Default Manual Automatic on/off level moving   - enable/disable moving levels with the price. (true) when begin move tp/sl levels  -  the number of points missing until the take profit level. (25 points) De
FREE
This indicator displays the spread Simple and easy to use and fully customisable: View as Pips or Pipettes Chart symbol can be hidden Text display can be changed Change color and text styles Add or hide a decimal point Spacing options between inputs Default screen positions Screen position inputs How to use 1. Simply use the default settings; or 2. Choose to show pips or pipettes; 3. Choose to display symbol, text or decimal; 4. Choose where to place it on the screen; 5. Save settings or save
FREE
H Line
Tomas Lucena De Oliveira
The moving average applied to the price chart is one of the most used technical analysis methods. There are several ways to use averages, among them, through the analysis of crossings. The method consists of using two moving averages, one fast period and one slow period. The concept is very simple, when there is a crossing of the fast moving average upwards it indicates a high market trend  and when the fast moving average crosses downwards it indicates a low  trend in the market, combining t
Heiken Ashi DA
Vitaly Dodonov
4.5 (2)
Что такое Heiken Ashi?    Heiken Ashi — это метод построения графиков, который можно использовать для прогнозирования будущего движения цены. Он похож на традиционные свечные графики. Однако в отличие от обычного свечного графика, график Heiken Ashi пытается отфильтровать часть рыночного шума для лучшего определения трендовых движений на рынке. Как рассчитать Heiken Ashi? Heiken Ashi использует формулу COHL, которая означает «Закрытие, Открытие, Максимум, Минимум». Это четыре компонента, кото
FREE
This indicator is based on the Fractals indicator. It helps the user identifying whether to buy or sell. It comes with an alert that will sound whenever a new signal appears. It also features an email facility. Your email address and SMTP Server settings should be specified in the settings window of the "Mailbox" tab in your MetaTrader 5. Blue arrow up = Buy. Red arrow down = Sell. Line = Trailing Stop. You can use one of my Trailing Stop products that automatically move the Stop Loss and includ
FREE
The indicator identifies when a divergence occurs between price and an indicator or oscillator. It identifies both regular and hidden divergences. Combined with your own rules and techniques, this indicator will allow you to create (or enhance) your own powerful system. Features Can detect divergences for the following oscillators/indicators:   MACD, OsMA, Stochastics, RSI, CCI, RVI, Awesome, ADX, ATR, OBV, Composite index, MFI and Momentum. Only one oscillator/indicator can be selected. Draws
FREE
Volume Candlestick Bars
Henrique Helmuth Kreutz Pfeifer
Indicator that show candlestick bars with an different sampling method than time fixed. Real time data is sourced to the indicator and it may be used as substitute of the default graph. Each bar is formed when a predefined volume of assets was dealt, showing in the graph the OHLC of this clustering. The amount of bars is proportional to the amount of negotiations instead of a sample in a fixed amount of time. If the broker doesn't show the real volume of the trades, this indicator won't work. Th
FREE
The indicator detects and displays М. Gartley's Butterfly pattern. The pattern is plotted by the extreme values of the ZigZag indicator (included in the resources, no need to install). After detecting the pattern, the indicator notifies of that by the pop-up window, a mobile notification and an email. The pattern and wave parameters are displayed on the screenshots. The default parameters are used for demonstration purposes only in order to increase the amount of detected patterns. Parameters
Recommended broker to use the indicator: https://tinyurl.com/5ftaha7c   Indicator developed by Diogo Sawitzki Cansi to show possible trade points. Do not repaint. The results displayed in the past are exactly what happened. We also use it to hold trades longer and not get out on false reversal signals which are actually just a profit taking of trades and no one is trying to reverse the direction of the trend. Indicator Parameters: PERIOD:   Period for analyzing the buying or selling force to fin
FREE
I present the well-known Fractal indicator. Levels have been added to this indicator. At the extreme points, you can see the continuation of the price line, which changes when the values of the Fractal indicator change. The indicator is easy to use. The basic Fractal settings have been saved. FractalLevels Parameters: LeftBars - the number of bars on the left RightBars - the number of bars on the right
FREE
Italo Trend Indicator MT5
Italo Santana Gomes
4.89 (9)
BUY INDICATOR AND GET EA FOR FREE AS A BONUS + SOME OTHER GIFTS! ITALO TREND INDICATOR  is the best trend indicator on the market, the Indicator works on all time-frames and assets, indicator built after 7 years of experience on forex and many other markets. You know many trend indicators around the internet are not complete, does not help, and it's difficult to trade, but the Italo Trend Indicator is different , the Italo Trend Indicator shows the signal to buy or sell, to confirm the signal t
What is this indicator? This indicator is the RSI (Relative Strength Index) supporting Virtual Trading mode of  Knots Compositor . When the mode is turned on, the indicator will be recalculated based on the displayed candlesticks. When the mode is turned off, the indicator will be recalculated based on the original chart candlesticks. Types of the applied price - Close - Open - High - Low - Median Price (HL/2) - Typical Price (HLC/3) - Weighted Price (HLCC/4) KC-Indicators -   KC-MA   (M
FREE
Easy and simple tool which close all trades in defined point of time. It can also close all open trades when opened positions reach defined target profit or stop loss. For all pairs, indexes etc. Works with all instruments. All types of orders. All charts. Users inputs: - close time (hour,min,sec) - take profit (in users currency) - stop loss (in users currency) Save & Load settings option. Fast, simple and reliable. Check out other tools provided by our team!
FREE
The indicator draws a normal chart by coloring it in colors based on prices calculated by the Heiken Ashi indicator algorithm. That is, the shape of the candles does not change. In fact, this is the same Heiken Ashi that does not distort the price chart. Then there will be a drawing of a cat, because there is nothing more to write about the indicator. .                                                       
FREE
Kesin işlem analizi parmaklarınızın ucunda: Yeni nesil işlem analizi yazılımı Piyasada bulunan ana akım işlem analizi yazılımları genellikle yalnızca saatlik veya haftalık kar ve zarar oranı istatistikleri sunar; bu da daha hassas işlem analizi ihtiyacını karşılamaktan uzaktır. Ancak, gerçek işlem piyasasında her gün benzersiz koşullar ortaya çıkar. Pazartesi günleri sakindir, çarşamba günleri üçlü gecelik faizle aktiftir ve cuma günleri önemli veri yayınlarının olması nedeniyle olağanüstü akti
FREE
如果产品有任何问题或者您需要在此产品上添加功能,请联系我 Contact/message me if you encounter any issue using the product or need extra feature to add on the base version. Floating Highest Lowest MT5 provides you an intuitive and user-friendly method to monitor the floating highest (profit) and lowest (loss) that all your trades together ever arrive. For example, I opened 3 orders, which arrived at $4.71 floating profit when trade following trend. Later when the trend is against me, these 3 orders arrive $30 in loss, and
FREE
Important Lines
Terence Gronowski
4.88 (26)
This indicator displays Pivot-Lines, preday high and low, preday close and the minimum and maximum of the previous hour. You just have to put this single indicator to the chart to have all these important lines, no need to setup many single indicators. Why certain lines are important Preday high and low : These are watched by traders who trade in a daily chart. Very often, if price climbs over or falls under a preday low/high there is an acceleration in buying/selling. It is a breakout out of
FREE
Period separators
Mykola Demko
4.56 (9)
The Period separators indicator separates time periods, specified by user. It supports all timeframes, greater or aliquot to current timeframe. In case of the incorect timeframe, the indicator modifies it to closest correct value. Additional bonus - the separation of non-standard time periods - MOON, MOON/2, MOON/4 (moon phases). The separators are plotted using the indicator's buffers. The indicator uses one graphic object for information about the progress and current bar properties. The grap
FREE
Dual Onset MT5
Dariel Iserne Carrera
4.8 (5)
This is the MT5 version. Get Dual Onset MT4 here   It is an algorithm to detect trend changes early. You should try multiple values for the Multiplier parameter (1 <value <10 recommended). At first glance you can see effective entries. This is, in fact, one of the rows that Geleg Faktor initially had. But it was removed because it was no longer needed. The other rows were sufficient for G.Faktor's effectiveness, but I still wanted to share this one. Always test before using it on your live
FREE
PZ Turtle Trading MT5
PZ TRADING SLU
4.43 (7)
The Turtle Trading Indicator implements the original Dennis Richards and Bill Eckhart trading system, commonly known as The Turtle Trader. This trend following system relies on breakouts of historical highs and lows to take and close trades: it is the complete opposite to the "buy low and sell high" approach. The main rule is "Trade an N-day breakout and take profits when an M-day high or low is breached (N must me above M)".  [ Installation Guide | Update Guide | Troubleshooting | FAQ | All Pr
FREE
Stat Monitor 5
Sergei Linskii
5 (1)
Stat Monitor is a good information indicator. Benefits of the indicator: The indicator provides useful information - the current spread, the cost of one lot of the symbol, trading leverage and the recommended lot size for trading. You can use the indicator on the MetaTrader 5 trading platform of any broker. The indicator provides useful information. Version of the Stat Monitor indicator for MetaTrader 4 I wish you all good luck in trading and stable profit!
FREE
This indicator is based on the Moving Average indicator. It helps the user identifying whether to buy or sell. It comes with an alert that will sound whenever a new signal appears. It also features an email facility. Your email address and SMTP Server settings should be specified in the settings window of the "Mailbox" tab in your MetaTrader 5. Blue arrow up = Buy. Red arrow down = Sell. Line = Trailing Stop. You can use one of my Trailing Stop products that automatically move the Stop Loss and
FREE
Ind5 InfoPad Information Panel
Vladislav Andruschenko
4.9 (10)
INFOPad, MetaTrader 5 terminalinde seçilen döviz çifti hakkında bilgi oluşturan bir bilgi panelidir. Bu göstergenin 5 işlevi vardır: Seçilen sembol üzerinde ana ve ana bilgileri gösterir: Teklif Sor, Spread, Stop Level, Swap, Tick değeri, Komisyon fiyatları; SL hedefinin ve TP Hedefinin gelecekteki hedeflerini gösterir (Kurulan zararı durdur ve kârı al puanlarının sayısı, dolar tutarı); Dönemler için alınan karı gösterir: Bugün, Hafta, Ay, Yıl, Seçilen para birimi için toplam kâr; Mevcut açık p
FREE
Bu ürünün alıcıları ayrıca şunları da satın alıyor
Öncelikle, bu Ticaret Sistemi'nin Non-Repainting, Non-Redrawing ve Non-Lagging Göstergesi olduğunu vurgulamak önemlidir, bu da hem manuel hem de robot ticareti için ideal hale getirir. "Smart Trend Trading System MT5", yeni ve deneyimli tüccarlar için özelleştirilmiş kapsamlı bir ticaret çözümüdür. 10'dan fazla premium göstergeyi birleştiriyor ve 7'den fazla sağlam ticaret stratejisi sunuyor, bu da çeşitli piyasa koşulları için esnek bir seçim yapar. Trend Takip Stratejisi: Trendleri etkili bir
Atomic Analyst MT5
Issam Kassas
4.27 (11)
Öncelikle belirtmek gerekir ki bu Ticaret Göstergesi Yeniden Çizim Yapmaz, Gecikmez ve Gecikme Göstermez, bu da hem manuel hem de robot ticareti için ideal hale getirir. Atom Analisti, Piyasada Daha İyi Bir Avantaj Bulmak İçin Fiyatın Gücünü ve Momentumunu Kullanan PA Fiyat Hareketi Göstergesidir. Gürültüleri ve Yanlış Sinyalleri Kaldırmaya ve Ticaret Potansiyelini Artırmaya Yardımcı Olan Gelişmiş Filtrelerle Donatılmıştır. Birden fazla katmanlı karmaşık göstergeler kullanarak, Atom Analisti
Quantum Trend Sniper
Bogdan Ion Puscasu
5 (37)
Tanıtım       Kuantum Trend Keskin Nişancı Göstergesi   , trend tersine dönmeleri belirleme ve ticaret yapma şeklinizi değiştiren çığır açan MQL5 Göstergesi! 13 yılı aşkın ticaret tecrübesine sahip deneyimli tüccarlardan oluşan bir ekip tarafından geliştirilmiştir.       Kuantum Trend Keskin Nişancı Göstergesi       trend dönüşlerini son derece yüksek doğrulukla belirlemenin yenilikçi yolu ile ticaret yolculuğunuzu yeni zirvelere taşımak için tasarlanmıştır. ***Kuantum Trend Keskin Nişancı Gö
FX Volume MT5
Daniel Stein
4.94 (17)
Sabah Brifingimiz aracılığıyla ayrıntılar ve ekran görüntüleri ile günlük piyasa güncellemenizi alın burada mql5 ve on Telegram ! FX Volume, bir brokerin bakış açısından piyasa duyarlılığı hakkında GERÇEK bir fikir veren İLK ve TEK hacim göstergesidir. COT raporlarından çok daha hızlı bir şekilde, brokerlar gibi kurumsal piyasa katılımcılarının Forex piyasasında nasıl konumlandıklarına dair harika bilgiler sağlar. Bu bilgileri doğrudan grafiğinizde görmek, ticaretiniz için gerçek oyun değiştir
Trend Screener Pro MT5
STE S.S.COMPANY
4.89 (61)
Trend Göstergesi, Trend Alım Satım ve Filtreleme için Çığır Açan Benzersiz Çözüm, Tüm Önemli Trend Özellikleriyle Tek Bir Araç İçinde Yerleştirildi! Forex, emtialar, kripto para birimleri, endeksler ve hisse senetleri gibi tüm sembollerde/araçlarda kullanılabilen %100 yeniden boyamayan çoklu zaman çerçevesi ve Çoklu para birimi göstergesidir. Trend Screener, grafikte noktalarla ok trend sinyalleri sağlayan etkili bir trend trend göstergesidir. Trend analizörü göstergesinde bulunan özellikler: 1.
Gold Stuff mt5
Vasiliy Strukov
4.89 (166)
Gold Stuff mt5, özellikle altın için tasarlanmış bir trend göstergesidir ve herhangi bir finansal enstrümanda da kullanılabilir. Gösterge yeniden çizilmez ve gecikmez. Önerilen zaman dilimi H1. Ayarları ve kişisel bir bonusu almak için satın alma işleminden hemen sonra benimle iletişime geçin!   AYARLAR Ok Çiz - açık kapalı. grafik üzerinde oklar çizmek. Uyarılar - sesli uyarılar kapalı. E-posta bildirimi - açık kapalı. E-posta Bildirimleri. Puch bildirimi - açık kapalı. Push bildirimleri
Öncelikle, bu Ticaret Aracının Non-Repainting, Non-Redrawing ve Non-Lagging Gösterge olduğunu vurgulamakta fayda var, bu da onu profesyonel ticaret için ideal hale getiriyor. Akıllı Fiyat Hareketi Kavramları Göstergesi, hem yeni hem de deneyimli tüccarlar için çok güçlü bir araçtır. İleri ticaret fikirlerini, Inner Circle Trader Analizi ve Smart Money Concepts Ticaret Stratejileri gibi 20'den fazla kullanışlı göstergeyi bir araya getirerek bir araya getirir. Bu gösterge, büyük kurumların tica
FX Power MT5 NG
Daniel Stein
5 (4)
Sabah Brifingimiz burada mql5 ve on Telegram! FX Power MT5 NG , uzun zamandır çok popüler olan döviz gücü ölçerimiz FX Power'ın yeni neslidir. Peki bu yeni nesil güç ölçer ne sunuyor? Orijinal FX Power hakkında sevdiğiniz her şey PLUS GOLD/XAU güç analizi Daha da hassas hesaplama sonuçları Ayrı ayrı yapılandırılabilir analiz dönemleri Daha da iyi performans için özelleştirilebilir hesaplama limiti Özel çokluDaha fazlasını görmek isteyenler için örnek ayarlar Her grafikte en sevdiğiniz renkler i
Advanced Supply Demand MT5
Bernhard Schweigert
4.53 (15)
Herhangi bir Acemi veya Uzman Tüccar için En İyi Çözüm! Bu gösterge benzersiz, yüksek kaliteli ve uygun fiyatlı bir ticaret aracıdır çünkü bir dizi tescilli özelliği ve yeni bir formülü bir araya getirdik. Bu güncelleme ile çift zaman dilimi dilimlerini gösterebileceksiniz. Yalnızca daha yüksek bir TF gösteremeyeceksiniz, aynı zamanda TF grafiğini ve ARTIK daha yüksek TF'yi de gösterebileceksiniz: YUVARLAK BÖLGELERİ GÖSTERMEK. Tüm Arz Talebi tüccarları buna bayılacak. :) Önemli Bilgiler Açıkland
RelicusRoad Pro MT5
Relicus LLC
4.82 (22)
Şimdi 147 $ (birkaç güncellemeden sonra 499 $ 'a yükseliyor) - Sınırsız Hesaplar (PC'ler veya Mac'ler) RelicusRoad Kullanım Kılavuzu + Eğitim Videoları + Özel Discord Grubuna Erişim + VIP Durumu PİYASAYA BAKMAK İÇİN YENİ BİR YOL RelicusRoad, forex, vadeli işlemler, kripto para birimleri, hisse senetleri ve endeksler için dünyanın en güçlü ticaret göstergesidir ve yatırımcılara kârlı kalmaları için ihtiyaç duydukları tüm bilgileri ve araçları sağlar. Başlangıç ​​seviyesinden ileri seviyey
XQ Indicator MetaTrader 5
Marzena Maria Szmit
5 (1)
Step into the realm of Forex trading with confidence and precision using XQ, a cutting-edge Forex indicator designed to elevate your trading game to unprecedented heights. Whether you're a seasoned trader or just stepping into the world of currency exchange, XQ Forex Indicator empowers you with the insights and signals needed to make informed trading decisions. The signal conditions are a combination of three indicators, and XQ Forex Indicator only display  medium and long-term trends . The ind
The Volume by Price Indicator for MetaTrader 5 features Volume Profile and Market Profile TPO (Time Price Opportunity). Get valuable insights out of currencies, equities and commodities data. Gain an edge trading financial markets. Volume and TPO histogram bar and line charts. Volume Footprint charts. TPO letter and block marker charts including split structures. Versatile segmentation and compositing methods. Static, dynamic and flexible ranges with relative and/or absolute visualizations. Lay
Auto Order Block with break of structure based on ICT and Smart Money Concepts Futures Break of Structure ( BoS )             Order block ( OB )            Higher time frame Order block / Point of Interest ( POI )    shown on current chart           Fair value Gap ( FVG ) / Imbalance   ,  MTF      ( Multi Time Frame )    Volume Imbalance     ,  MTF          vIMB Gap’s Equal High / Low’s     ,  MTF             EQH / EQL Liquidity               Current Day High / Low           HOD /
Top indicator for MT5   providing accurate signals to enter a trade without repainting! It can be applied to any financial assets:   forex, cryptocurrencies, metals, stocks, indices .  Watch  the video  (6:22) with an example of processing only one signal that paid off the indicator! MT4 version is here It will provide pretty accurate trading signals and tell you when it's best to open a trade and close it. Most traders improve their trading results during the first trading week with the help of
ICT, SMC, SMART MONEY CONCEPTS, SMART MONEY, Smart Money Concept, Support and Resistance, Trend Analysis, Price Action, Market Structure, Order Blocks, BOS/CHoCH,   Breaker Blocks ,  Momentum Shift,   Supply&Demand Zone/Order Blocks , Strong Imbalance,   HH/LL/HL/LH,    Fair Value Gap, FVG,  Premium  &   Discount   Zones, Fibonacci Retracement, OTE, Buy Side Liquidity, Sell Side Liquidity, BSL/SSL Taken, Equal Highs & Lows, MTF Dashboard, Multiple Time Frame, BigBar, HTF OB, HTF Market Structure
Fiyat tersine döndükçe ve geri çekildikçe piyasa yapısından elde edilen kâr değişir. Piyasa yapısını tersine çevirme uyarısı göstergesi, bir trendin veya fiyat hareketinin ne zaman tükenmeye yaklaştığını ve tersine dönmeye hazır olduğunu tanımlar. Genellikle bir geri dönüş veya büyük bir geri çekilme meydana gelmek üzereyken meydana gelen piyasa yapısındaki değişiklikler konusunda sizi uyarır. Gösterge, olası bir tükenme noktasının yakınında her yeni yüksek veya düşük oluştuğunda, başlangıçta
Blahtech Supply Demand MT5
Blahtech Limited
4.57 (14)
Was: $299  Now: $99   Supply Demand uses previous price action to identify potential imbalances between buyers and sellers. The key is to identify the better odds zones, not just the untouched ones. Blahtech Supply Demand indicator delivers functionality previously unavailable on any trading platform. This 4-in-1 indicator not only highlights the higher probability zones using a multi-criteria strength engine, but also combines it with multi-timeframe trend analysis, previously confirmed swings
Gann Kare Göstergesi, W.D. Gann tarafından yazılan "Piyasa Tahminleri için Matematiksel Formül" makalesine dayalı güçlü bir piyasa analizi aracıdır. Bu araç, piyasa analizi için matematiksel ve Gann teorilerini kullanarak hassas analizler gerçekleştirir. 144, 90, 52 karelerini ve ayrıca 9 karesini kullanır. Ayrıca, ın 9 karesi ve bu kareyle ilişkili kanallar ve yıldız modelleri için yöntemini içerir. Kullanıcı Kılavuzu ve Uygulama: Bu göstergeleri kullanmadan önce, kullanıcı kılavuzunu okumanız
Trend Line Map Pro MT5
STE S.S.COMPANY
4.67 (9)
Trend Line Map indicator is an addons for   Trend Screener Indicator . It's working as a scanner for all signals generated by Trend screener ( Trend Line Signals ) . It's a Trend Line Scanner based on Trend Screener Indicator.  If you don't have Trend Screener Pro Indicator,   the Trend Line Map Pro will not work.     LIMITED TIME OFFER : Trend Line Map Indicator is available for only 50 $ and lifetime. ( Original price 125$ ) By accessing to our MQL5 Blog,  you can find all our premium indica
TrendLine PRO MT5
Evgenii Aksenov
4.78 (49)
The Trend Line PRO indicator is an independent trading strategy. It shows the trend change, the entry point to the transaction, as well as automatically calculates three levels of Take Profit and Stop Loss protection Trend Line PRO is perfect for all Meta Trader symbols: currencies, metals, cryptocurrencies, stocks and indices Advantages of Trend Line PRO Never redraws its signals The possibility of using it as an independent strategy It has three automatic levels Take Profit and Stop Loss lev
Tanıtım       Quantum Breakout PRO   , Breakout Bölgeleri ile ticaret yapma şeklinizi değiştiren çığır açan MQL5 Göstergesi! 13 yılı aşkın ticaret tecrübesine sahip deneyimli tüccarlardan oluşan bir ekip tarafından geliştirilmiştir.       Kuantum Breakout PRO       yenilikçi ve dinamik koparma bölgesi stratejisiyle ticaret yolculuğunuzu yeni zirvelere taşımak için tasarlanmıştır. Kuantum Breakout Göstergesi, size 5 kar hedefi bölgesi ile kırılma bölgelerinde sinyal okları ve kırılma kutusuna
Owl Smart Levels MT5
Sergey Ermolov
4.47 (36)
MT4 versiyonu  |  FAQ Owl Smart Levels Indicator , Bill Williams'ın gelişmiş fraktalları , piyasanın doğru dalga yapısını oluşturan Valable ZigZag ve kesin giriş seviyelerini gösteren Fibonacci seviyeleri gibi popüler piyasa analiz araçlarını içeren tek gösterge içinde eksiksiz bir ticaret sistemidir. pazara ve kar elde edilecek yerlere. Stratejinin ayrıntılı açıklaması Gösterge ile çalışma talimatı Baykuş Yardımcısı ticaretinde Danışman Yardımcısı Kullanıcıların özel sohbeti -> Satın aldıktan
AW Trend Predictor MT5
AW Trading Software Limited
4.76 (54)
Tek bir sistemde trend ve kırılma seviyelerinin kombinasyonu. Gelişmiş bir gösterge algoritması piyasa gürültüsünü filtreler, trendi, giriş noktalarını ve olası çıkış seviyelerini belirler. Gösterge sinyalleri, sinyal geçmişinin etkinliğini gösteren en uygun enstrümanların seçilmesine izin veren bir istatistiksel modüle kaydedilir. Gösterge Kâr Al ve Zararı Durdur işaretlerini hesaplar. Kılavuz ve talimatlar ->   BURAYA   / MT4 versiyonu ->   BURAYA Gösterge ile nasıl ticaret yapılır: Trend Pre
Gartley Hunter Multi
Siarhei Vashchylka
5 (5)
Gartley Hunter Multi - An indicator for searching for harmonic patterns simultaneously on dozens of trading instruments and on all classic timeframes: (m1, m5, m15, m30, H1, H4, D1, Wk, Mn). Manual (Be sure to read before purchasing) | Version for MT4 Advantages 1. Patterns: Gartley, Butterfly, Shark, Crab. Bat, Alternate Bat, Deep Crab, Cypher 2. Simultaneous search for patterns on dozens of trading instruments and on all classic timeframes 3. Search for patterns of all possible sizes. Fr
Was: $249  Now: $99   Market Profile defines a number of day types that can help the trader to determine market behaviour. A key feature is the Value Area, representing the range of price action where 70% of trading took place. Understanding the Value Area can give traders valuable insight into market direction and establish the higher odds trade. It is an excellent addition to any system you may be using. Inspired by Jim Dalton’s book “Mind Over Markets”, this indicator is designed to suit the
TPSpro TRENDPRO  - is a trend indicator that automatically analyzes the market and provides information about the trend and each of its changes, as well as giving signals for entering trades without redrawing! The indicator uses each candle, analyzing them separately. referring to different impulses - up or down impulse. Exact entry points into transactions for currencies, crypto, metals, stocks, indices!  -  Version MT4                  DETAILED DESCRIPTION        /       TRADING SETUPS       
Black Dragon indicator mt5
Ramil Minniakhmetov
4.82 (56)
Trend algılama göstergesi, herhangi bir stratejiyi tamamlayacak ve bağımsız bir araç olarak da kullanılabilir. ÖNEMLİ! Talimatlar ve bonus almak için satın alma işleminden hemen sonra benimle iletişime geçin!   Faydalar Kullanımı kolay; grafiği gereksiz bilgilerle aşırı yüklemez. Herhangi bir strateji için filtre olarak kullanma yeteneği. Hem kar elde etmek hem de zararı durdurmayı ayarlamak için kullanılabilen, yerleşik dinamik cupport ve direnç seviyeleri içerir. Mum kapandıktan sonra g
Golden Spikes Detector
Batsirayi L Marango
5 (1)
Golden Spikes Detector This indicator is based on an advanced strategy primarily for trading spikes on Boom and Crash Indices. Complex algorithms were implemented to detect high probability entries only. It alerts on potential Buy and Sell entries. To trade spikes on the Deriv or Binary broker, only take Buy Boom and Sell Cash alerts. It was optimised to be loaded on 5-minute timeframe although multiple timeframe analysis is done in the background. Features ·             Desktop pop up and sound
Matrix Arrow Indicator MT5
Juvenille Emperor Limited
5 (14)
Matrix Arrow Indicator MT5 ,   forex ,   emtialar ,   kripto   para birimleri ,   endeksler ,   hisse senetleri   gibi tüm sembollerde/araçlarda kullanılabilen   %100 yeniden boyamayan   çoklu zaman çerçevesi göstergesini izleyen benzersiz bir 10'u 1 arada trenddir.  Matrix Arrow Indicator MT5 , mevcut eğilimi erken aşamalarında belirleyecek ve aşağıdakiler gibi 10'a kadar standart göstergeden bilgi ve veri toplayacaktır: Ortalama Yönlü Hareket Endeksi (ADX) Emtia Kanal Endeksi (CCI) Klasik Hei
IX Power MT5
Daniel Stein
5 (2)
IX Power   nihayet FX Power'ın rakipsiz hassasiyetini Forex dışı sembollere getiriyor. En sevdiğiniz endeksler, hisse senetleri, emtialar, ETF'ler ve hatta kripto para birimlerindeki kısa, orta ve uzun vadeli eğilimlerin yoğunluğunu doğru bir şekilde belirler. Terminalinizin sunduğu   her şeyi analiz   edebilirsiniz. Deneyin ve işlem yaparken   zamanlamanızın   nasıl   önemli ölçüde iyileştiğini   deneyimleyin. IX Power Temel Özellikler 100 hassas, yeniden boyanmayan hesaplama sonuçları -
Yazarın diğer ürünleri
Simple Weis Wave
Jean Jacques Huve Ribeiro
4.2 (5)
One of the best tools for analyzing volume, Weis Wave was idelized by David Weis, to facilitate the reading of directional flow. For the VSA method disciples it is an evolution of the practices created by Richard Wycoff, facilitating a predictive reading of the market, always seeking an accumulation and distribution of the negotiated contracts. Cumulative wave volume  Range of wave ( removed) Average Wave volume Ref "Tim Ord lectures" ( removed)
FREE
Wave Box Market Frenquency
Jean Jacques Huve Ribeiro
4.83 (6)
Totally linked to the result of a movement and the duration he had. Its height records how many ticks the asset walked during a given movement, its width shows us the duration that movement had. Its configuration must be in line with the Weis Wave Indicator configuration to observe the movement force and can indicate a possible accumulation or distribution of the movement;
FREE
Vwap Bar
Jean Jacques Huve Ribeiro
VWAP BAR  It´s power full indicator of candle by candle when lined up   with greate analysis, you have great opportunity, finder defense candle. Is a good ideia from order flow method, now your meta trader 5   inside you time frame chart .   What is the Volume Weighted Average Price (VWAP)? The volume weighted average price (VWAP) is a trading benchmark used by traders that gives the average price a security has traded at throughout the day, based on both volume and price. It is important
FREE
OrderFlowWay
Jean Jacques Huve Ribeiro
Indicator tested for 7 years with excellent results when used correctly An order flow tracking indicator when used at support and residence points simply shows the direction of the Big Players, validating good opportunities seek optimal risk-adjusted returns on their investments. Use when Flow line crossing at signal line after candle closed , works with absolutely everything
Institucional Pivot
Jean Jacques Huve Ribeiro
Institutional Pivot is a result of 5 years of research on order flow analysis in the Forex market and Nasdaq, seeking mounting and defense positions. The one of the best support and resistance points you can have right now available to everyone. You can opt for the Forex, CME and Brazilian markets in the settings Choosing the market just plot on the chart to make your trades
Filtrele:
Herb Wenzel
153
Herb Wenzel 2023.08.15 21:39 
 

Any chance I could get a copy of the source code?

Alessandro Lopes Da Silva
353
Alessandro Lopes Da Silva 2023.03.14 12:44 
 

Melhor indicador que já conheci aqui, se souber trabalhar com ele no momento certo, você vai ganhar muito dinheiro!!!!

RKE
660
RKE 2022.11.06 13:50 
 

Thank you. very helpful!

Rogerio1985
387
Rogerio1985 2022.10.20 21:27 
 

Mostra claramente atuação dos grandes volumes!!!

josé alberto
48
josé alberto 2021.03.01 17:46 
 

MUITO BOM INDICADOR E QUE SUBSTITUI O SATOs BARR

Jose San Martin
122
Jose San Martin 2020.09.20 03:19 
 

Very good tool, as a scalper makes me to know when the the price action is in my favor at the first look, I keep track of many charts at the same time,THANKS SO MUCH for the hard work and make my job easier

Paulo Moraes
261
Paulo Moraes 2019.03.05 04:27 
 

Indico a todos que queiram comprar esta ferramenta, vale apena...eu diria que funciona igual ou melhor que o Satos Bar que tantos falam no famoso curso da internet.

İncelemeye yanıt
Sürüm 1.4 2020.04.03
fix bugs
several improvements