Rsi Magic kjuta
- Göstergeler
- Jurii Kuvshinov
- Sürüm: 1.0
- Etkinleştirmeler: 5
Индикатор RSI magic kjuta.
Пользовательский Индикатор ( RSI magic kjuta ) на основе стандартного Индикатора Силы (Relative Strength Index, RSI) с дополнительными настройками и функциями.
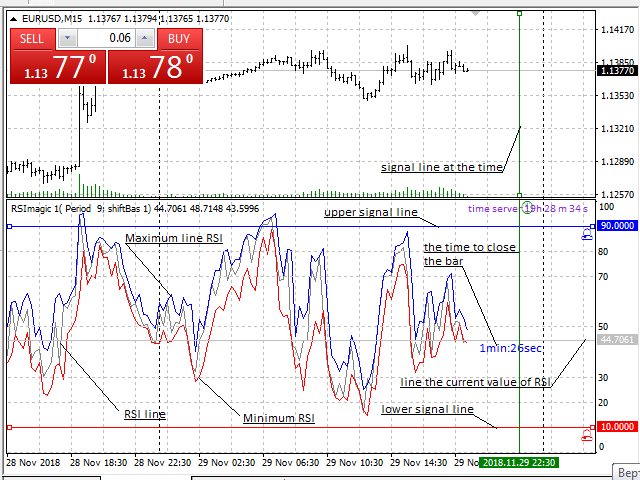
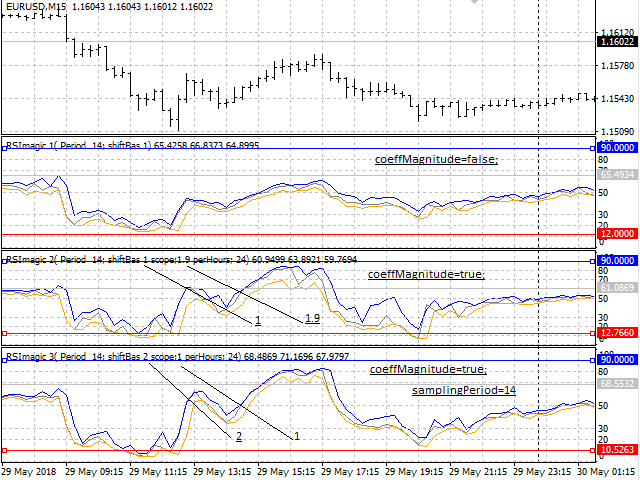
К стандартной линии RSI добавлены линии максимального и минимального значения RSI на графике. Теперь можно визуально наблюдать прошедшие максимумы и минимумы RSI, а не только значения по закрытию баров, что позволяет избежать путаницы при анализе торгов. Например, советник открыл или закрыл ордер, но на графике линия RSI не достигает значения срабатывания. Это происходит из-за того, что значение RSI достигло этого значения, но потом опустилось или поднялось до уровня закрытия бара. Особенно это видно на линиях максимума и минимума при пиковых значениях цены, при свечах в один бар. Ориентирование на значение этих линий позволяет более реально выставлять уровни срабатывания или вести ручную торговлю.
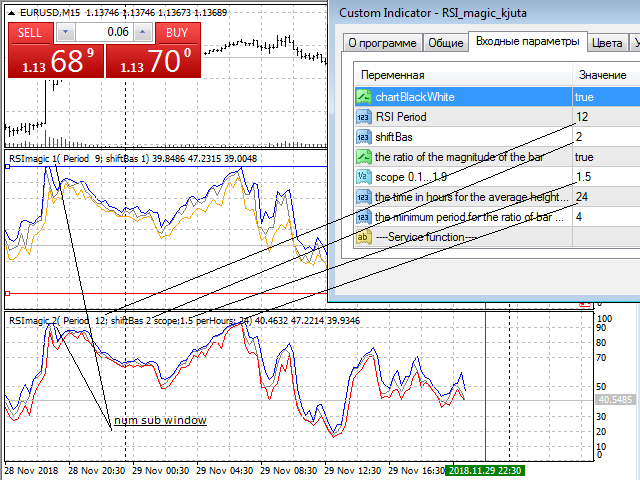
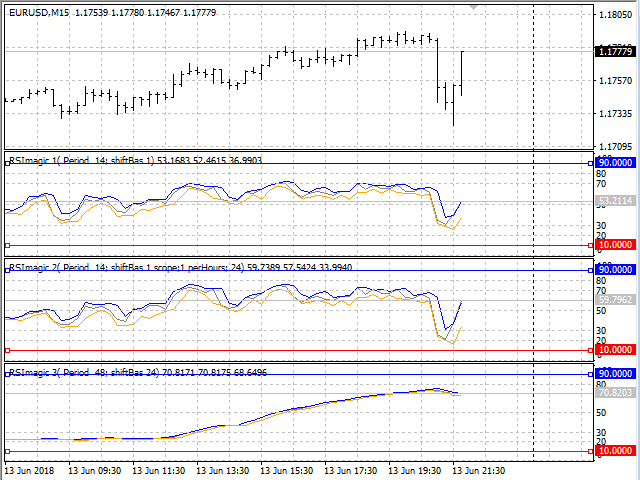
Добавлена настройка сдвига бара (shiftBas). Значение положительных и отрицательных ценовых изменений берется не только из предыдущего значения закрытия как в стандартном RSI, а на установленное значение, что приводит при малых значениях к сдвигу уровней размаха RSI. При больших значениях сдвига бара (shiftBas) и периода, можно вероятнее установить значения TP и Lots. При установках значение (shiftBas) не должно быть больше значения периода. Рекомендованный период 14.
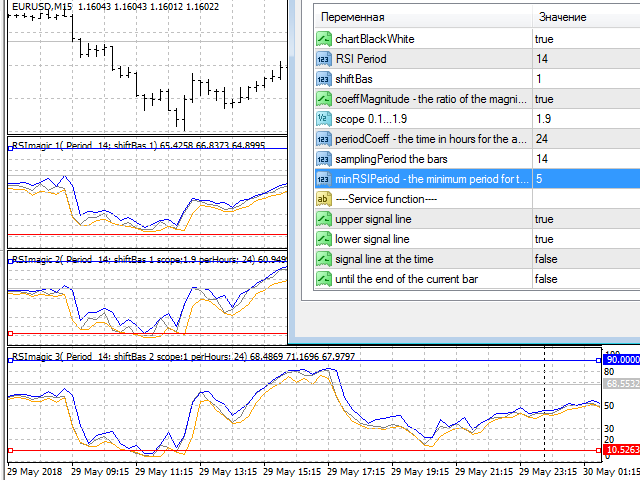
Функция коэффициента размаха RSI от средней величины бара (coeffMagnitude) позволяет автоматически уменьшать размах при малых размерах баров (например, при снижении волатильности на азиатской сессии или между сессиями) и увеличение размаха на высоких барах. Период (periodCoeff) по умолчанию сутки (24 часа). Значение Периода выборки (sampling period) устанавливается в барах. Увеличение размаха (scope) – это значение степени от разницы между средней величиной за (periodCoeff) и (sampling period),” (sampling period/ periodCoeff)^ (scope)”.
Значение минимального периода RSI ( minRSIPeriod) ограничивает размах до значений для данного периода (например, при (minRSIPeriod= InpRSIPeriod)- будет уменьшаться размах только при низкой волатильности) и не должен быть меньше 3.
Сервисные функции.
Это сигнальные линии, при достижении которых значений RSI или времени раздается звуковой сигнал и время до конца бара, время сервера. Включаются во входных параметрах. Переменная (chartBlackWhite) включает одноименную цветовую схему графика.
Удачных торгов.