CCI currency strength meter DEMO
- Göstergeler
- Miroslav Stojic
- Sürüm: 1.1
- Güncellendi: 3 Haziran 2019
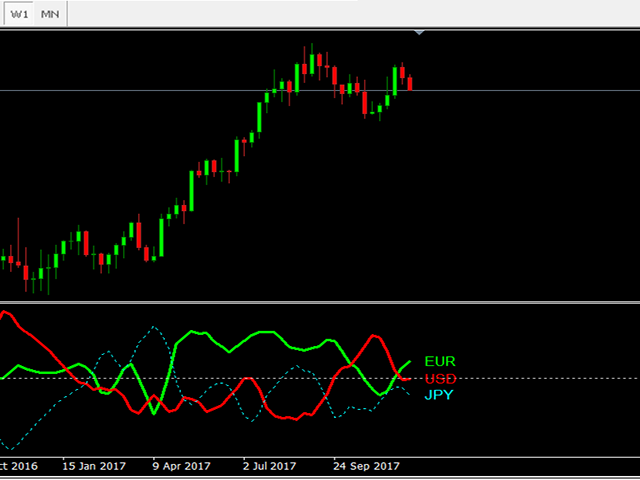
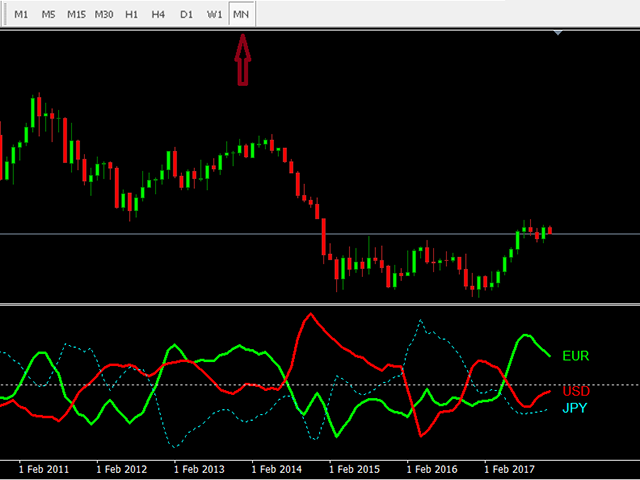
CCI Currency Strength Meter uses CCI (Commodity Channel Index) to monitor how strong a currency is, or in other words, if it's being bought or sold by the majority compared to the other currencies. If you load this indicator on a chart, it will first display the strength-lines of the currencies (base and counter currency of the chart) with changeable solid lines. Also, you can add up to ONE additional currency (only 1 for the DEMO version, but on REAL up to 5) to the "comparison pool" that already has the base and the profit (counter) currency of the pair.
- Note: this is a DEMO version of the REAL indicator! The link to the REAL version is: https://www.mql5.com/en/market/product/26899
Settings for the CCI indicator used:
- CCI period: the period of the CCI (14 by default),
- Apply to: which price should CCI be based on (close, open, high, low, median...),
- Smoothing Factor: so that the lines don't look choppy; less or 1 = No smoothing, and 2 or more = smoothing applied (the smoothing factor applies to the CCI currency strength meter indicator, and not to the CCI used).
Lines formatting for the base and counter currency:
- Color of the base currency: self-explanatory, select the color for the base currency,
- Width: width of the line of the base currency,
- Style: line style (solid, dash, dot...),
- Color of the profit currency: color for the counter currency,
- Width: width of the line of the profit currency,
- Style: the style of the line of the profit currency (solid, dot, dash...).
Next is formatting for the additional 5 currencies (this one example is the same for all 5):
- Currency n: write in the 3 letters symbol of the currency you want to display (examples: "eur" or "aUd" or "usD" or "NZD".."Btc" - all these formats are acceptable)
- Color: color of that selected currency,
- Width: line width,
- Style: line style (if width is 1).
The same is for the next 4 currencies.
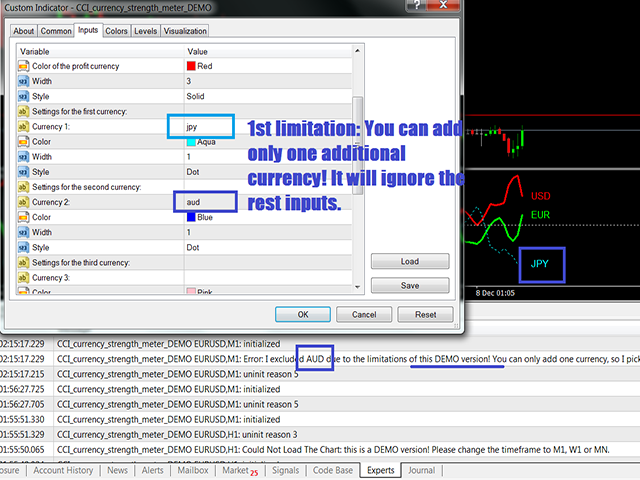
Limitations of the DEMO version:
- You can only display 1 additional line. Usually, the indicator takes the first available one, and ignores the rest!
Also, visit the REAL version of this indicator here: https://www.mql5.com/en/market/product/26899
- Suggestion: Wach the provided video to make everything clear.