Gartley Projection D
- Göstergeler
- Oleksandr Medviediev
- Sürüm: 3.23
- Güncellendi: 22 Ağustos 2017
- Etkinleştirmeler: 20
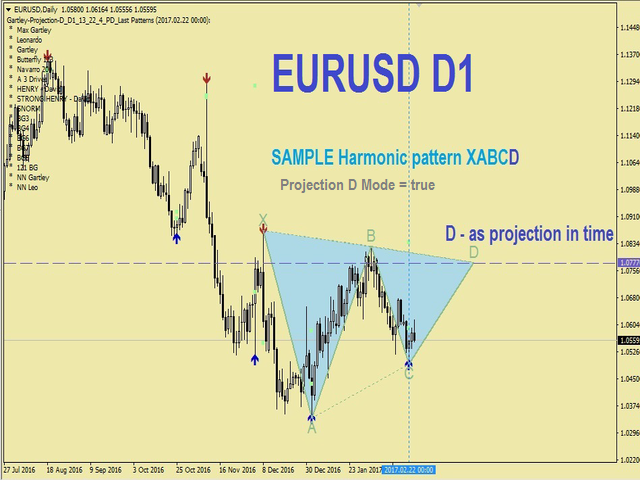
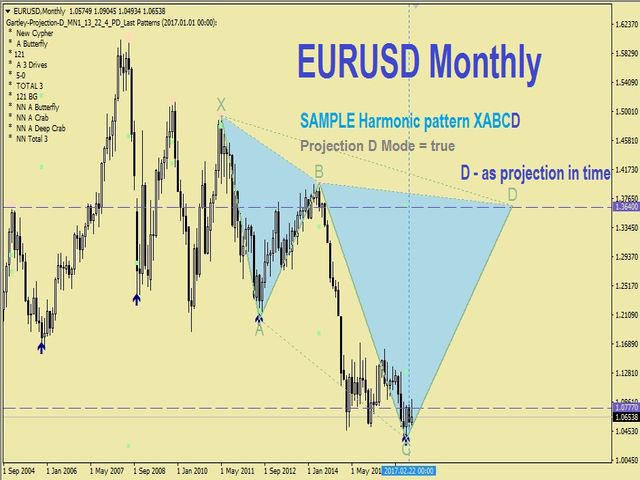
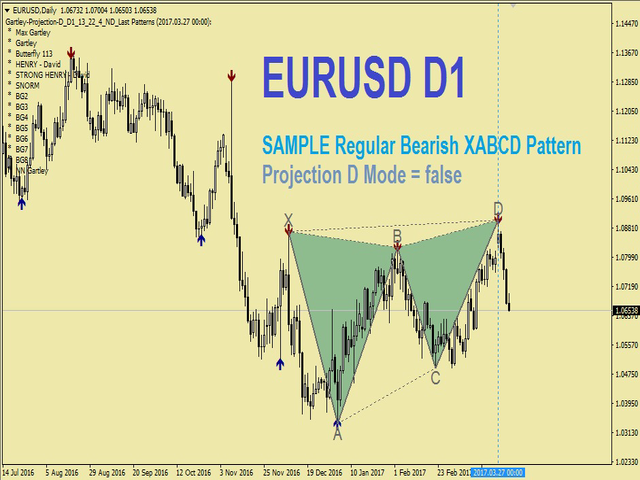
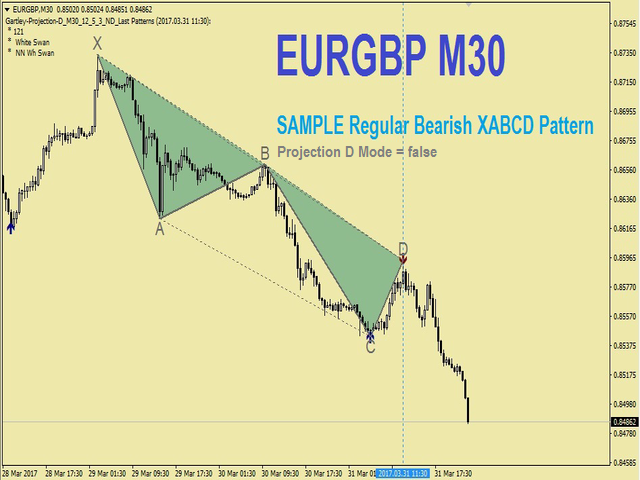
Gösterge, H.M.Gartley'in ("Borsadaki Kârlar", 1935г) gelişmelerine göre harmonik kalıpları (XABCD) tanımlar.
Perspektif projeksiyonunda D noktasını bir nokta olarak yansıtır (ayarlarda ProjectionD_Mode = true değerini belirtin).
Yeniden çizilmez. Çalışma zaman dilimine ait bir çubuk kapandığında, eğer belirlenen formasyon noktası Patterns_Fractal_Bars çubukları sırasında hareket etmediyse grafikte (beklenen fiyat hareketi yönünde) bir ok belirir. Bu andan itibaren ok kalıcı olarak grafikte kalır.
Art arda 2-3 ve daha fazla ok - bu, piyasa koşullarını değiştiriyor, yeniden boyamak/yeniden çizmek DEĞİLDİR (zaman çerçeveleri ileri geri değiştirilmemelidir).
NOT: Art arda 2-3 veya daha fazla ok - bu, yeniden çizim değil, piyasa koşullarını değiştiriyor.
Toplam desen sayısı 85'tir (Gartley-222 ve Gartley-222WS dahil, tam liste Yorumlar bölümünde mevcuttur). Tanımlanan tüm desenler arasında yalnızca en son tanımlanan desen düz renkle doldurulur.
Parametreler
DrawPatterns (doğru/yanlış) - düz renkli bir desen çizin
ProjectionD_Mode (doğru/yanlış) - D noktasını perspektifte bir projeksiyon olarak tanımlama modu
Patterns_Fractal_Bars - oluşturulmuş bir fraktal olarak kabul edilmesi için en son tanımlanan model noktasının sabit kalması gereken çalışma zaman dilimi çubuklarının sayısı (grafikte bir ok görünür)
Patterns_Deviation - bir modeldeki yan oranların referans değerlerinden izin verilen yüzde sapma (izin verilen değer aralığı)
Patterns_XA_MinLength_Bars - XA başlangıç segmentinde izin verilen minimum çubuk sayısı
Patterns_XA_MinHeight_Points - ilk XA segmentinin nokta cinsinden izin verilen minimum boyutu
ZigZag_Depth - ZigZag göstergesinin parametresi
ZigZag_Deviation - ZigZag göstergesinin parametresi
ZigZag_Backstep - ZigZag göstergesinin parametresi
ShowInfo (doğru/yanlış) - tanımlanan modellerin listesini grafiğin sol tarafında görüntüleyin
PrintInfo (doğru/yanlış) - bilgileri günlüğe yazdırır


Updated review: I rented this indicator awhile back but came back to started using it once again because if you really study these patterns use both True and False settings it will allow you to see the whole picture of the particular pair you're trading.........This is just the way i like to use it following the False setting to trade but also using the True setting to be able to calculate my exit area to take profit at........Simply the best out there recommend is 1,000%!!! Thanks for your hard work on this huge winner, Oleksandr!!
Awesome Indicator, Great Work!! Truly no repainting arrows plus nice Gartley patterns respecting prices as far as I can see I can't wait to use it long term but short term I've had it already had a couple of winners following longer 1h,4h time frames THANKS!