Gartley Projection D
- Indicadores
- Oleksandr Medviediev
- Versión: 3.23
- Actualizado: 22 agosto 2017
- Activaciones: 20
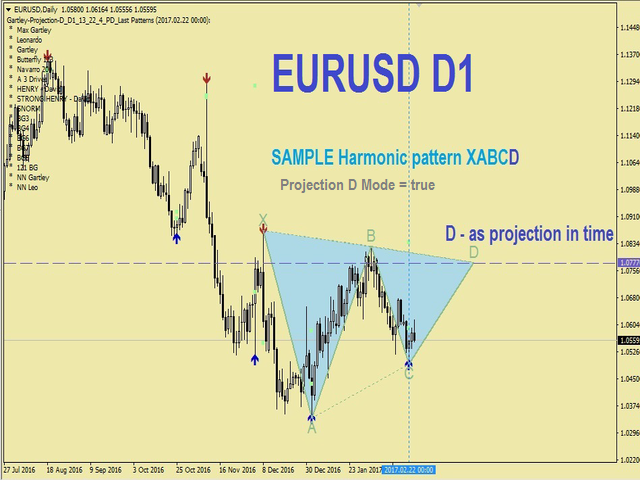
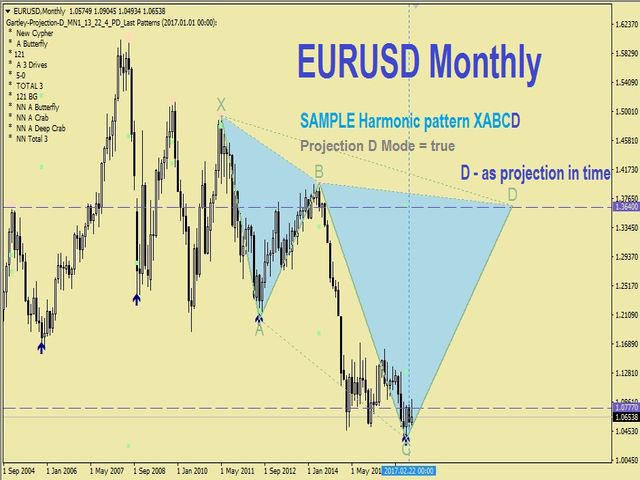
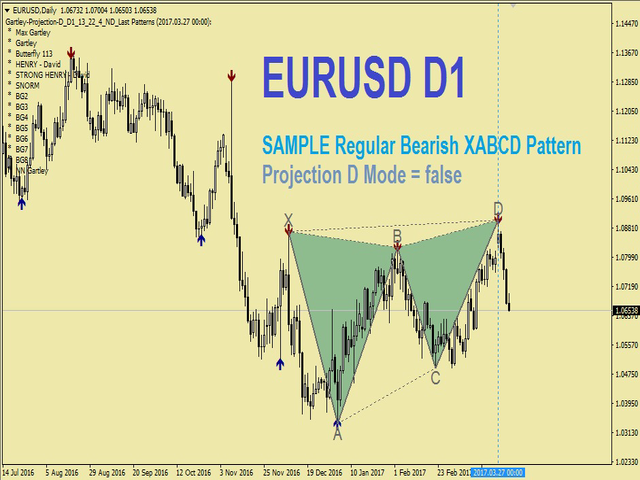
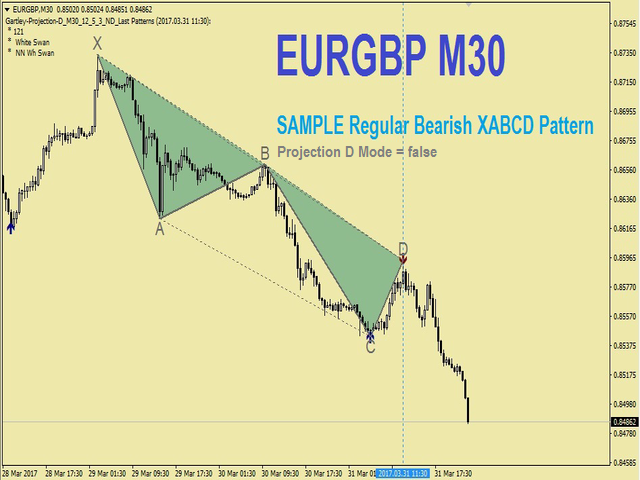
El indicador identifica los patrones armónicos (XABCD) según los desarrollos de H.M.Gartley ("Beneficios en el mercado de valores", 1935г).
Proyecta el punto D como un punto en la proyección en perspectiva (especifique ProjectionD_Mode = true en la configuración).
No vuelve a dibujar. Cuando se cierra una barra del período de trabajo, si el punto del patrón identificado no se ha movido durante las barras Patterns_Fractal_Bars, aparece una flecha en el gráfico (en la dirección del movimiento esperado del precio). A partir de este momento, la flecha permanece permanentemente en el gráfico.
2-3 y más flechas seguidas: esto está cambiando las condiciones del mercado, NO repintar/redibujar (no debe cambiar los marcos de tiempo de un lado a otro).
NOTA: 2-3 flechas o más seguidas: esto cambia las condiciones del mercado, NO vuelve a dibujar.
El número total de patrones es 85 (incluidos Gartley-222 y Gartley-222WS, la lista completa está disponible en la sección Comentarios). Sólo el último patrón identificado se rellena con un color sólido entre todos los patrones identificados.
Parámetros
DrawPatterns (verdadero/falso): dibuja un patrón con un color sólido
ProjectionD_Mode (verdadero/falso): modo para definir el punto D como una proyección en perspectiva
Patterns_Fractal_Bars: el número de barras del período de tiempo de trabajo, durante las cuales el último punto de patrón identificado debe permanecer fijo para que se considere un fractal formado (aparece una flecha en el gráfico).
Patterns_Deviation: desviación porcentual permitida de los valores de referencia de las proporciones laterales en un patrón (rango de valores permitidos)
Patterns_XA_MinLength_Bars: el número mínimo permitido de barras en el segmento inicial XA
Patterns_XA_MinHeight_Points: el tamaño mínimo permitido del segmento inicial XA en puntos
ZigZag_Depth - parámetro del indicador ZigZag
ZigZag_Deviation - parámetro del indicador ZigZag
ZigZag_Backstep - parámetro del indicador ZigZag
ShowInfo (verdadero/falso): muestra la lista de patrones identificados en el lado izquierdo del gráfico
PrintInfo (verdadero/falso): imprime la información en el registro


Updated review: I rented this indicator awhile back but came back to started using it once again because if you really study these patterns use both True and False settings it will allow you to see the whole picture of the particular pair you're trading.........This is just the way i like to use it following the False setting to trade but also using the True setting to be able to calculate my exit area to take profit at........Simply the best out there recommend is 1,000%!!! Thanks for your hard work on this huge winner, Oleksandr!!
Awesome Indicator, Great Work!! Truly no repainting arrows plus nice Gartley patterns respecting prices as far as I can see I can't wait to use it long term but short term I've had it already had a couple of winners following longer 1h,4h time frames THANKS!