MSL Buy Sell Signals

Buy Sell Signals — confirmed signals, entry, stop and three targets on one MT5 chart

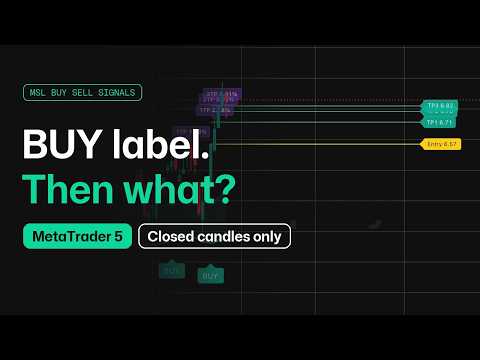
When a candle closes and a BUY or SELL signal is confirmed, Entry, SL and TP1–TP3 appear on the right side of the chart. Buy Sell Signals calculates the levels, marks target touches and shows when the modeled stop has moved to entry. You can follow the setup without drawing the levels by hand after every signal.

How it works on the chart

  1. Wait for confirmation. The indicator checks where the candle closes relative to the adaptive channel boundary and its confirmation buffer. If price crosses the threshold during the candle but moves back before it closes, no signal marker appears.
  2. Review the setup. Entry is the signal candle’s closing price. SL shows the initial stop. The three targets are calculated from the initial risk and stay fixed throughout the setup. The defaults are 0.5R, 1R and 1.5R, where R is the distance from Entry to the initial stop.
  3. Follow the setup. Purple labels mark target touches. If TP1 is touched, the setup remains open and the candle closes on the favorable side of Entry, the modeled stop moves to entry from the next candle. The Entry line turns yellow, the separate SL line disappears, and the dashboard shows BREAKEVEN.

For a SELL setup, the initial stop is above Entry and all three targets are below it. Once the stop moves, the yellow Entry line shows where it now sits. For a BUY setup, the levels are reversed.

How the levels adapt to your chart

The channel’s center line reacts faster to directional moves and more slowly when price moves back and forth in a range. Channel width adjusts to volatility using ATR. The confirmation buffer sets how far beyond the channel boundary price must close to qualify for a signal.

The initial stop is calculated from the opposite channel boundary. When the ATR limit is enabled, the indicator uses the closer of the channel stop and the ATR-based stop. This lets both the signal threshold and target distances adjust to the scale of price movement on your chart.

Dashboard: setup status and target history

The dashboard shows the channel direction (STATE), the last signal, the setup status (Setup) and price change from the modeled entry, measured in the direction of the setup (Move).

The TP1–TP3 rows show how often price touched each target in a sample of closed setups. For example, 76% / 50 in the TP1 row means price touched the first target in 38 of 50 setups. These figures describe target touches; they do not measure win rates or account returns.

Adjust the settings for your instrument and timeframe

Start with the defaults and see how the signal frequency and level distances fit your chart. If signals appear too often, try widening the channel or increasing the confirmation buffer. Target distances and the initial stop limit can be adjusted separately.

  • Rail Source, Efficiency Length, Fast / Slow Response Length — price source and sensitivity of the adaptive center line.
  • Envelope ATR Length / Multiplier — volatility lookback and channel width.
  • Min Flip Distance ATR — extra distance beyond the channel boundary required for signal confirmation.
  • Enable Re-entry After Stop — allows another signal in the same direction after a stop exit if a later candle closes beyond the confirmation threshold while the trend direction still holds.
  • TP1 / TP2 / TP3 Risk/Reward — target distances as multiples of initial risk.
  • SL Buffer ATR, Limit Initial Stop Distance, Protection ATR Length / Initial Stop ATR Multiplier — stop offset beyond the channel and settings for the ATR-based initial stop limit.
  • Closed Trades Sample — 5 to 200 closed setups, with a default of 50.
  • Appearance and alerts — adjust colors, label sizes, projection length and dashboard position. Hide individual chart elements or enable terminal notifications.

Buy Sell Signals calculates and displays levels. You decide whether to enter, where to place your stop and when to close a position.

In the demo, follow one BUY or SELL setup from the signal candle’s close. Watch the five levels appear, then see how the Entry line and dashboard status change if the setup remains open after TP1. It’s a practical way to see how much chart marking the indicator can save you.

Yazarın diğer ürünleri
Crypto Liquidation Radar First, a LIQ event. Then, the price reaction. Direction confirmation is a separate step. After a sharp rise or fall, the main question is: will the move continue, or is the market preparing to reverse? Crypto Liquidation Radar helps you assess this situation on your MetaTrader 5 chart. It highlights unusual price movements with increased volume, shows the strength of each detected event, and marks the confirmed LONG or SHORT direction. Circles draw attention to events. T
PSAR Strategy
Andrei Lukoianov
PSAR Strategy See the trend direction and spot changes on one chart. PSAR Strategy is a trend indicator for MetaTrader 5 that combines Parabolic SAR, an EMA direction filter, and an ADX trend strength filter . Colored dots show the current PSAR state, large circles highlight direction changes, and transparent shading makes the chart easier to read. Alerts can notify you when a direction change meets your selected filter conditions. Clear Chart Display Turquoise dots below price — bullish PSAR st
FREE
Liquidity Zones is a free MetaTrader 5 indicator by MarketStructureLab. It automatically highlights support and resistance zones, counts separate price returns and marks broken zones. The indicator helps you keep important price areas in view and assess how the market reacts to them. Colored zones, compact labels and historical levels make it useful for both beginners and experienced traders with their own analysis methods. Main features Zones based on confirmed price swings. Support zones come
FREE
Friendly Trend is a MetaTrader 5 indicator by MarketStructureLab. It helps you see the trend direction, notice changes in its state and compare conditions across several timeframes. The indicator displays a smooth adaptive line, a colored ribbon and BULLISH / BEARISH labels. A compact dashboard shows the states of four selected timeframes and their combined result. Beginners can use it as a visual guide. Experienced traders can use it as an additional filter within their own analysis process. Wh
FREE
Trend State Signals is a free indicator for MetaTrader 5 by MarketStructureLab. It helps you see the current trend state and notice changes in direction through an adaptive line and BULLISH / BEARISH labels. Use it to assess the market visually or as an additional confirmation tool in your trading strategy. Beginners get a clear guide on the chart. Experienced traders get an adjustable filter for market direction. What you see on the chart Colored line: turquoise shows a bullish filter state, wh
FREE
Trade Master Check the direction before entering. Get an alert when it changes. You have found a level, a pattern, or another area of interest. The next question is: does your idea follow the current market direction or go against it? Trade Master provides a clear visual reference directly on your MetaTrader 5 chart. A green ribbon shows a bullish state, while a red-pink ribbon shows a bearish state. A contrasting marker highlights direction changes, and terminal alerts help you notice them. The
Pr0fit Engine
Andrei Lukoianov
Profit Engine — Signal, Entry, Stop and Three Targets on One Chart A signal appears. Where is the entry? Where should risk be limited? Which targets should you monitor? How does the protective level change as price moves? Profit Engine brings these reference points together in a clear visual trading plan. The indicator shows direction, plots Entry and Stop Loss levels, calculates three Take Profit targets, marks target touches and displays how the setup develops. You do not need to draw every s
Profit Navigator — from confirmed signals to targets and setup tracking on one chart. A LONG or SHORT signal appears. What happens next? Which targets have been reached? Where is the active stop? Are the conditions for reentry in place after an exit? Profit Navigator brings signals, three targets, a dynamic stop and statistics into one clear workflow. You can follow both the signal and the setup’s subsequent development — directly on your MetaTrader 5 chart. Less manual drawing. Less searching f
Smart Trade — confirmed signals, two targets and an active stop on your MT5 chart When a candle closes beyond a confirmed swing level, Smart Trade marks the LONG or SHORT signal and displays Entry, TP1, TP2 and Trail on the right side of the chart. You can see which levels to watch and where the stop currently sits without redrawing the setup after each signal. From signal to exit Signals are confirmed at candle close. Smart Trade checks for a break of the latest confirmed swing high or low. If
Filtrele:
Değerlendirme yok
Değerlendirmeye yanıt