MSL Buy Sell Signals
- Indicators
-
Andrei Lukoianov
 ANDREI LUKOIANOV · MarketStructureLab
Trader since 2008 | Algorithmic trading since 2018
From a trading idea to a clear, systematic approach - Version: 1.0
- Activations: 20
Buy Sell Signals — confirmed signals, entry, stop and three targets on one MT5 chart
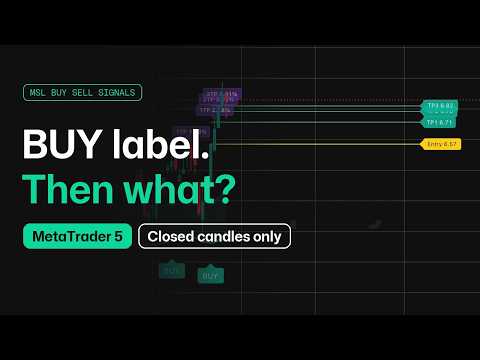
When a candle closes and a BUY or SELL signal is confirmed, Entry, SL and TP1–TP3 appear on the right side of the chart. Buy Sell Signals calculates the levels, marks target touches and shows when the modeled stop has moved to entry. You can follow the setup without drawing the levels by hand after every signal.
How it works on the chart
- Wait for confirmation. The indicator checks where the candle closes relative to the adaptive channel boundary and its confirmation buffer. If price crosses the threshold during the candle but moves back before it closes, no signal marker appears.
- Review the setup. Entry is the signal candle’s closing price. SL shows the initial stop. The three targets are calculated from the initial risk and stay fixed throughout the setup. The defaults are 0.5R, 1R and 1.5R, where R is the distance from Entry to the initial stop.
- Follow the setup. Purple labels mark target touches. If TP1 is touched, the setup remains open and the candle closes on the favorable side of Entry, the modeled stop moves to entry from the next candle. The Entry line turns yellow, the separate SL line disappears, and the dashboard shows BREAKEVEN.
For a SELL setup, the initial stop is above Entry and all three targets are below it. Once the stop moves, the yellow Entry line shows where it now sits. For a BUY setup, the levels are reversed.
How the levels adapt to your chart
The channel’s center line reacts faster to directional moves and more slowly when price moves back and forth in a range. Channel width adjusts to volatility using ATR. The confirmation buffer sets how far beyond the channel boundary price must close to qualify for a signal.
The initial stop is calculated from the opposite channel boundary. When the ATR limit is enabled, the indicator uses the closer of the channel stop and the ATR-based stop. This lets both the signal threshold and target distances adjust to the scale of price movement on your chart.
Dashboard: setup status and target history
The dashboard shows the channel direction (STATE), the last signal, the setup status (Setup) and price change from the modeled entry, measured in the direction of the setup (Move).
The TP1–TP3 rows show how often price touched each target in a sample of closed setups. For example, 76% / 50 in the TP1 row means price touched the first target in 38 of 50 setups. These figures describe target touches; they do not measure win rates or account returns.
Adjust the settings for your instrument and timeframe
Start with the defaults and see how the signal frequency and level distances fit your chart. If signals appear too often, try widening the channel or increasing the confirmation buffer. Target distances and the initial stop limit can be adjusted separately.
- Rail Source, Efficiency Length, Fast / Slow Response Length — price source and sensitivity of the adaptive center line.
- Envelope ATR Length / Multiplier — volatility lookback and channel width.
- Min Flip Distance ATR — extra distance beyond the channel boundary required for signal confirmation.
- Enable Re-entry After Stop — allows another signal in the same direction after a stop exit if a later candle closes beyond the confirmation threshold while the trend direction still holds.
- TP1 / TP2 / TP3 Risk/Reward — target distances as multiples of initial risk.
- SL Buffer ATR, Limit Initial Stop Distance, Protection ATR Length / Initial Stop ATR Multiplier — stop offset beyond the channel and settings for the ATR-based initial stop limit.
- Closed Trades Sample — 5 to 200 closed setups, with a default of 50.
- Appearance and alerts — adjust colors, label sizes, projection length and dashboard position. Hide individual chart elements or enable terminal notifications.
Buy Sell Signals calculates and displays levels. You decide whether to enter, where to place your stop and when to close a position.
In the demo, follow one BUY or SELL setup from the signal candle’s close. Watch the five levels appear, then see how the Entry line and dashboard status change if the setup remains open after TP1. It’s a practical way to see how much chart marking the indicator can save you.