ShapeRadar

ShapeRadar - klasik grafik formasyonu göstergesi

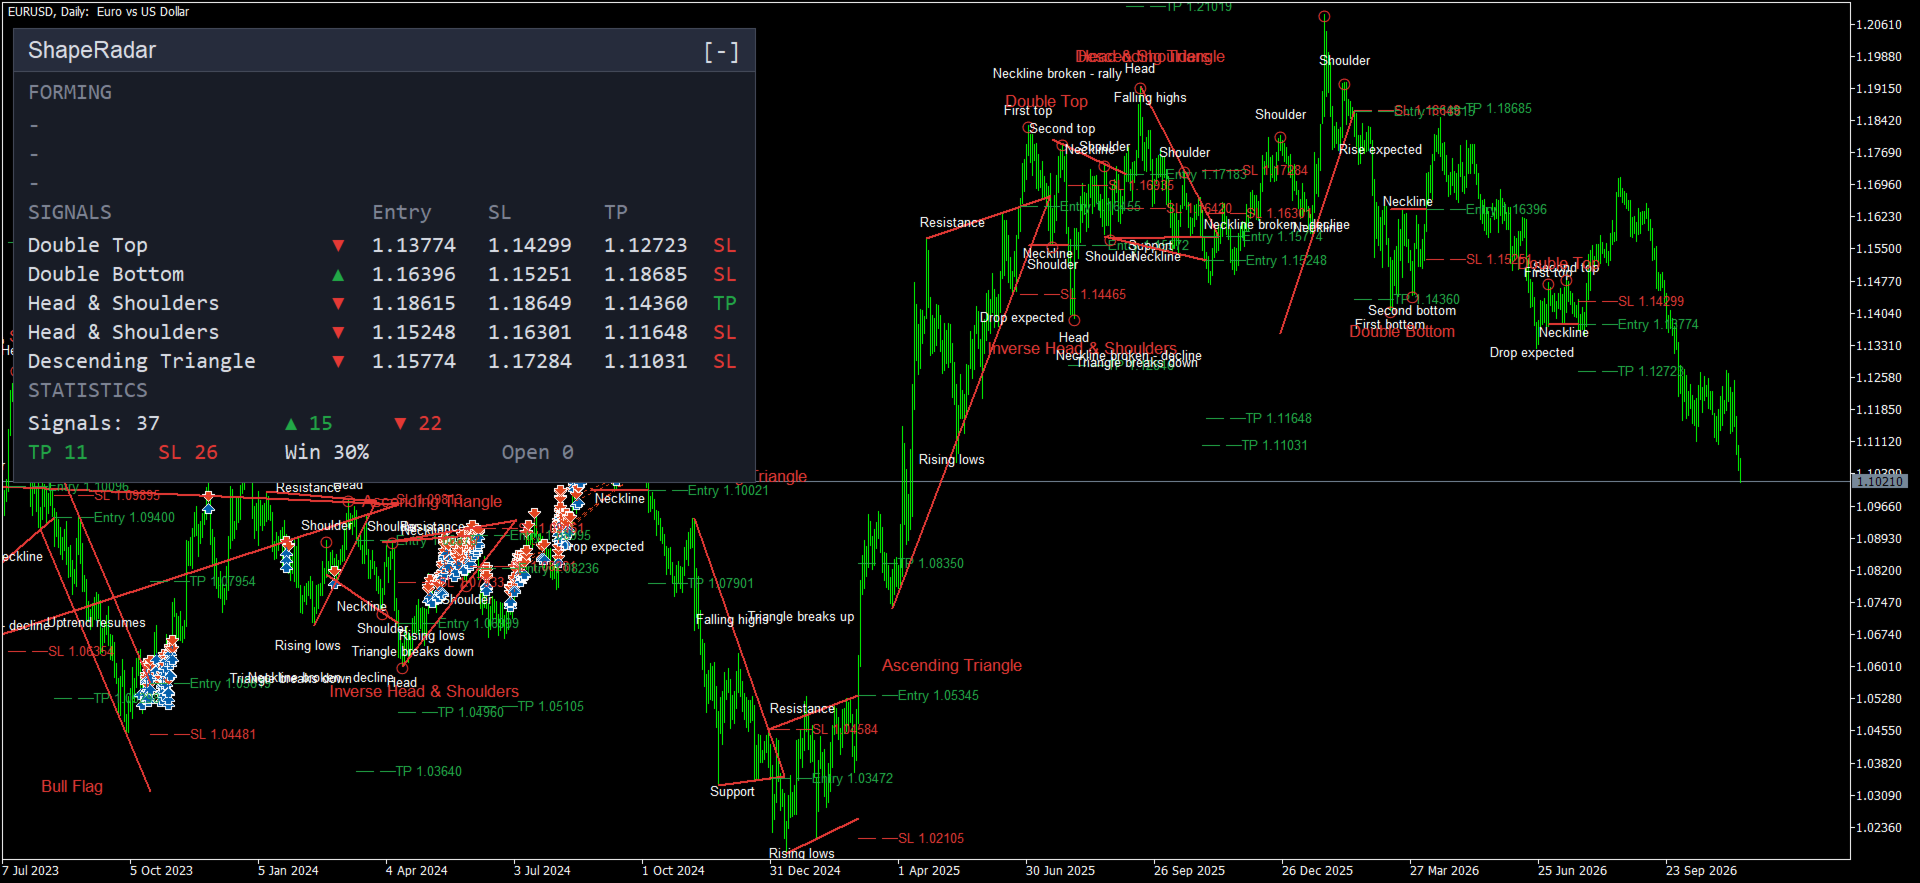
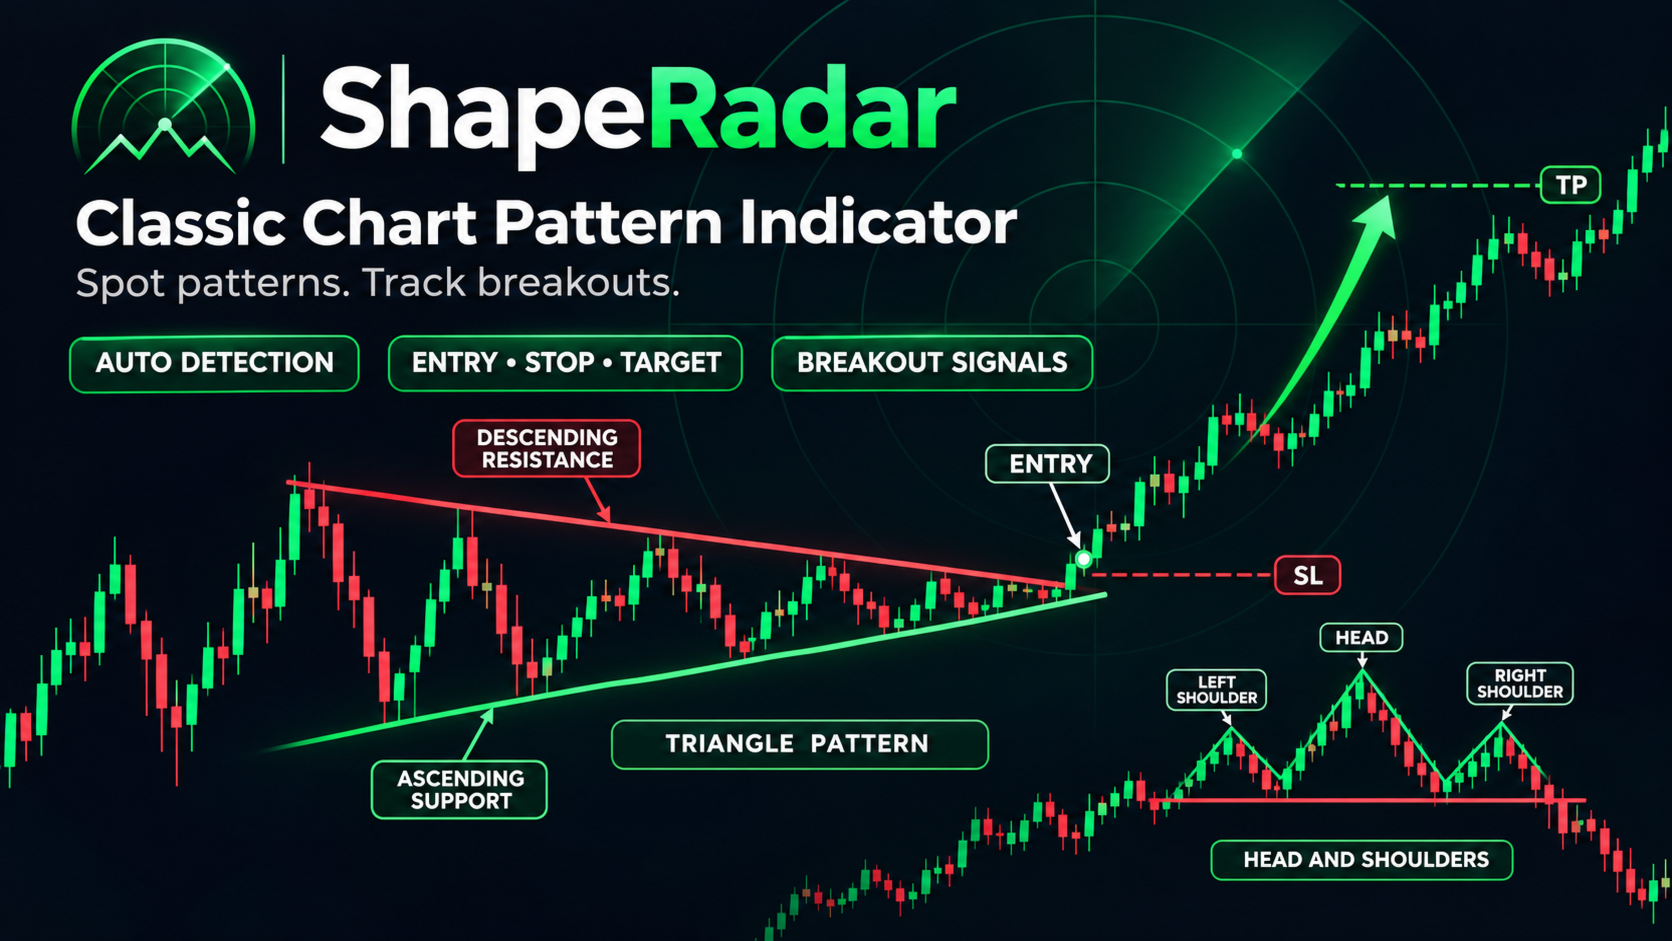
ShapeRadar, teknik analizin klasik formasyonlarını grafik üzerinde otomatik olarak bulur: çift ve üçlü tepe ve dipler, Omuz-Baş-Omuz ve ters versiyonu, yükselen ve alçalan kamalar, dikdörtgenler, üçgenler, bayraklar ve flamalar. Fiyat bir formasyonun sınırının ötesinde kapandığında gösterge formasyonu, giriş noktasını, zarar durdur seviyesini ve hedefi çizer; bilgi paneli de tespit edilen tüm formasyonları özetler.

Gösterge her sembolde ve her zaman diliminde çalışır. Sinyal yalnızca mum kapanışında onaylanır; bu nedenle çizilmiş işaretler kaybolmaz ve mevcut mumda yeniden çizilmez. Grafikte formasyonun nerede olduğu, kırılmanın nerede gerçekleştiği ve giriş, stop ile hedefin nerede durduğu görünür; panel ise her şeyi tek yerde toplar.

Lütfen kanalıma abone olun: https://www.mql5.com/en/channels/algotrader

DİKKAT - HEDİYE! SATIN ALMADAN SONRA LÜTFEN BENİMLE İLETİŞİME GEÇİN, GÖSTERGELERİMDEN İSTEDİĞİNİZİ ÜCRETSİZ ALIN!

Tespit edilen formasyonlar

  • Çift tepe ve çift dip
  • Üçlü tepe ve üçlü dip
  • Omuz-Baş-Omuz ve ters Omuz-Baş-Omuz
  • Yükselen ve alçalan kama
  • Dikdörtgen
  • Simetrik, yükselen ve alçalan üçgen
  • Boğa ve ayı bayrağı
  • Boğa ve ayı flaması

Grafikte neler görürsünüz

  • Formasyon çizgileri: boyun çizgisi veya kama, üçgen, bayrak ya da dikdörtgenin sınırları.
  • Önemli noktalarda (tepeler, dipler, baş, omuzlar) daireler ve etiketler ile beklenen hareketi anlatan bir etiket.
  • Şeklin üstünde veya altında formasyon adı.
  • Entry, SL ve TP seviyeleri, fiyatlarıyla birlikte kısa kesikli çizgiler olarak gösterilir. Hedef formasyonun büyüklüğünden yansıtılır, stop ise formasyonun geometrisine göre yerleştirilir.
  • Tamamlanmış ama henüz kırılmamış formasyonlar için gri kesikli çizgiler (“Forming patterns” ayarı).

Bilgi paneli

Panel varsayılan olarak sol üst köşededir. Fareyle herhangi bir noktasından sürüklenebilir, başlıktaki [-] / [+] düğmesiyle daraltılabilir ve ölçeklenebilir. Konumu ve durumu her grafik için hatırlanır. Panel üç bloktan oluşur.

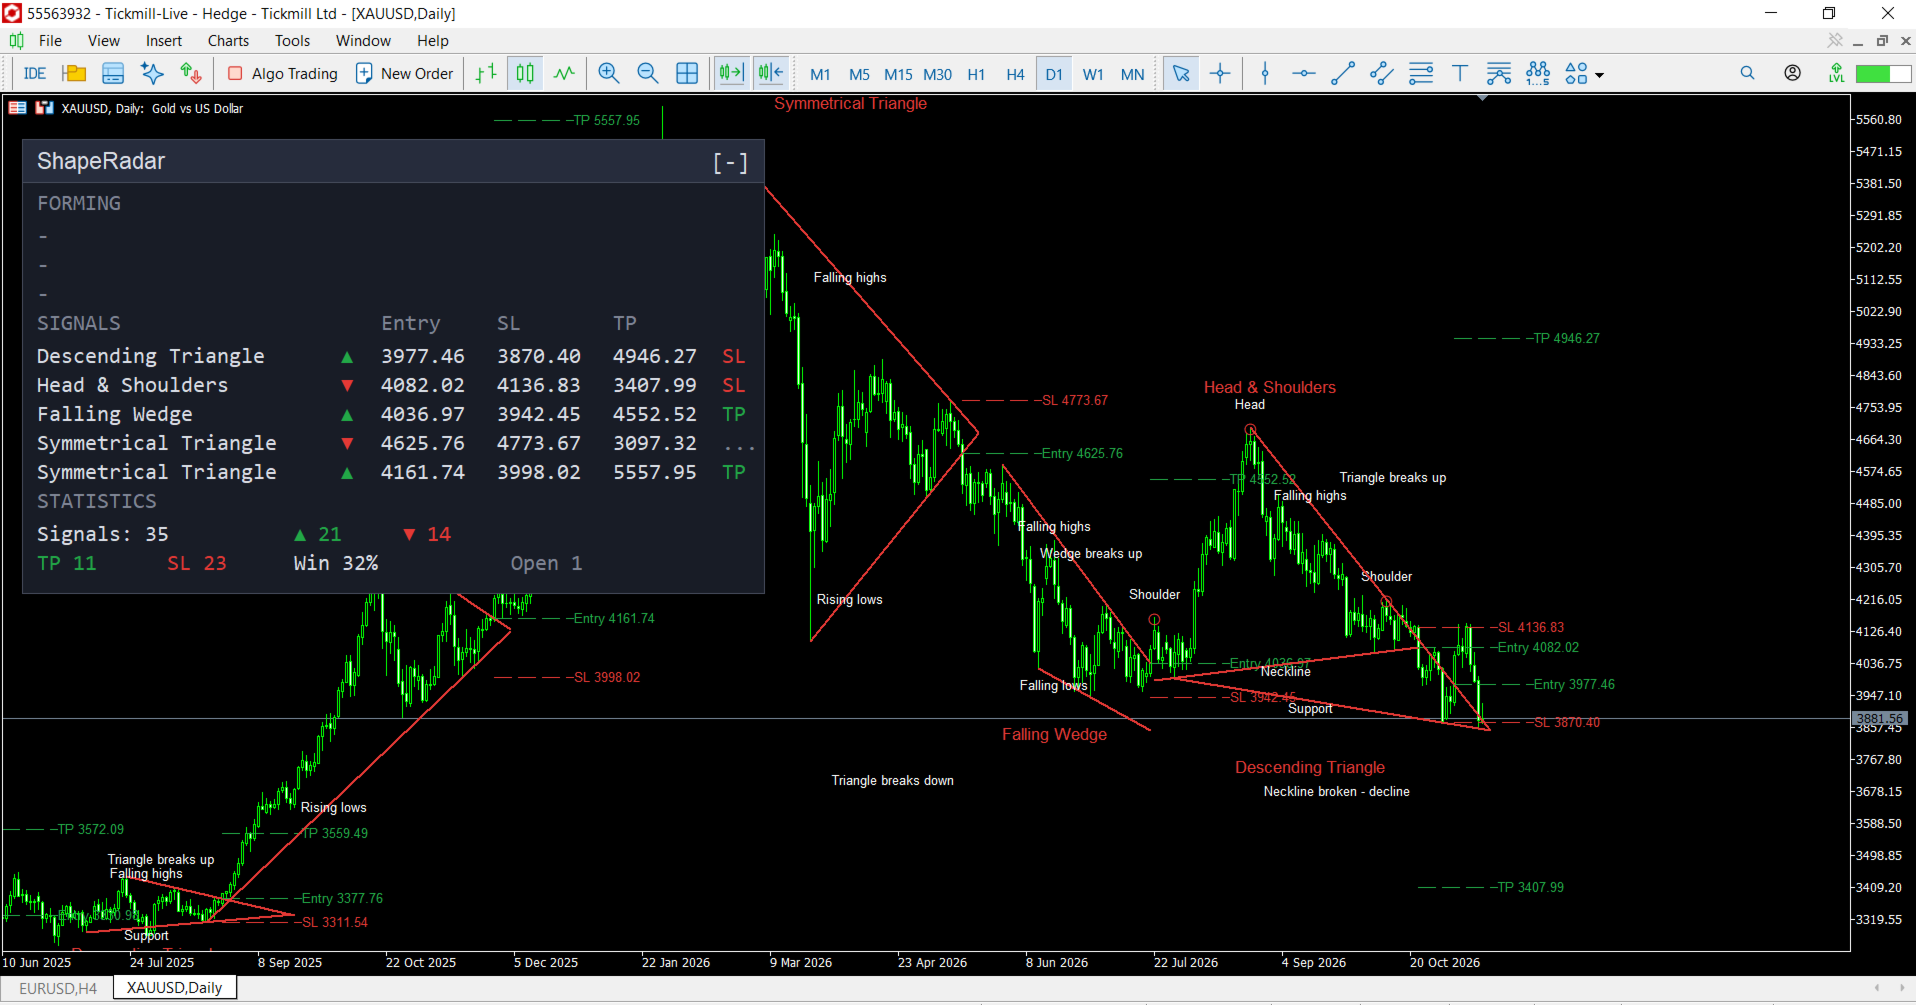
“Forming” (oluşan) bloğu

Grafikte tamamen oluşmuş, ancak fiyatın sınırın ötesinde henüz kapanmadığı formasyonları gösterir. Yani kırılmayı bekleyen formasyonlardır. Her grup için bir tane olmak üzere üç satır vardır: tepelerden dönüşler, diplerden dönüşler ve iki çizgili şekiller (kamalar, üçgenler, dikdörtgen, bayraklar, flamalar). Her satırda şunlar yer alır:

  • tespit edilen formasyonun adı;
  • beklenen yön oku: kırmızı aşağı, yeşil yukarı; iki ok, kırılmanın iki yönde de olabileceği anlamına gelir;
  • “geçen / en fazla mum” biçiminde bekleme sayacı. En büyük değer “Bars to wait for breakout” ile belirlenir.

Ne işe yarar: Erken uyarıdır. Trader formasyonu kırılmadan önce görür ve senaryosunu önceden hazırlayabilir: hangi seviyeyi izleyeceğini bilir, sınır yakınına alarm veya bekleyen emir koyar, girişe ve hedefe olan mesafeyi tahmin eder. Formasyon şu durumlarda bloktan çıkar:

  • fiyat sınırın ötesinde kapandı ve formasyon sinyal oldu (“Signals” bloğuna geçer);
  • formasyon geçersiz oldu: fiyat karşı sınırın ötesinde kapandı;
  • bekleme süresi doldu;
  • formasyon sonuna ulaştı, örneğin üçgenin tepe noktasına;
  • grafik yapısı değişti ve formasyon yeniden oluşturuldu.

Blokta tire görünüyorsa şu anda bekleyen tamamlanmış formasyon yok demektir. Bu normaldir: formasyonlar sürekli ortaya çıkmaz ve çoğu durumda fiyat, formasyon kesin olarak onaylandıktan hemen sonra sınırı kırar; bu durumda formasyon doğrudan “Signals” bloğuna girer.

“Signals” (sinyaller) bloğu

Son 5 sinyal, en yenisi üstte. Sütunlar:

  • formasyon adı;
  • yön oku (yeşil yukarı: alış, kırmızı aşağı: satış);
  • Entry - giriş fiyatı;
  • SL - zarar durdur seviyesi;
  • TP - hedef;
  • sonuç: “TP” - hedefe ulaşıldı, “SL” - stop çalıştı, “...” - sinyal hâlâ açık, “-” - uzun süre ikisine de ulaşılmadı.

Blok, grafikteki sinyali kesin fiyatlarla karşılaştırmanıza ve öncekilerin nasıl bittiğini hızla görmenize olanak tanır.

“Statistics” (istatistik) bloğu

  • Signals - tespit edilen toplam sinyal sayısı; yanında yukarı ve aşağı sinyallerin sayısı.
  • TP - hedefe ulaşan sinyal sayısı.
  • SL - stopla biten sinyal sayısı.
  • Win - sonuçlanan sinyaller arasında hedefe ulaşanların oranı (TP / (TP + SL)).
  • Open - hâlâ açık olan sinyal sayısı.

İstatistikler analiz edilen geçmiş üzerinden hesaplanır ve formasyonların belirli bir sembol ve zaman diliminde nasıl davrandığını değerlendirmenize yardımcı olur. Aynı mumda hem stop hem hedefe dokunulursa stop sayılır. Rakamların sizi tatmin ettiği enstrümanları ve ayarları seçin.

Nasıl kullanılır

  1. Göstergeyi grafiğe ekleyin ve önce varsayılan ayarlarla kullanın.
  2. “Forming” bloğunu izleyin: yakında nerede sinyal çıkabileceğini gösterir.
  3. Sinyalden sonra grafikteki Entry, SL ve TP seviyelerini işlem için referans olarak kullanın.
  4. İnce ayar için gereksiz formasyonları kapatın ve hassasiyeti değiştirin.
  5. Seçtiğiniz enstrümandaki kaliteyi “Statistics” bloğuyla değerlendirin.
  6. Sürekli grafiğe bakmamak için bildirimleri açın.
  7. Expert Advisor’lar 4 gizli tamponu okuyabilir: sinyal kodu (formasyon numarası, işaret yönü gösterir), giriş fiyatı, zarar durdur ve kâr al.

Ayarlar

Detection (tespit)

  • Swing length (bars on each side) - bir tepe veya dibin önemli sayılması için her iki yanında kaç mum olması gerektiği. Küçük değer daha çok formasyon ama daha çok gürültü verir; büyük değer daha az ama daha büyük formasyon verir.
  • Equal highs/lows tolerance, % - çift ve üçlü formasyonlardaki tepelerin veya diplerin ve dikdörtgen sınırlarının birbirinden ne kadar farklı olabileceği, formasyon yüksekliğinin yüzdesi olarak.
  • Shoulder symmetry, % - Omuz-Baş-Omuz’da omuzlar arasında izin verilen fark.
  • Trendline touch tolerance, % - bir noktanın çizgiye ne kadar uzak olabileceği ve yine de temas sayılacağı; aynı tolerans, mum gövdelerinin çizgileri ne kadar kesebileceğini de sınırlar.
  • Flat line tolerance, % - bir çizginin ne kadar eğimli olabileceği ve yine de yatay sayılacağı (dikdörtgen, üçgenler).
  • Parallel / converging, % - çizgilerin paralel (bayraklar) veya yakınsayan (kamalar, üçgenler, flamalar) olması için tolerans.
  • Flag/pennant pole >= x first pullback - bayrak veya flamadan önceki hareketin, formasyon içindeki ilk geri çekilmeden en az kaç kat büyük olması gerektiği. Değer yükseldikçe seçim sıkılaşır.
  • Minimum pattern height (ATR) - ATR cinsinden formasyonun en küçük yüksekliği. Küçük ve önemsiz formasyonları eler.
  • Bars to wait for breakout - formasyon tamamlandıktan sonra kırılma için kaç mum beklenip ardından formasyonun bırakılacağı.
  • Longest pattern (bars) - formasyonun mum cinsinden en büyük uzunluğu.
  • Head & Shoulders target measured from - Omuz-Baş-Omuz hedefinin neye göre hesaplanacağı: Head (baş) veya Shoulder (omuz).
  • History bars to analyze (0 = all) - kaç geçmiş mumun analiz edileceği. Küçük değer daha hızlı yüklenir; 0 tüm geçmiş demektir.

Patterns (formasyonlar)

  • Double Top / Bottom, Triple Top / Bottom, Head & Shoulders (+ inverse), Rising / Falling Wedge, Rectangle, Triangles, Flags, Pennants - ilgili formasyonları açar veya kapatır.

Drawing (çizim)

  • Circles and captions - önemli noktalardaki daireler ve metin etiketleri.
  • Entry / SL / TP levels - giriş, stop ve hedef çizgileri ile etiketleri.
  • Pattern name - grafikte formasyon adı.
  • Forming patterns - kırılmayı bekleyen formasyonlar için gri kesikli çizgiler.
  • Patterns kept on chart - grafikte kaç güncel formasyonun tutulacağı; daha eskileri silinir.
  • Level line length (bars) - Entry / SL / TP çizgilerinin mum cinsinden uzunluğu.
  • Line width - formasyon çizgilerinin kalınlığı.
  • Text size - grafikteki metin boyutu: Small, Normal, Large.
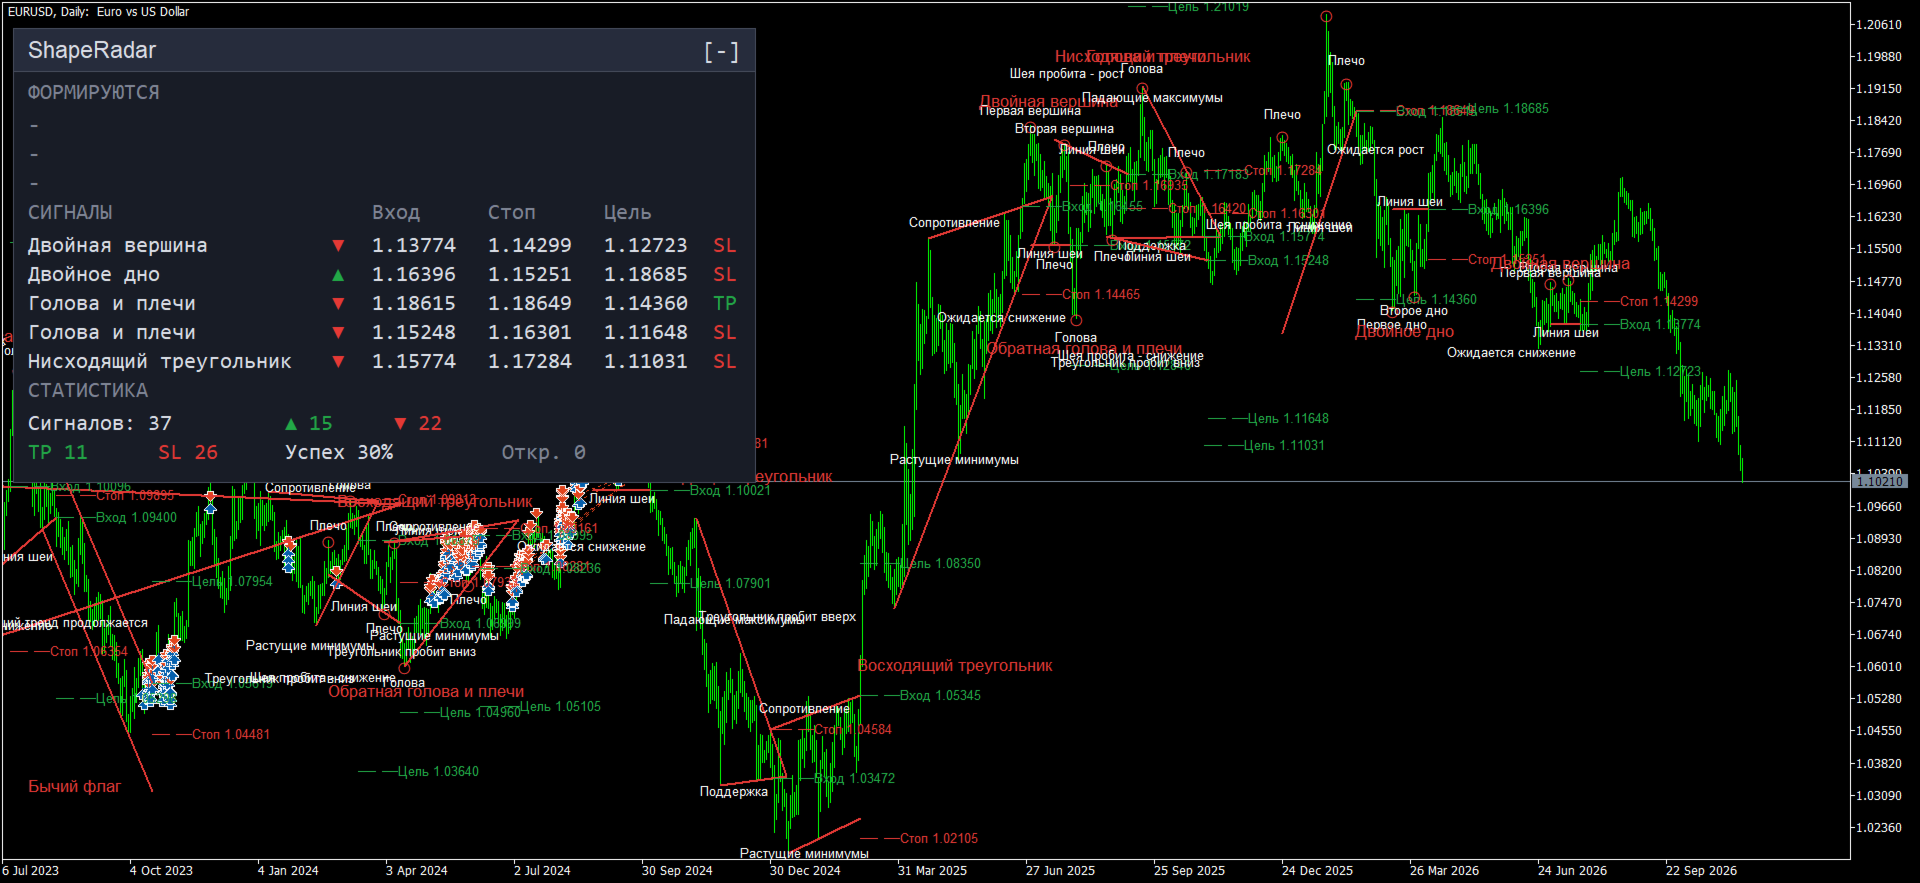
  • Chart text language - grafik etiketlerinin ve panelin dili: English veya Russian.

Alerts (bildirimler)

  • Popup alert, Push notification, Email - yeni sinyalden haberdar olma yöntemleri.

Colors (renkler)

  • Pattern lines - formasyon çizgilerinin ve adının rengi.
  • Entry and TP - giriş, hedef ve alış oklarının rengi.
  • Stop loss - stop ve satış oklarının rengi.
  • Forming patterns - oluşmakta olan formasyon çizgilerinin rengi.

Panel

  • Show panel - paneli gösterir veya gizler.
  • Panel scale, % (0 = adaptive to chart) - panel ölçeği (yüzde). 0 olduğunda panel grafik penceresinin boyutuna göre kendini ayarlar.
  • Panel X offset (from left) ve Panel Y offset (from top) - panelin başlangıç konumu. Varsayılan sol üst köşedir.
  • Panel background, Panel border, Panel text - panel renkleri.
Yazarın diğer ürünleri
Gösterge, en olası trend durdurma/geri dönüş alanlarını, kendinden emin trend hareket alanlarını hesaplar. Hesaplama şunları dikkate alır: fiyat değişim oranı; grafiğin göreli sapma açısı; fiyat hareketlerinin ortalama genliği; "konfor bölgesini" terk eden fiyat; ATR göstergesinin değerleri. Gösterge, fiyat bir durdurma/geri dönüş alanına girdiğinde bir Uyarı oluşturabilir. Ayarlar Tüm uzunluğu çiz? - grafiğin sonuna kadar alanları çizin; YUKARI trendi durdur - bir yükseliş trendinin durma/ge
Gösterge, piyasanın şu anda hangi durumda olduğunu gösterir: yükseliş trendi, düşüş trendi veya yatay seyir. Durum, doğrudan fiyat grafiği üzerinde renkli bir bölge olarak vurgulanır ve bilgi panelinde de tekrar gösterilir. MT5 version:   https://www.mql5.com/en/market/product/70409 Grafik nasıl okunur Turkuaz bölge — yükseliş trendi. Kırmızı bölge — düşüş trendi. Gri-mavi bölge — yatay seyir. Bölge iki çizgiyle sınırlanır. Kalın çizgi yavaş, ince çizgi hızlı çizgidir. İkisi de piyasa durumuyla
SuperTrend
Evgeniy Zhdan
2.5 (2)
The Supertrend Expert Advisor The Supertrend Expert Advisor with averaging elements. It has been developed during three months until I finally got good results. It is not a scalper. The minimum balance to start trading - 100 $. Is automatically adjusted to the 4 and 5-digit prices. Has an efficient risk management system. The lot and limit on the maximum lot is automatically calculated based on the settings specified in the EA. As a result, you have a complete automated trading system. Download
Stardust
Evgeniy Zhdan
StarDust searches for divergences in the values of several indicators considering them as signs of flat and enters the market if a relatively steady trend is detected. The Expert Advisor trades "basic" symbols with a low spread. The best results are achieved on М15. The EA automatically adjusts to 4 and 5-digit quote flows. Settings Comment_to_orders – comment to a placed order. The field can be left blank if no comment is required. MM – enable money management with automatic setting of a worki
Top Floor
Evgeniy Zhdan
The EA catches the price when it moves against the trend in an effort to open an order in an opposite direction (direction of the main trend). Screenshots illustrate examples of entries and the strategy gist. The EA uses stop losses depending on values of ATR. Settings: Lot_ - if Risk_ = 0, the EA will trade this lot; Risk_ - risk per one trade. Stop loss is taken into account; koeff_ATR - coefficient multiplied by the ATR value to calculate stop loss (the bigger the value, the bigger stop loss
FastBoom
Evgeniy Zhdan
The FastBoom EA finds the most probable points of price pullback/reverse and places an order. It places averaging orders if the price moves further against take profit. Settings of the EA: Lots - initial lot; LotExponent - multiplier for following orders (Martingale). 1 - no multiplier. TakeProfit - take profit in points; Stochastic Settings InpKPeriod - K Period of Stochastic InpDPeriod - D Period of Stochastic InpSlowing - Stochastic Slowing LevHigh - level for sell positions of Stochastic L
The Expert Advisor calculates the double/triple divergence of volumes, and starts trading. It uses a unique formula of lot calculation, which greatly improves stability of trading. Recommended TF - 1h. Currency pair - EURUSD , but the EA can be used on any trading instruments which are not subject to high volatility. Settings mode - trading direction can be set manually; close - order close level (details on the screenshot); Step between orders - step between orders in points; Maximum orders -
OrderOnLine
Evgeniy Zhdan
The Expert Advisor opens orders from the horizontal line, the a trader can set on any level by dragging using the mouse or by changing the line properties. For example, when a horizontal line is above the current price, the EA will open a Buy order once the horizontal line is reached. And vice versa: If the line is below the current price, the EA will open a sell order once the line is crossed. A buy crossover of the line is: opening of the current candlestick below the horizontal line; the curr
SellerATR
Evgeniy Zhdan
5 (1)
The Expert Advisor only sells. Recommended currency pairs : EURUSD; GBPUSD; USDCHF; USDJPY; USDCAD; AUDUSD; EURGBP; EURAUD; EURCHF; EURJPY; GBPCHF; CADJPY; GBPJPY; AUDNZD; AUDCAD; AUDCHF; AUDJPY; CHFJPY; EURNZD; EURCAD; CADCHF; NZDJPY; NZDUSD. Timeframe: H1. Percent% manages closing both loss-making and profitable deals based on the account overall status. Using the EA on 23 symbols mentioned above allows the robot to cope with the drawdown in case of a long trend. While positions on some pairs
Illusion
Evgeniy Zhdan
3 (2)
The Illusion EA uses the probability theory - after a series of consecutive virtual losses - i.e. right during a flat the EA already starts trading in the trend. In addition, the EA considers the ratio of bullish/bearish candles on the higher timeframes to determine the greatest probability of the price movement direction. Only 1 order can be opened at a time. In case of a loss the following order will be placed with an increased lot (the multiplication coefficient is set in the parameters). The
The indicator plots a trend line and determines the levels for opening trades, in case the price goes "too far" away from the trend level. More detailed information is available in the screenshots. Settings Away from the trend line - distance from the trend line to the trades level; Arrow Signal for deals - enable displaying an arrow when the price reaches the trades level; Size of Arrow - size of the arrow; Alert Signal for deals - enable generating alerts when the price reaches the trades lev
Turbina
Evgeniy Zhdan
5 (4)
The axiom of the Forex market is that any trend will be broken. The Expert Advisor determines trend direction (the pink line), and calculates levels for opening opposite orders depending on the settings. The value of Away from the trend line for Deal will be different for each pair and timeframe, depending on the volatility of the trading instrument. Next orders can be opened with an increased lot (a static lot is used by default). See the screenshots to understand the idea of the Expert Advisor
Odysseus
Evgeniy Zhdan
The Expert Advisor determines the moments of strong movements and opens a position in the direction of the most probable price movement. The strategy always uses stop loss and take profit. Several independent orders can be in the market (the maximum number is set in parameters). The goal of the EA's underlying trading system is the quantitative excess of the number of profitable deals over the number of losing ones. Recommended: EURUSD 5m; GBPUSD 5m; USDJPY 5m. The Expert Advisor is able to work
Vise
Evgeniy Zhdan
Vise is a trend indicator. The upper and lower lines follow the price showing the prevailing price direction. Frequent breakthroughs of the upper line indicate a bullish trend, while frequent breakthroughs of the lower line indicate a bearish one. Parameters Points for UpLine - initial number of points for the upper line; Points for DownLine - initial number of points for the lower line. During the breakthrough of the upper level (line), this level shifts upwards by Points for UpLine. If the up
Twinkle
Evgeniy Zhdan
Twinkle is a trend-based scalper using stop loss and take profit invisible to the broker. The EA does not look for trend reversals. The EA catches strong market movements and opens orders in the direction of the trend. Your broker will not see the order closing levels. The EA closes orders independently when reaching the take profit or stop loss levels specified in the settings. Recommended trading symbols: EURUSD M5, GBPUSD M5. ECN accounts with 5 digits quotes are recommended. Expert Advisor
Shine
Evgeniy Zhdan
4.75 (4)
This Expert Advisor implements elements of the Martingale system. Orders are opened at a specified distance from the moving average. The Parabolic SAR indicator and certain technical details are used to ensure the most accurate entries. The EA is highly customizable. It is recommended for simultaneous use on 4 currency pairs: EURUSD M15; GBPUSD M15; USDJPY M15; USDCAD M15. Despite good stability, it is advisable to disable the EA operation during the days rich in news releases. Configurations P
LuckyCase
Evgeniy Zhdan
LuckyCase is an Expert Advisor with martingale elements. The EA strategy is based on a significant "deviation" of the price from SAR inadicator and the Bands levels breakthrough point. The money management system is an essential part of the EA. It starts working after a trade is opened. Trades are closed after accumulating specified points of market orders, by deposit % or after an opposite side of the channel is broken through. The default EA settings are meant for: EURUSD M15; USDJPY M15. The
Elize
Evgeniy Zhdan
The Elize Expert Advisor has been designed to work with the EURCHF currency pair. It considers the peculiarities of this trading instrument, its behavior and dependence on the behavior of other currencies. In particular, when the currencies of the European countries (EURUSD, GBPUSD, EURNOK, EURCHF) move in the same direction, the EA starts its operation and opens a deal in the trend direction of the European currencies. In the event of price rollbacks, the EA uses a unique method for making the
AllTrendLines
Evgeniy Zhdan
4 (1)
Brief Description of the All Trend Lines Indicator The indicator analyzes the wave structure of the market. What it displays on the chart: First. Wave pivots (semaphores) • Red markers – wave highs • Yellow markers – wave lows • Yellow-green markers – additional local extremes Second. Trend lines • Purple/blue lines – trends based on highs (resistance/support) • Beige/green lines – trends based on lows • Lines are built automatically by connecting wave pivots of the same type Third. Main trend
FastTraffic
Evgeniy Zhdan
The Expert Advisor has been specifically developed for trading gold (Spot Gold). The strategy is based on Fibo levels calculated from the previous (first) candle High/Low and the width of the current and lower timeframes channel. If important Fibo levels of different orders are located in a single price channel (within a spread), the EA defines this channel as the target for price movement and starts operation. Martingale and averaging are not used. Each order is independent and is accompanied b
Jazz
Evgeniy Zhdan
The algorithm of this Expert Advisor determines the significant price levels, where the trend often turns into a flat or reverses. Stochastic Oscillator serves as an additional filter of overbought/oversold zones. The EA sets stop loss and take profit after opening an order. The underlying trailing strategy applies a trailing stop. The EA is recommended for simultaneously use on three trading instruments: EURUSD M5, GBPUSD M5, EURCHF M5. Settings: Comment to order - comment to orders. MaxRisk -
Panther
Evgeniy Zhdan
The Expert Advisor looks for technical analysis patterns formed on the higher (hourly) timeframe to start working on the 5-minute chart. Technical analysis patterns used: double top/double bottom, head/shoulders, flag, expanding/narrowing triangles. The Relative Vigor Index technical indicator is used as the filter for opening deals. It is based on the idea that on the bull market the closing price is, as a rule, higher, than the opening price. It is the other way round on the bear market. This
Spook
Evgeniy Zhdan
The Expert Advisor calculates the divergence on the current and higher timeframes. In case the divergences coincide, the EA starts its operation. Deals have strict take profit and stop loss levels. Each deal is managed by trailing stop. The strategy involves the use of a tight stop-loss. Therefore, losing deals and/or series of losing deals are not uncommon. This EA is not suitable for those who have difficulties coping with losing deals. The EA is recommended for simultaneous use on the followi
Intensive
Evgeniy Zhdan
The Expert Advisor algorithm determines on daily charts those candlestick patterns, which set the intraday trading direction. The trading EA determines how long the price is moving in overbought/oversold zones and starts working in the direction of the expected trend movement. Each position is accompanied with a tight stop loss and take profit. Only one active position can be open in the market. The EA was developed and tested using 99% quality quotes. The Expert Advisor has a built-in news filt
Slender
Evgeniy Zhdan
The strategy of this Expert Advisor is based on a hedging system, which implies placing opposite orders. The EA algorithm determines trend beginning and opens a position in the trend direction. In case of a wrong entry, the EA tries to neutralize the drawdown through opposite (hedging) orders at a preset interval (Coefficient of counter orders). Orders are closed when one of the two values ​​is reached - profit in percent or profit in points. The EA does not use lot increase. The EA wast tested
Dreamer
Evgeniy Zhdan
Советник работает по принципу хеджирования с периодическими "перекосами" в сторону трендовых направлений. Направления тренда советник определяет на основании стандартного индикатора Parabolic Stop and Reverse system (SAR). Уникальная стратегия установки балансирующих позиций позволяет избегать больших просадок даже при самых не благоприятных рыночных условиях. Параметры по умолчанию рекомендуется использовать на торговом инструменте: GBPJPY 15m. Разработка и оптимизация параметров производились
Snoot
Evgeniy Zhdan
5 (1)
This Expert Advisor works using a grid in the direction of a trend movement with the step between opened positions defined in the settings. The positions are closed by the total take profit. The Parabolic SAR standard indicator is used to filter order opening, which comes in the MetaTrader 4 package. The EA has been developed and tested using 99,9% quality of quotes. Operation of the EA in real time can be viewed in the signals . The best trading results have been achieved on CHFJPY M15. Settin
Solipsism
Evgeniy Zhdan
The Expert Advisor builds channels based on the data obtained using ATR and MA indicators according to the equations: Upper channel border = MA + ATR * (FIBO); Lower channel border = MA - ATR * (FIBO), where FIBO has the following values: Style of Trade - Aggressive = 1.61852; Style of Trade - Average = 3.26704; Style of Trade - Calm = 4.85556. Trades are opened inside the channel with the intervals defined in the settings. Long and short positions are opened independently. Positions are closed
The trading statistics indicator notifies the trader of the aggregate income of the trading account for different time intervals. The indicator has wide display settings on the graph. There is a choice of one of the two display languages on the chart- English and Russian. Settings Indicator language (ENG, RUS) - Select the language to display on the chart; To control the magic (-1: any magic) - Entering the Magic for control (-1: any Magic); Angle of indicator tie - Selecting the angle of the c
Vegor
Evgeniy Zhdan
The advisor works on the basis of a strategy for determining the calm and volatile market conditions, as well as the phases of redistribution of trading activity. In moments of increased volatility, the adviser analyzes similar price behavior (patterns) in the recent past, and if matches are found (the number of matches is configured by the user in the Strategy Accuracy parameter), the advisor decides to start trading. Advisor does not use dangerous trading strategies based on lot increase and
Filtrele:
Değerlendirme yok
Değerlendirmeye yanıt