NeonWallpaper
- Göstergeler
- Sürüm: 1.0
- Etkinleştirmeler: 15

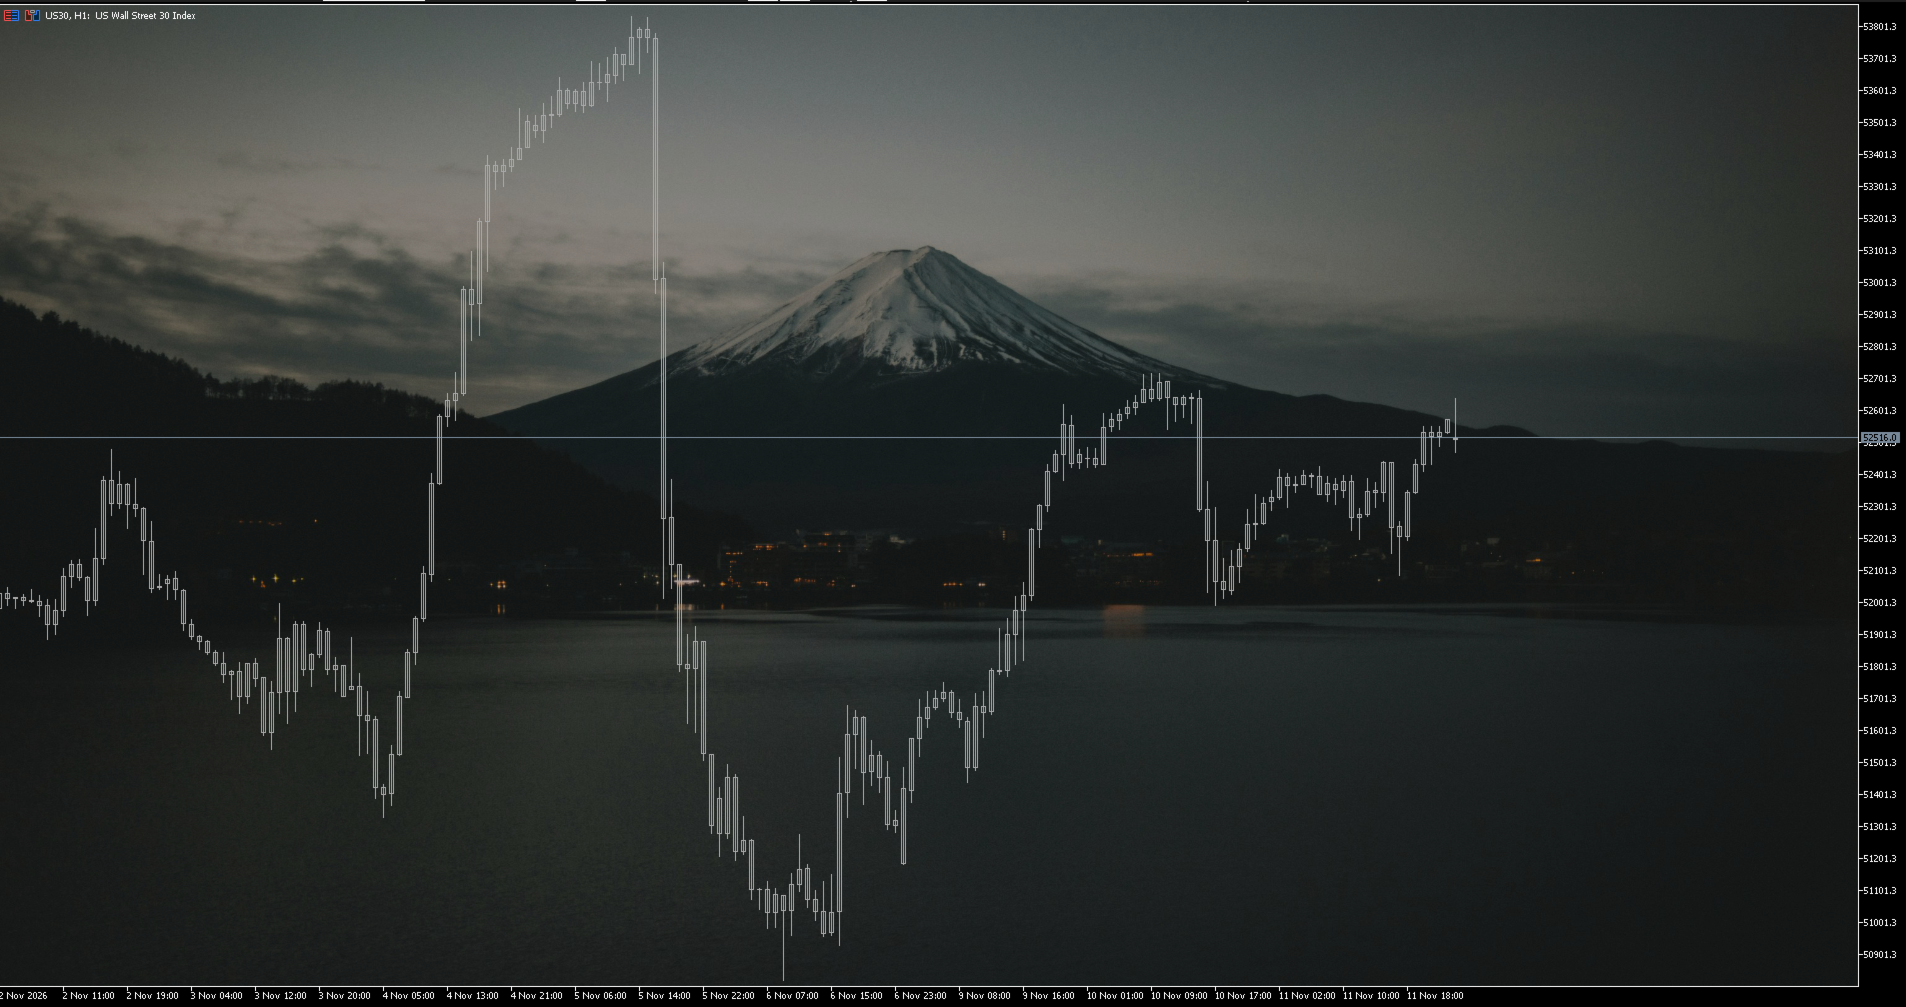
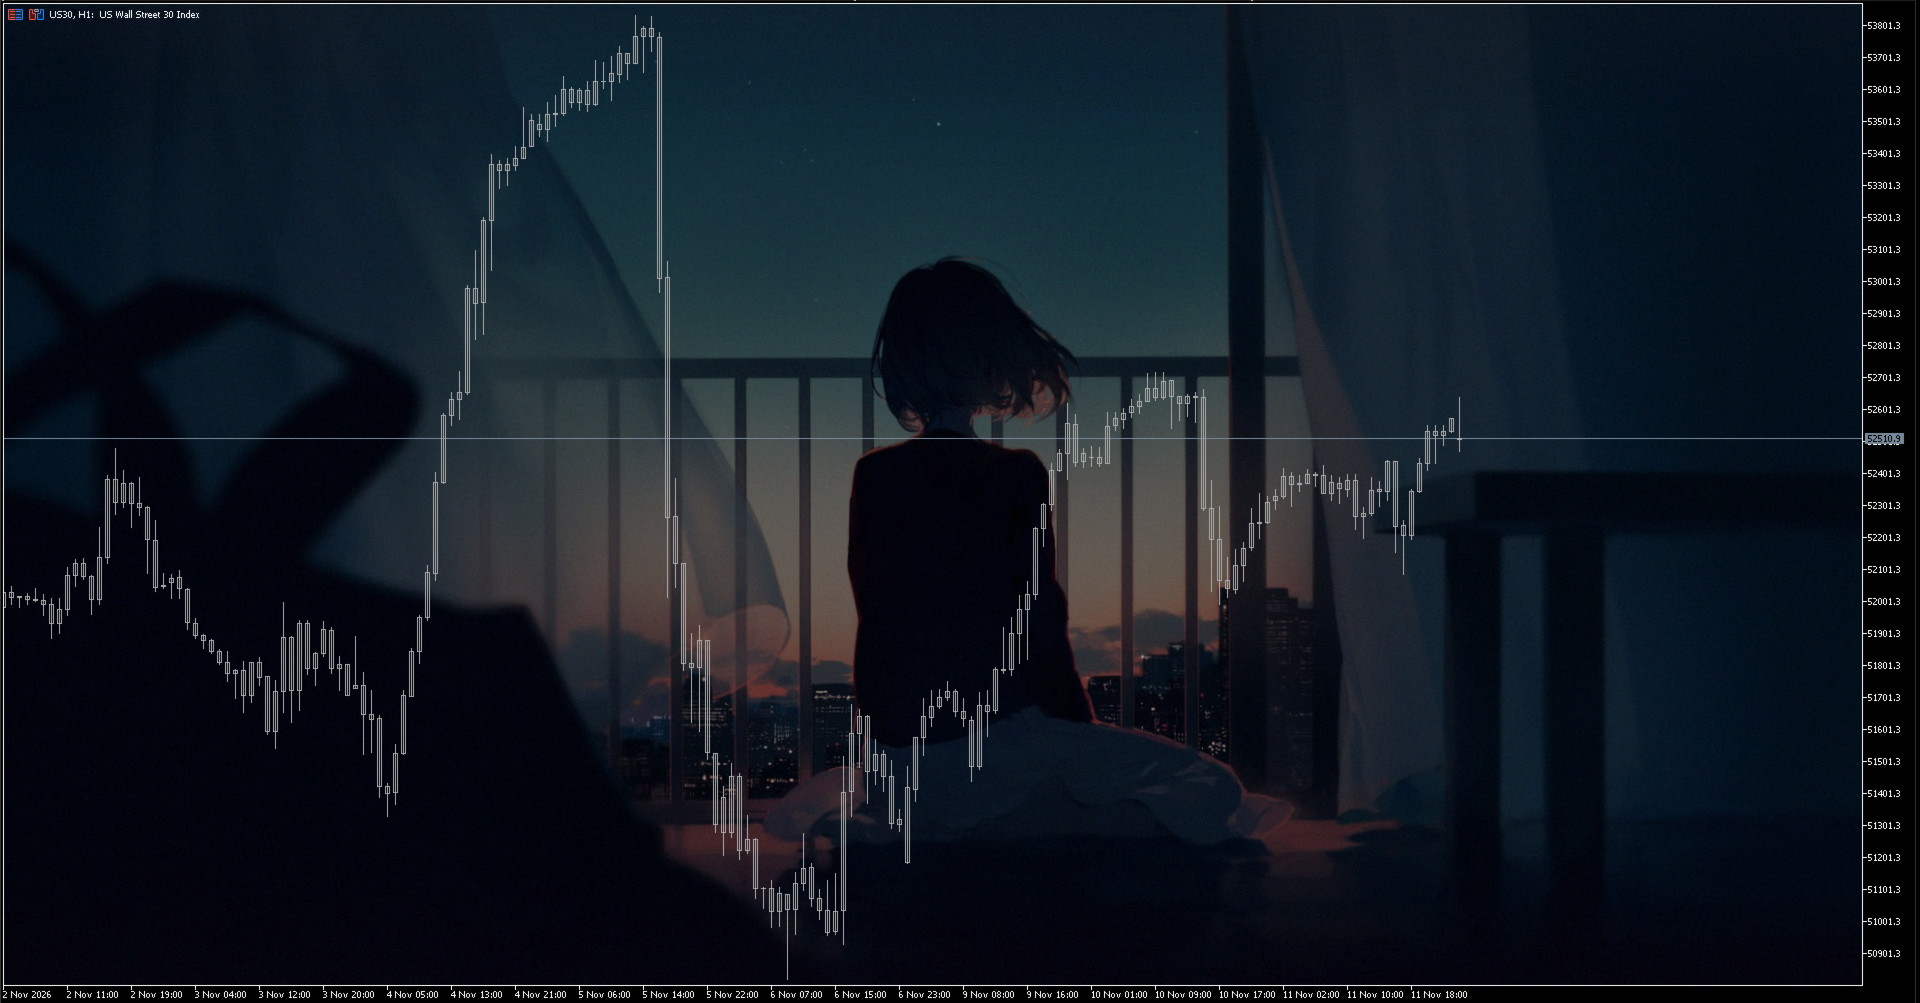
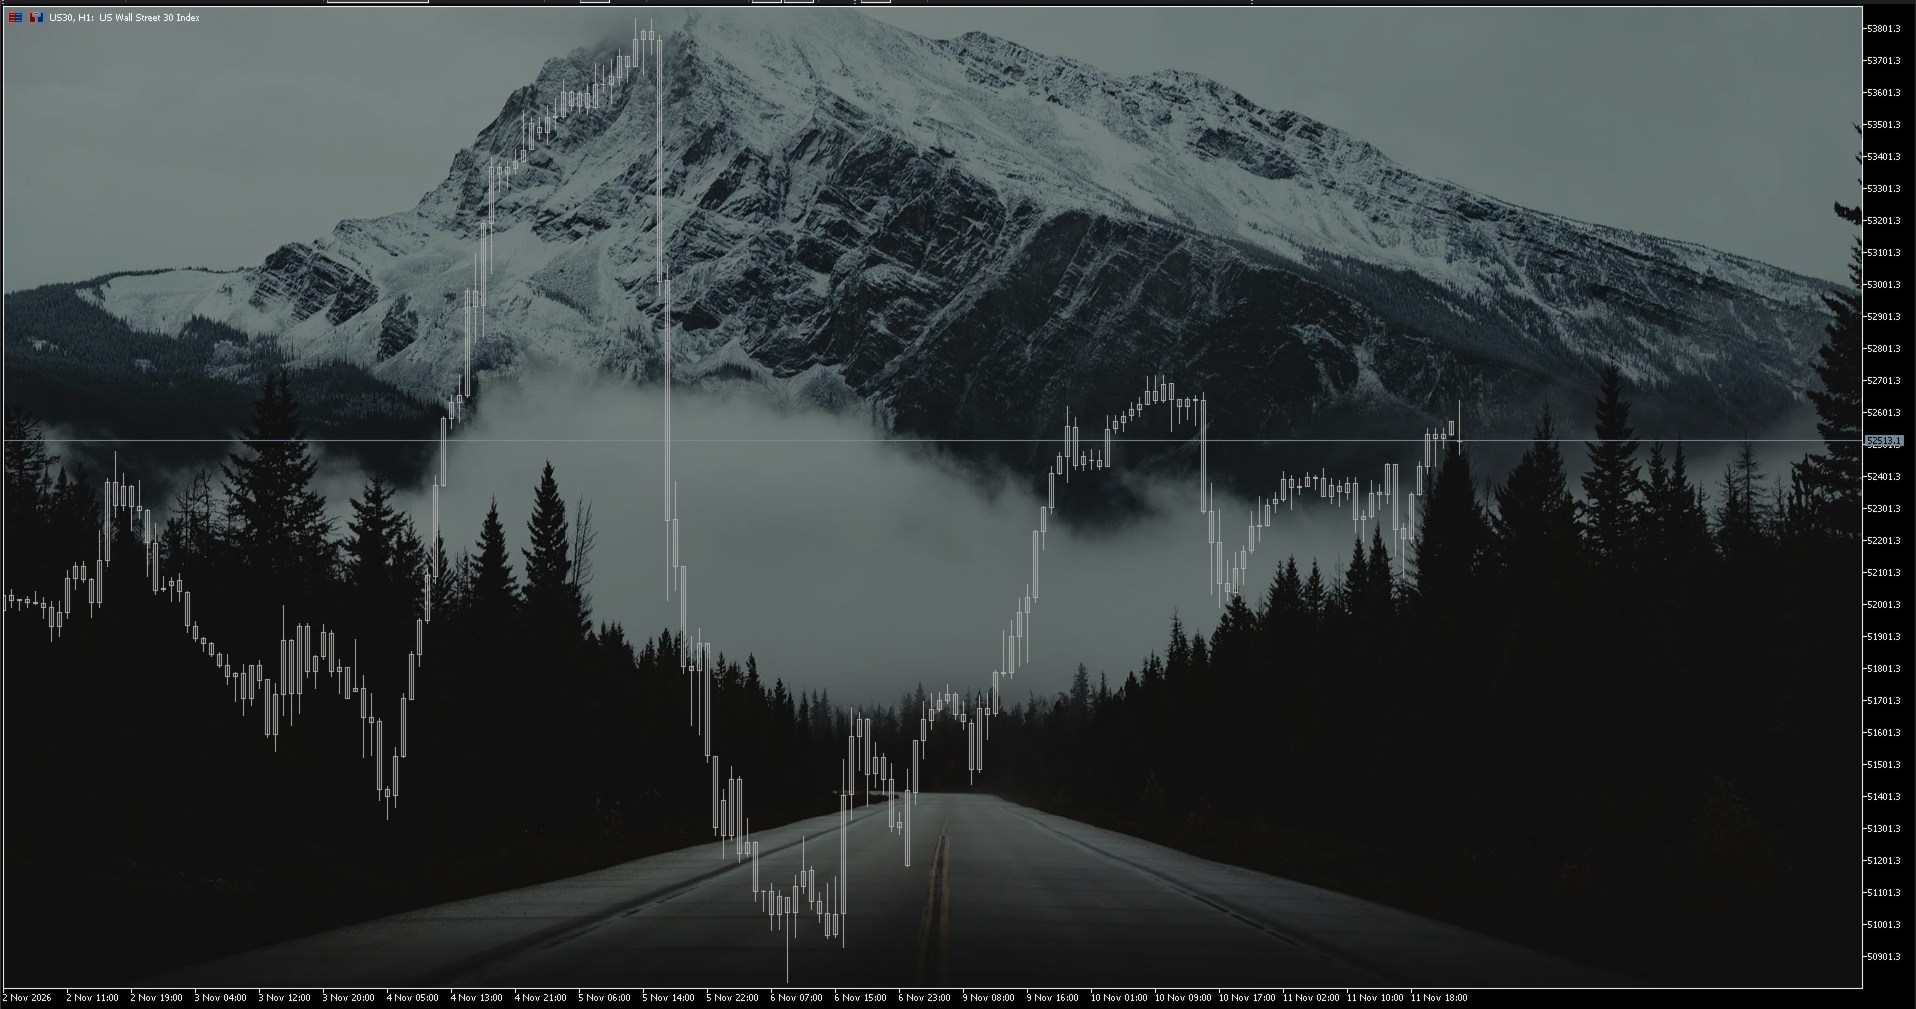
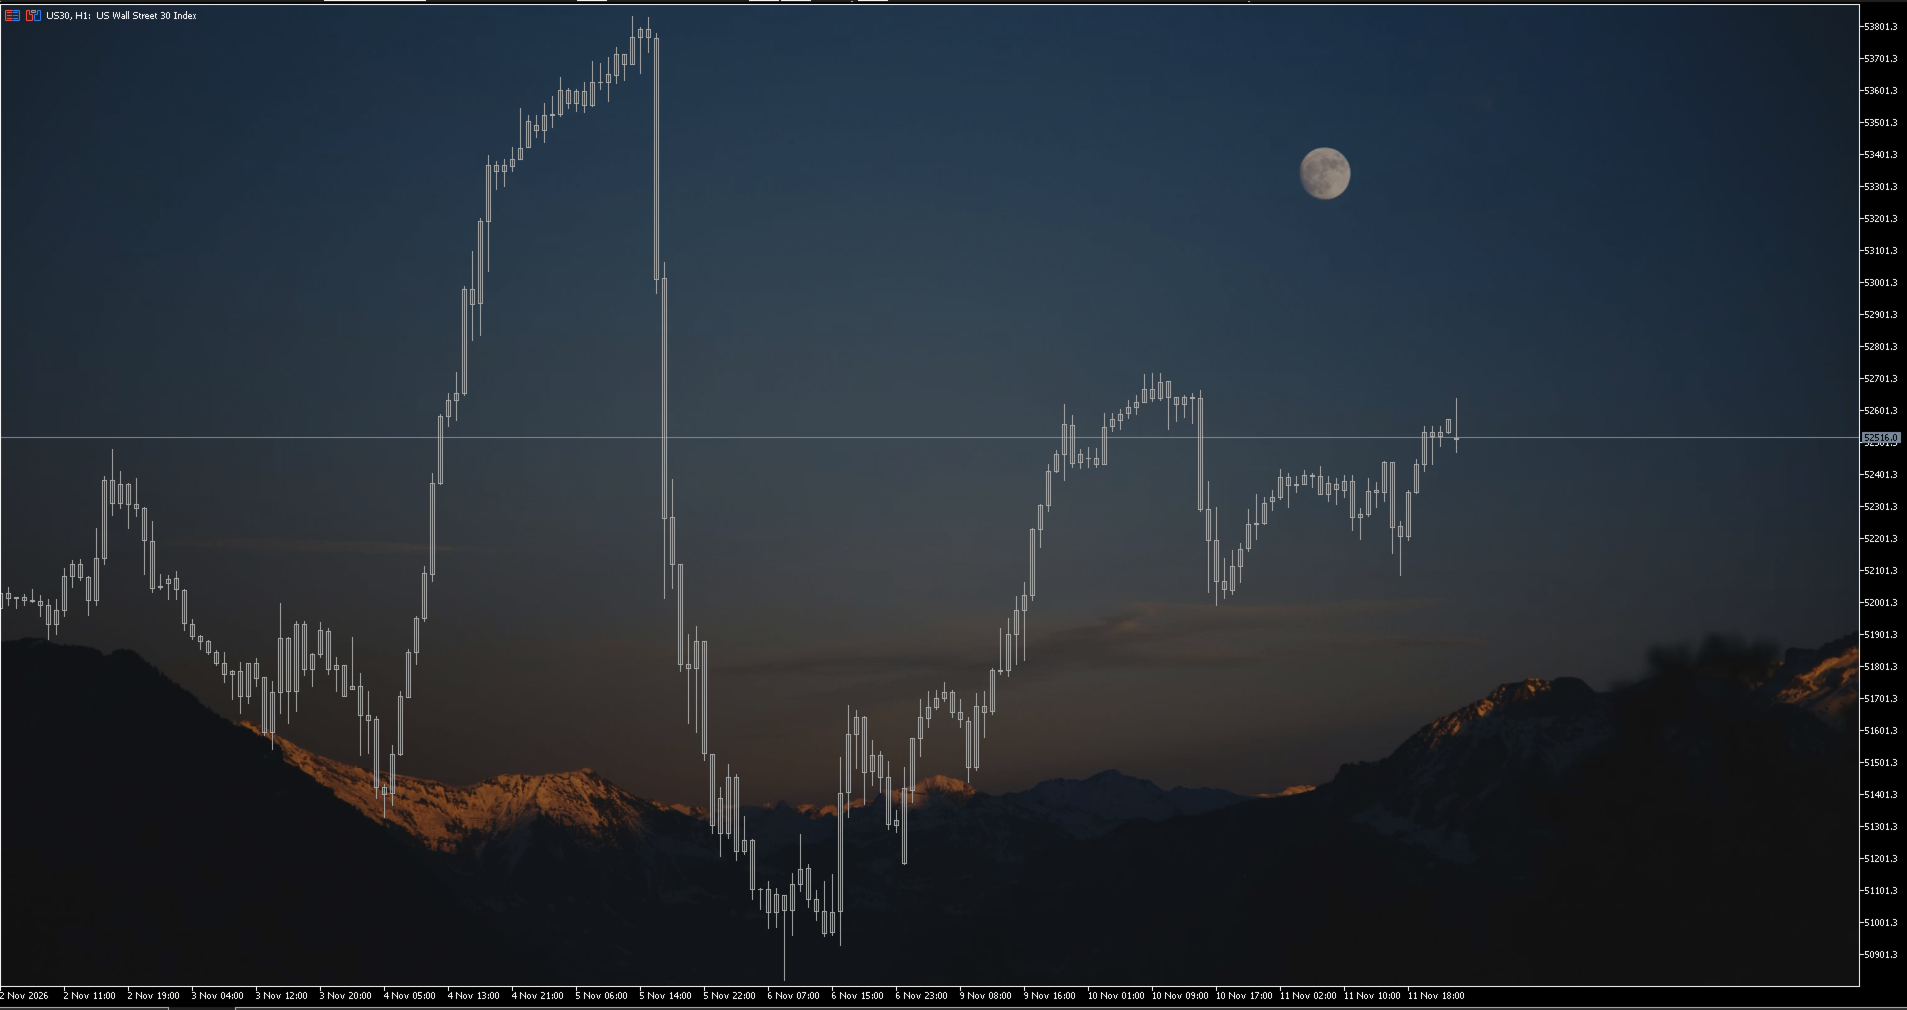
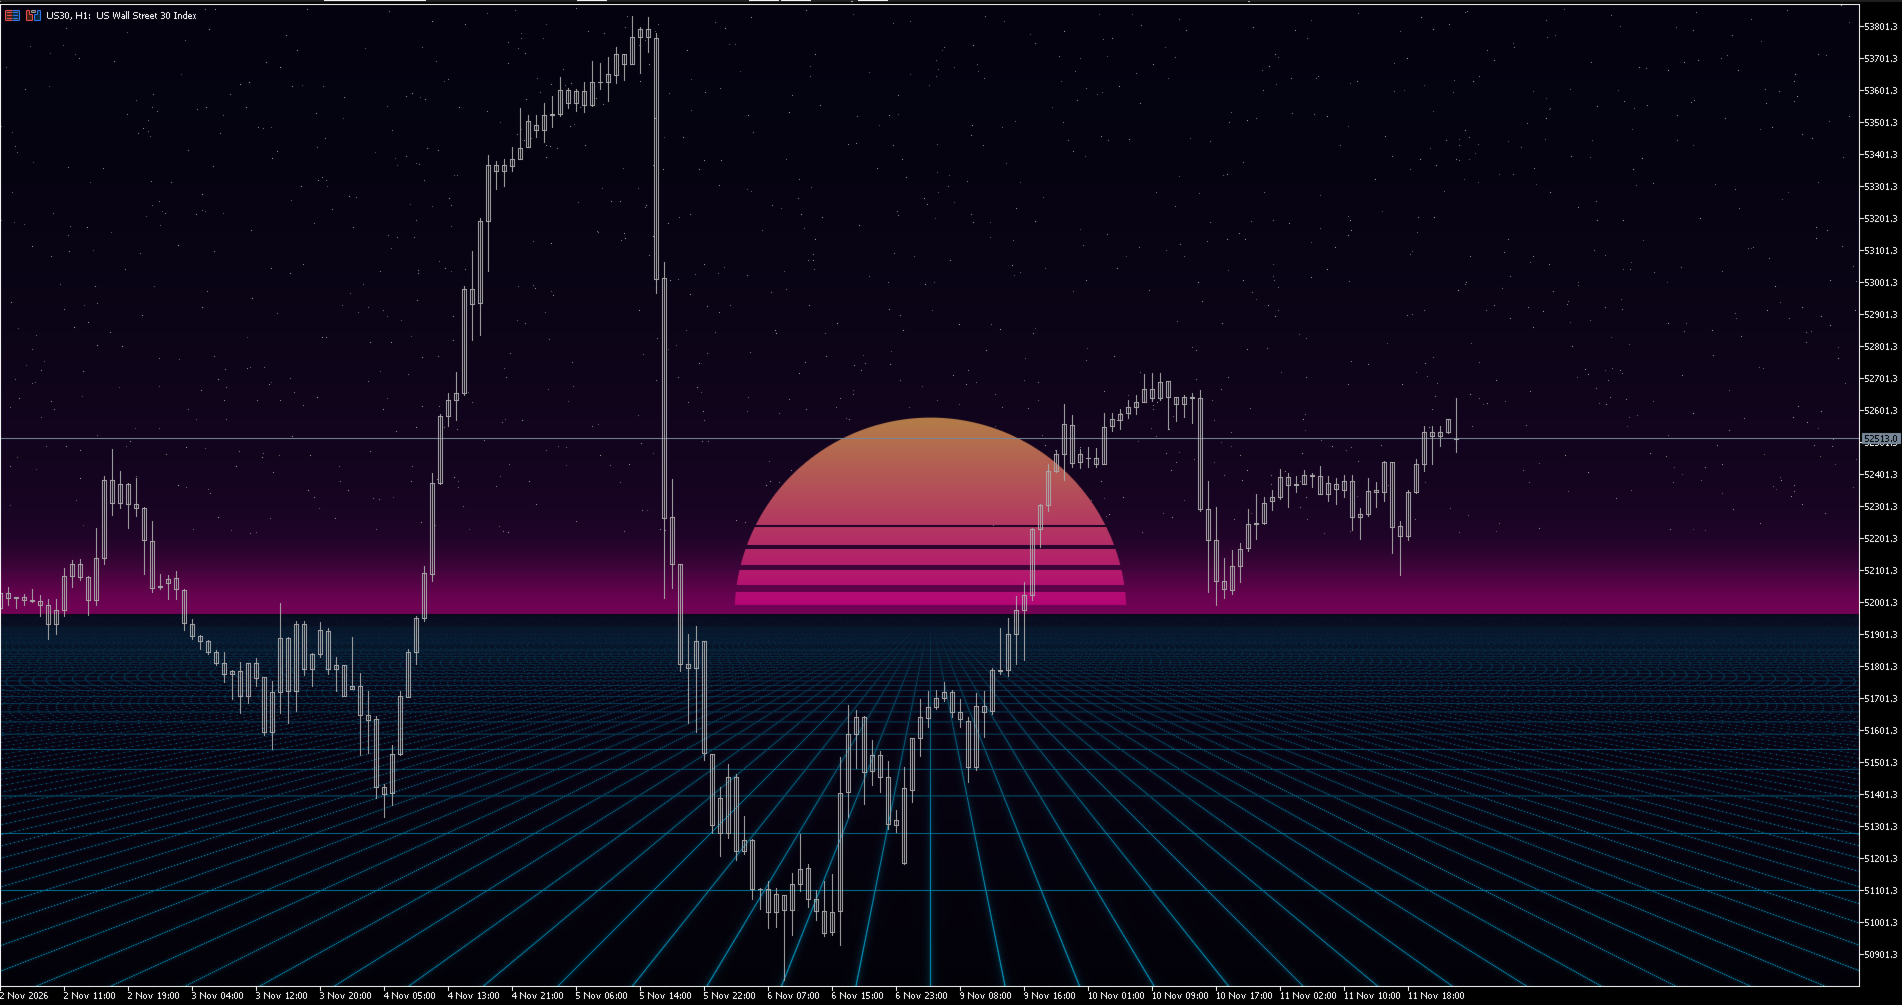
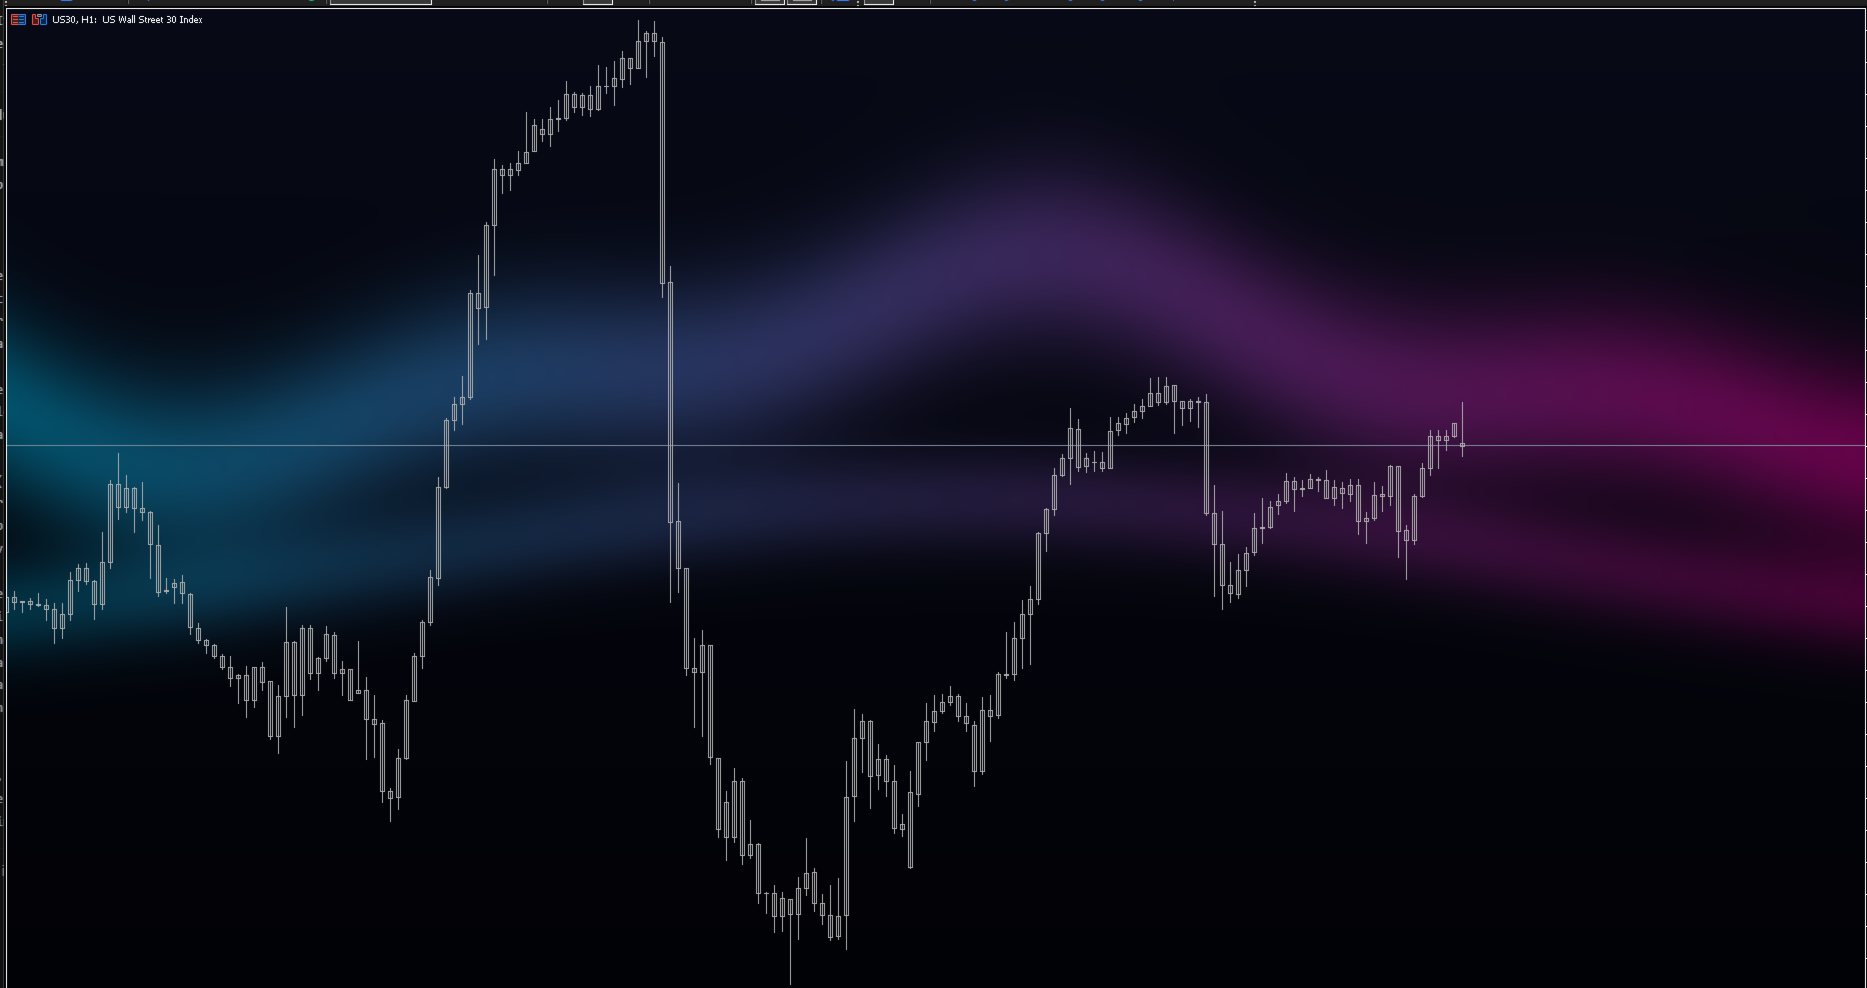
Neon Wallpaper puts a background image behind your chart. The candles, indicators and your drawings stay on top, and the opacity is adjustable so price stays easy to read.
What it does
- 4 built-in backgrounds, generated at the exact size of the chart window: Aurora, Neon Horizon, Deep Space and Soft Gradient.
- Two accent colors to change the look of the built-in backgrounds.
- Your own image: save it as a BMP file (24-bit or 32-bit) in the MQL5\Files folder and select "My image".
- Four fit modes for your image: Cover, Contain, Stretch, Original size.
- Opacity from 0 to 100%: lower values make candles stand out more.
- Follows the chart size automatically when you resize or maximize the window.
- Existing drawings (lines, rectangles, Fibonacci and others) are kept above the wallpaper, with their levels, colors and timeframe visibility.
- The chart grid can be hidden while the wallpaper is active and is restored when the indicator is removed.
How to use your own image
1. In MetaTrader 5 open File > Open Data Folder > MQL5 > Files.
2. Copy your image there as a BMP file (in Paint: Save as > BMP, 24-bit).
3. In the indicator inputs set "Wallpaper source" to "My image" and type the file name.
If the file is missing or in another format, the indicator shows a built-in background and writes the reason in the Experts journal.
Inputs
- Show wallpaper: on/off.
- Wallpaper source: one of the 4 built-in backgrounds or your image.
- My image: BMP file name and fit mode.
- Opacity %.
- Accent color 1 and 2 for the built-in backgrounds.
- Hide chart grid while active.
- Keep my existing drawings above the wallpaper.
Notes
- This is a visual tool. It does not generate trading signals.
- No DLL, no external files required, no internet connection.
- Works on any symbol and timeframe.
- The photos shown in the screenshots are examples of user images and are not included. The product includes the 4 built-in backgrounds; you can load any BMP image you own.