Volume Delta Suite
- Göstergeler
- Sürüm: 1.0
- Etkinleştirmeler: 15

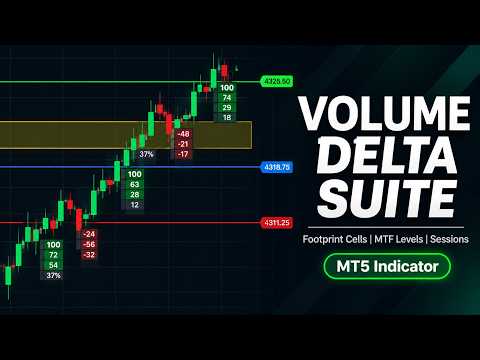
VolumeDelta Suite combines estimated volume delta, multi-timeframe levels, price-level cells and session levels in one indicator. Everything is drawn by a single engine, so all modules stay aligned when you zoom, scroll or switch display modes.
Volume delta candles
- Each candle is rebuilt from lower-timeframe data (M1 by default). Buy and sell volume are estimated from the inner candles and shown as two bars inside the body.
- Virgin candles (price has not yet taken back their low/high) get a filled body and BUY/SELL bars. Violated candles are drawn with a white outline.
- Hide violated candles (key B) or compact the chart (key C): only virgin candles remain, placed next to each other without gaps. Both modes are on by default.
- RSI extreme candles: the border turns lime when RSI is above the upper level and red when it is below the lower level. Period and levels are adjustable.
Multi-timeframe levels
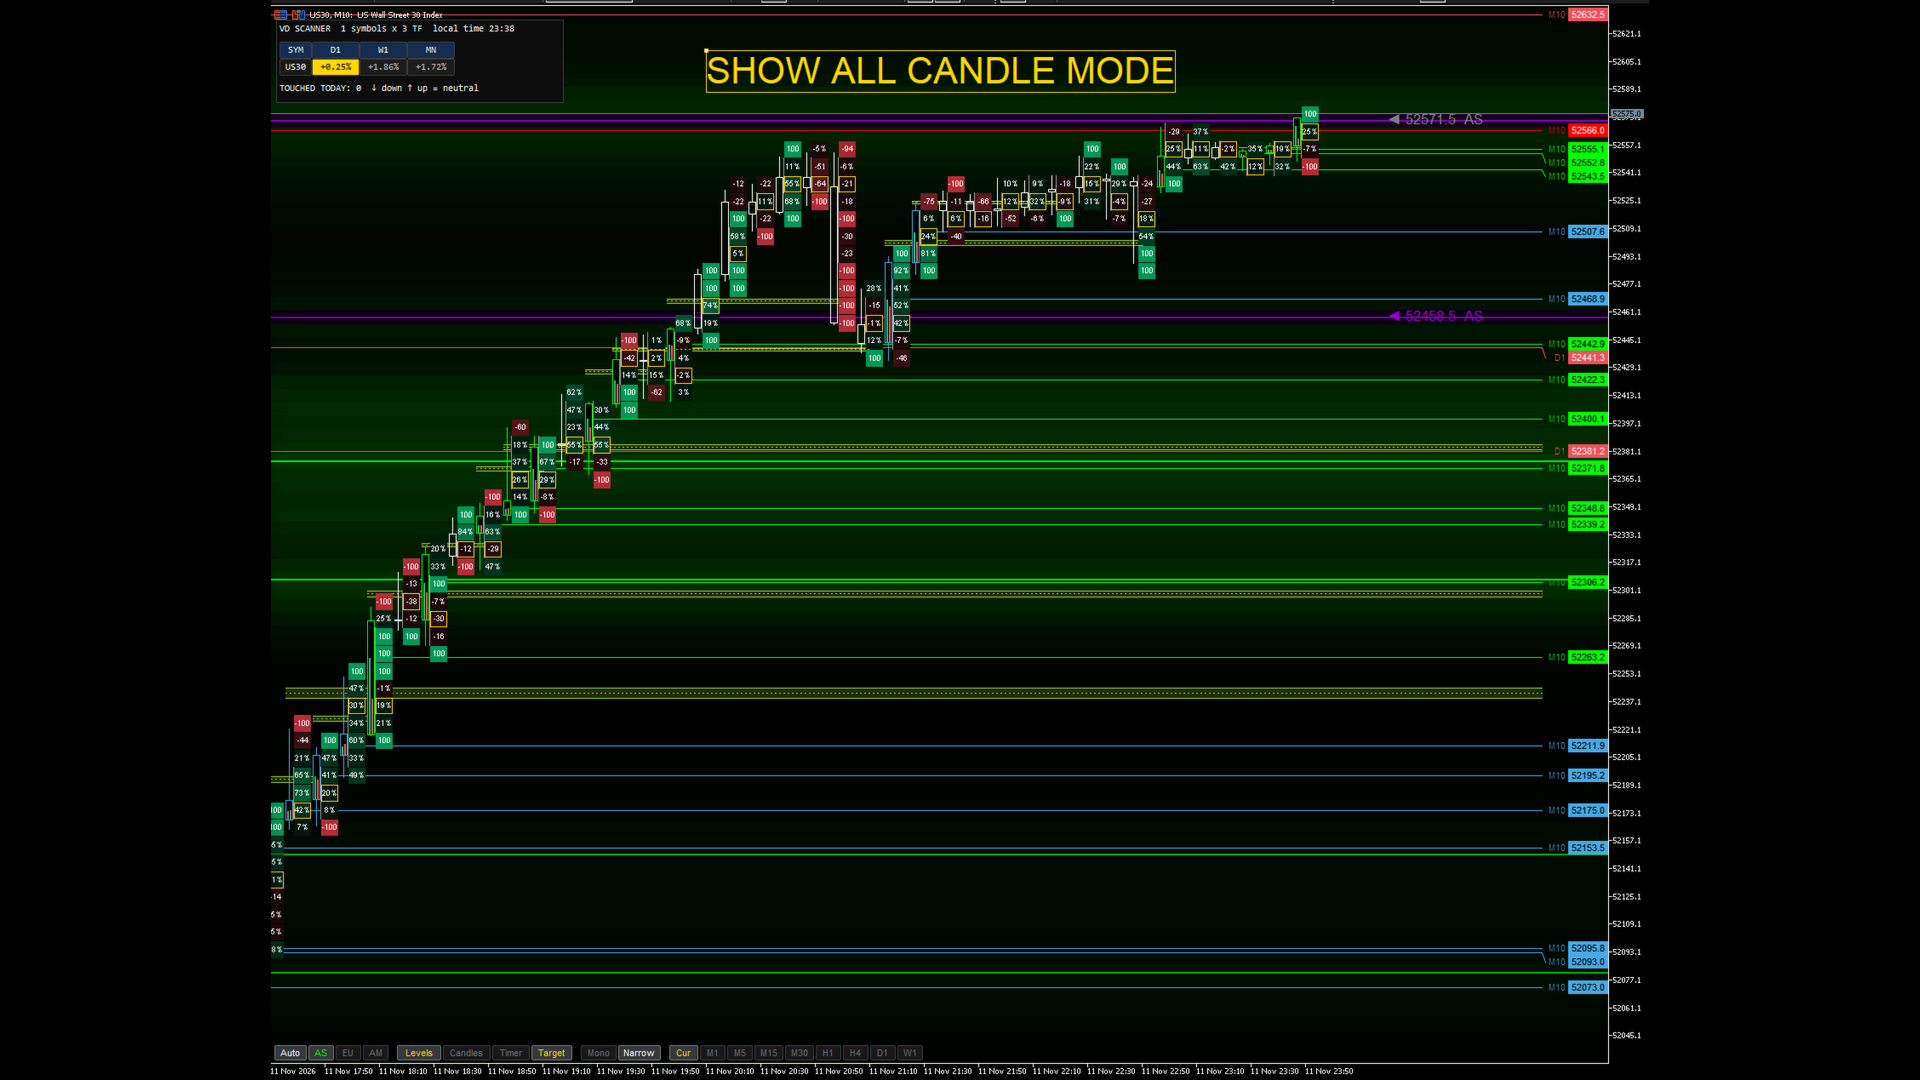
- Levels from MN1, W1, D1 and the chart timeframe (H4 and H1 optional) are visible on every timeframe.
- A level is the top of the BUY or SELL bar inside a virgin candle, with a timeframe label and a price tag at the scale edge.
- Values are cached on disk, so levels stay the same after a restart or a timeframe change.
Retracement zones
- Zones between two Fibonacci levels (default 0.40-0.45), measured from an anchor candle to the first candle that closes beyond it.
- Live zones extend to the right; broken zones are frozen at the break. Key F turns them on/off.
Price-level cells
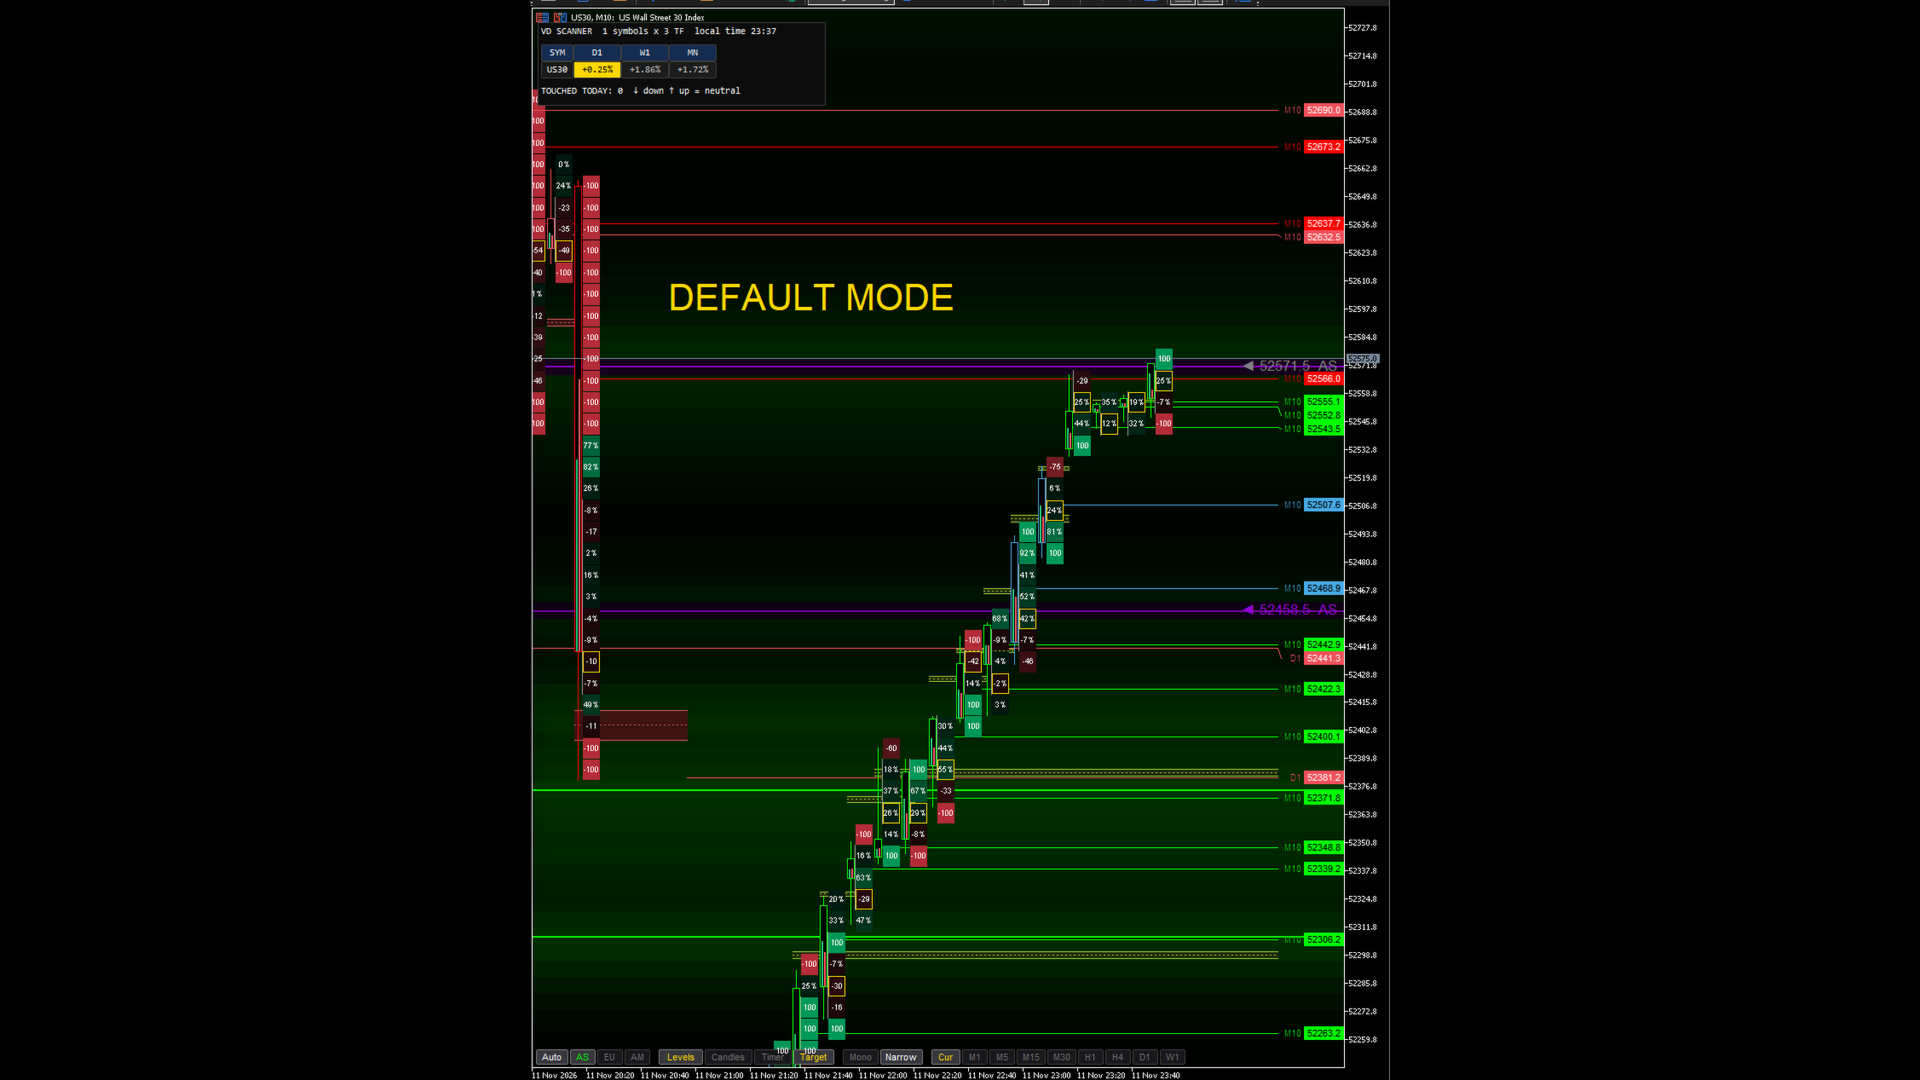
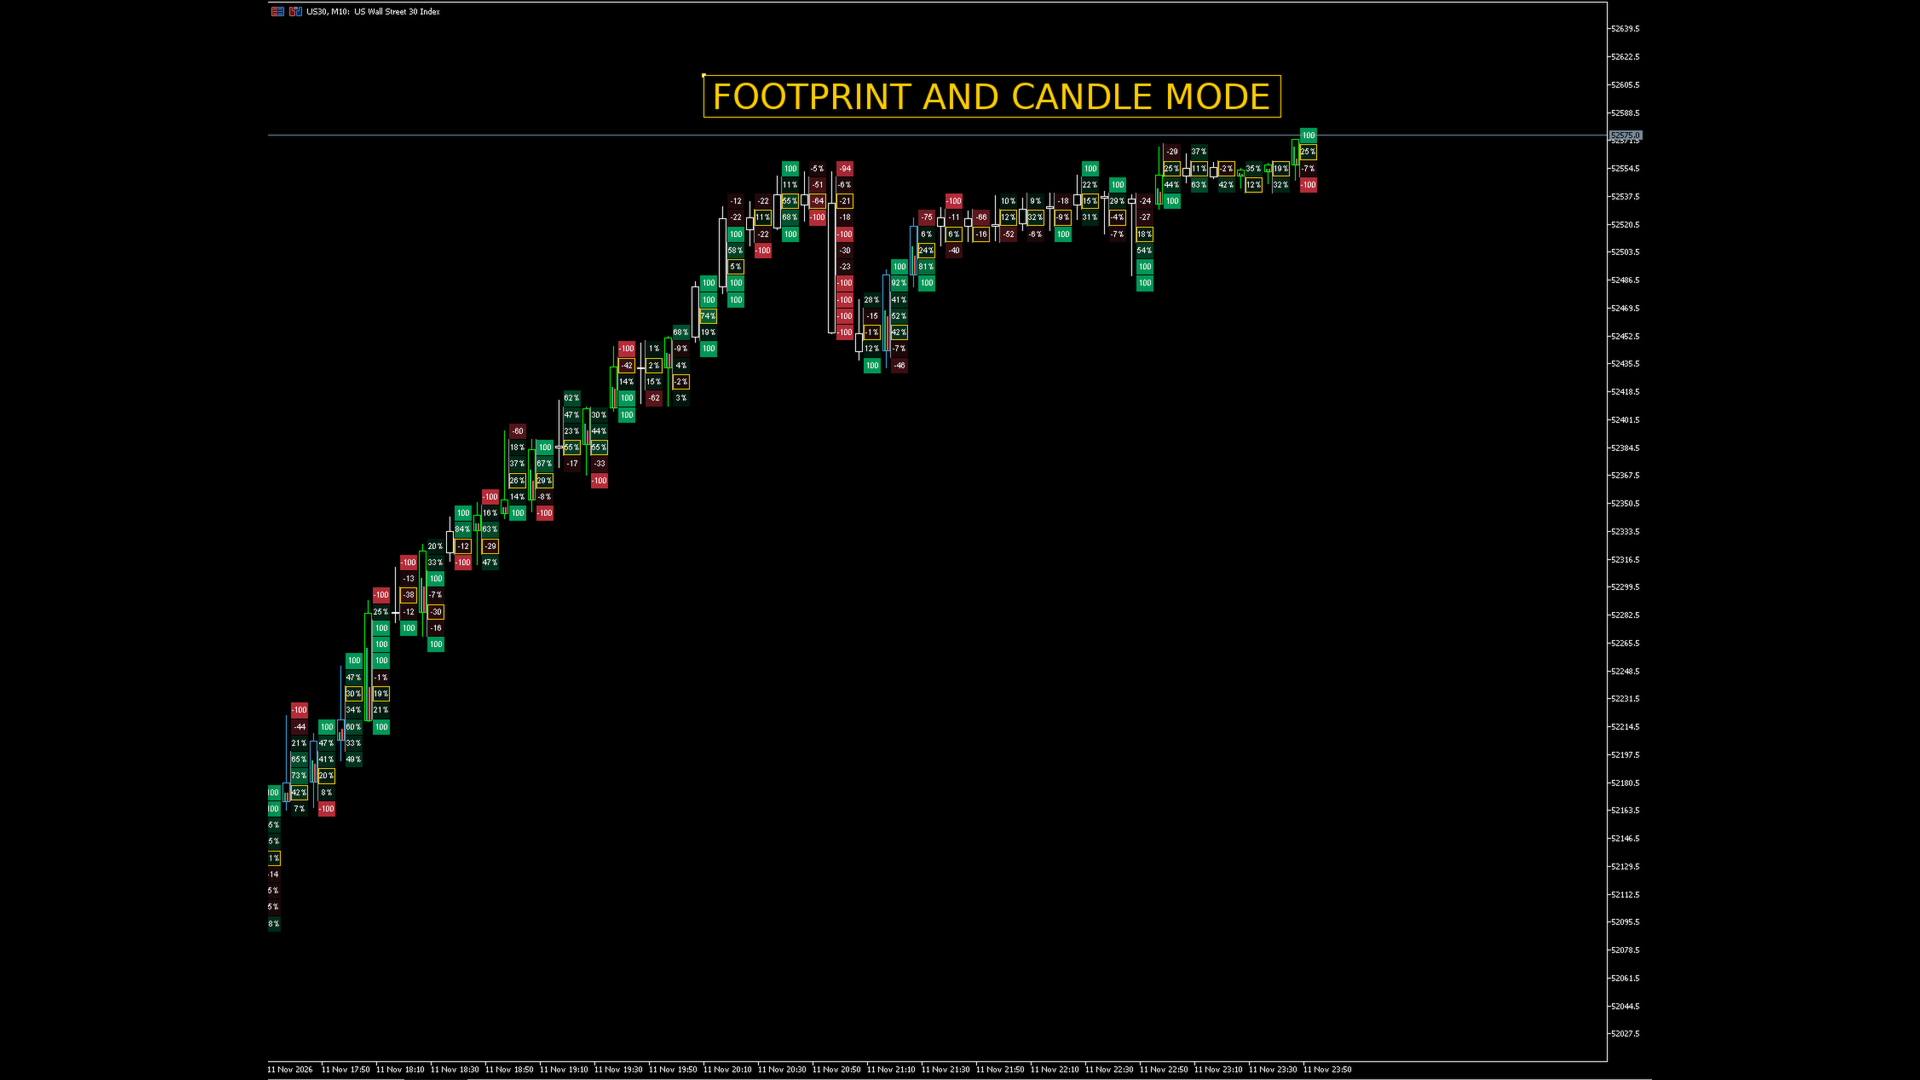
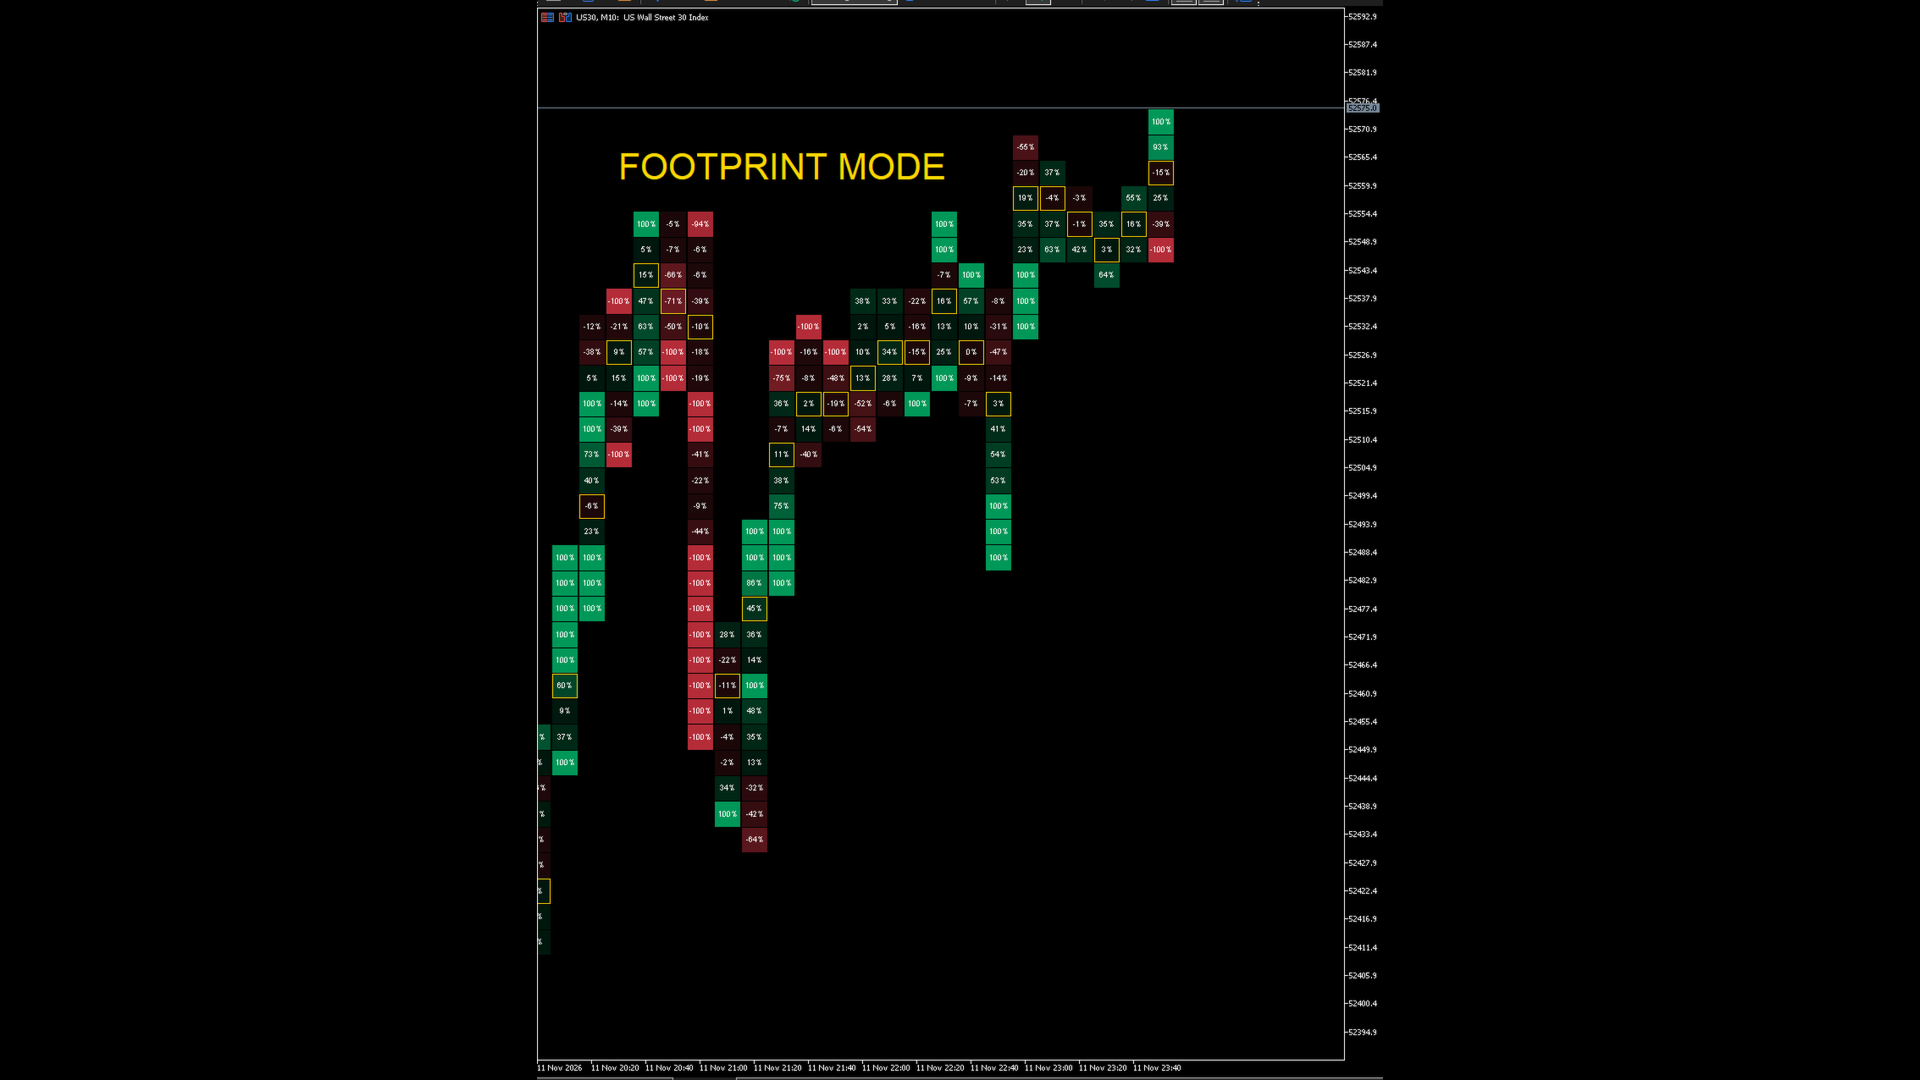
- Zoom in and each candle splits into a narrow candle on the left and a column of cells on the right.
- Each cell shows the estimated delta % of that price row. Color intensity grows only when one side clearly dominates.
- Three estimation methods: inner candle direction, open-extremes-close path, or the same split used by the BUY/SELL bars.
- Footprint only mode: hides the candles and shows the cells on the full bar width.
- Optional: POC outline, value area line, diagonal imbalances, stacked-imbalance zones. Key X turns the cells on/off.
Session levels (Asia / Europe / America)
- Support/resistance field built from closes inside each session, colored by the session that created the level.
- The 4 nearest strong levels above and below price are marked as targets.
- Optional session candles (one box per session) and countdown timers to session open/close.
- Control panel at the bottom: Auto/AS/EU/AM, Levels, Candles, Timer, Target, Mono, Narrow, source timeframe. Shortcuts Ctrl+1...7.
- Server GMT offset and US daylight saving time are detected automatically.
Line touch scanner
- Dashboard with the distance from the nearest D1/W1/MN level, today's touches and their direction (RSI extremes on M5).
- Works on the chart symbol by default; add other symbols in the inputs. Click a cell to open that chart.
For EA developers
- Buffers 0-2: Buy volume, Sell volume, Delta (iCustom).
Keys (all configurable)
V show/hide candles, B hide violated, C compact, F zones, X cells, Ctrl+1...7 session panel.
Main inputs
- Modules: sessions module on/off.
- Volume Delta: candles to calculate, non-virgin rule, inner timeframe, volume split method.
- RSI extremes: period, upper/lower level, colors.
- Violated candles: hide violated, compact, keys.
- Level lines: timeframes shown, line types, max lines, labels and price tags, file cache.
- Fibonacci zones: impulse rule, box levels, break rule, colors.
- Scanner: symbols, timeframes, touch tolerance, position and size.
- Sessions: analysis depth, server GMT offset, session hours, colors.
- Price-level cells: estimation method, footprint only, minimum bar width, rows, cell text, POC, value area, imbalances, colors.
Important notes
- Buy/sell volumes are estimates built from lower-timeframe candles. On Forex and CFDs the volume is the broker's tick volume, not real exchange order flow.
- The indicator needs M1 history: the first load can take a few seconds while MetaTrader downloads it.
- This is an analysis tool. It does not open trades and does not guarantee any result.
Volume delta candles
- Each candle is rebuilt from lower-timeframe data (M1 by default). Buy and sell volume are estimated from the inner candles and shown as two bars inside the body.
- Virgin candles (price has not yet taken back their low/high) get a filled body and BUY/SELL bars. Violated candles are drawn with a white outline.
- Hide violated candles (key B) or compact the chart (key C): only virgin candles remain, placed next to each other without gaps. Both modes are on by default.
- RSI extreme candles: the border turns lime when RSI is above the upper level and red when it is below the lower level. Period and levels are adjustable.
Multi-timeframe levels
- Levels from MN1, W1, D1 and the chart timeframe (H4 and H1 optional) are visible on every timeframe.
- A level is the top of the BUY or SELL bar inside a virgin candle, with a timeframe label and a price tag at the scale edge.
- Values are cached on disk, so levels stay the same after a restart or a timeframe change.
Retracement zones
- Zones between two Fibonacci levels (default 0.40-0.45), measured from an anchor candle to the first candle that closes beyond it.
- Live zones extend to the right; broken zones are frozen at the break. Key F turns them on/off.
Price-level cells
- Zoom in and each candle splits into a narrow candle on the left and a column of cells on the right.
- Each cell shows the estimated delta % of that price row. Color intensity grows only when one side clearly dominates.
- Three estimation methods: inner candle direction, open-extremes-close path, or the same split used by the BUY/SELL bars.
- Footprint only mode: hides the candles and shows the cells on the full bar width.
- Optional: POC outline, value area line, diagonal imbalances, stacked-imbalance zones. Key X turns the cells on/off.
Session levels (Asia / Europe / America)
- Support/resistance field built from closes inside each session, colored by the session that created the level.
- The 4 nearest strong levels above and below price are marked as targets.
- Optional session candles (one box per session) and countdown timers to session open/close.
- Control panel at the bottom: Auto/AS/EU/AM, Levels, Candles, Timer, Target, Mono, Narrow, source timeframe. Shortcuts Ctrl+1...7.
- Server GMT offset and US daylight saving time are detected automatically.
Line touch scanner
- Dashboard with the distance from the nearest D1/W1/MN level, today's touches and their direction (RSI extremes on M5).
- Works on the chart symbol by default; add other symbols in the inputs. Click a cell to open that chart.
For EA developers
- Buffers 0-2: Buy volume, Sell volume, Delta (iCustom).
Keys (all configurable)
V show/hide candles, B hide violated, C compact, F zones, X cells, Ctrl+1...7 session panel.
Main inputs
- Modules: sessions module on/off.
- Volume Delta: candles to calculate, non-virgin rule, inner timeframe, volume split method.
- RSI extremes: period, upper/lower level, colors.
- Violated candles: hide violated, compact, keys.
- Level lines: timeframes shown, line types, max lines, labels and price tags, file cache.
- Fibonacci zones: impulse rule, box levels, break rule, colors.
- Scanner: symbols, timeframes, touch tolerance, position and size.
- Sessions: analysis depth, server GMT offset, session hours, colors.
- Price-level cells: estimation method, footprint only, minimum bar width, rows, cell text, POC, value area, imbalances, colors.
Important notes
- Buy/sell volumes are estimates built from lower-timeframe candles. On Forex and CFDs the volume is the broker's tick volume, not real exchange order flow.
- The indicator needs M1 history: the first load can take a few seconds while MetaTrader downloads it.
- This is an analysis tool. It does not open trades and does not guarantee any result.