AurumEdge Level Grid
- Göstergeler
-
Anthony Nwabueze Onyenweaku
 I’m Tony, founder of AurumEdge Tech. I build Expert Advisors and indicators for MetaTrader 5 in MQL5, focusing on gold (XAUUSD), forex and indices (US30, NAS100, GER40).
What I do:
• Custom EAs from your strategy rules: breakout, trend, session-based, grid-free risk-managed systems - Sürüm: 1.11
- Etkinleştirmeler: 10
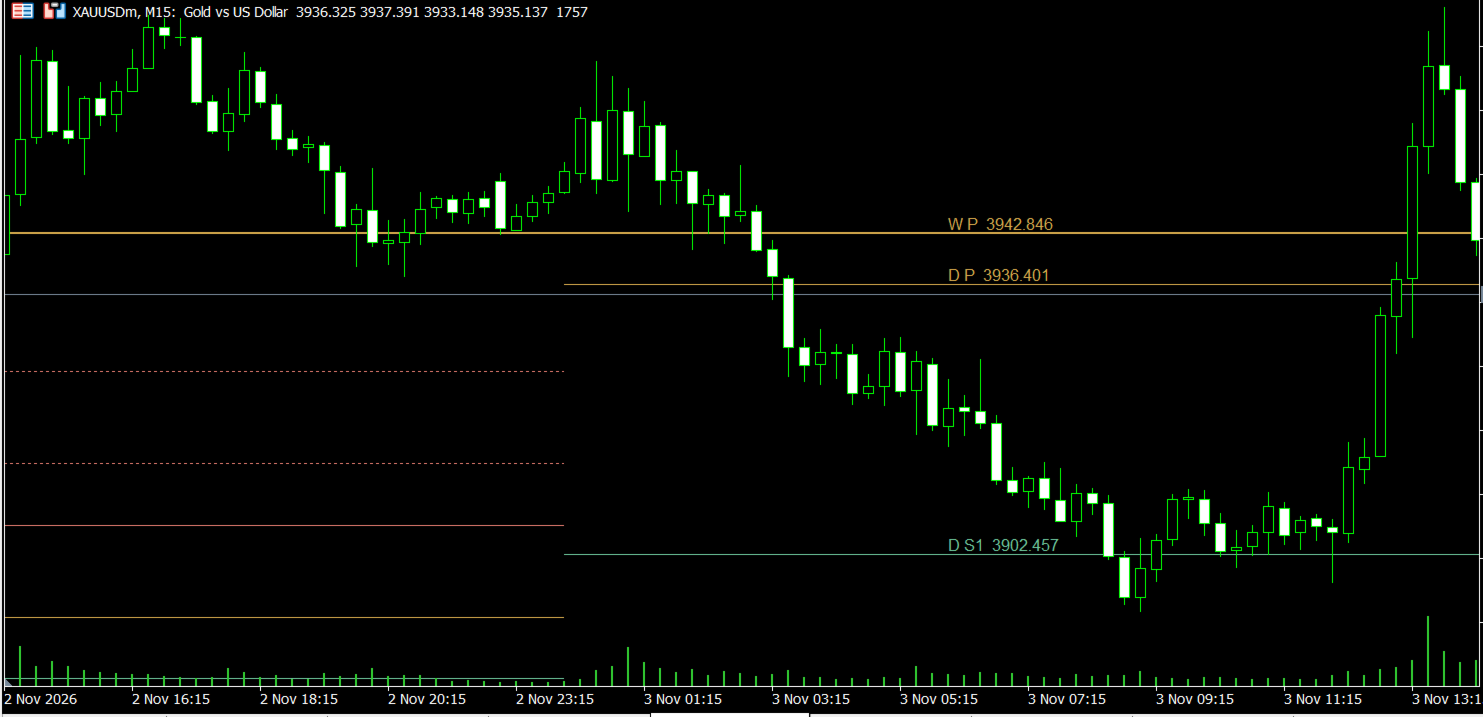
Daily, weekly and monthly pivot levels in Classic, Fibonacci, Camarilla or Woodie style, drawn before the session starts, with clear labels and prices.
AurumEdge Level Grid draws the pivot levels many traders use for support, resistance and targets. Every level is calculated from the previous period, so it is on the chart before price gets there.
WHAT IT SHOWS
- Pivot (P), resistance R1 to R3 and support S1 to S3 (Camarilla adds R4 and S4)
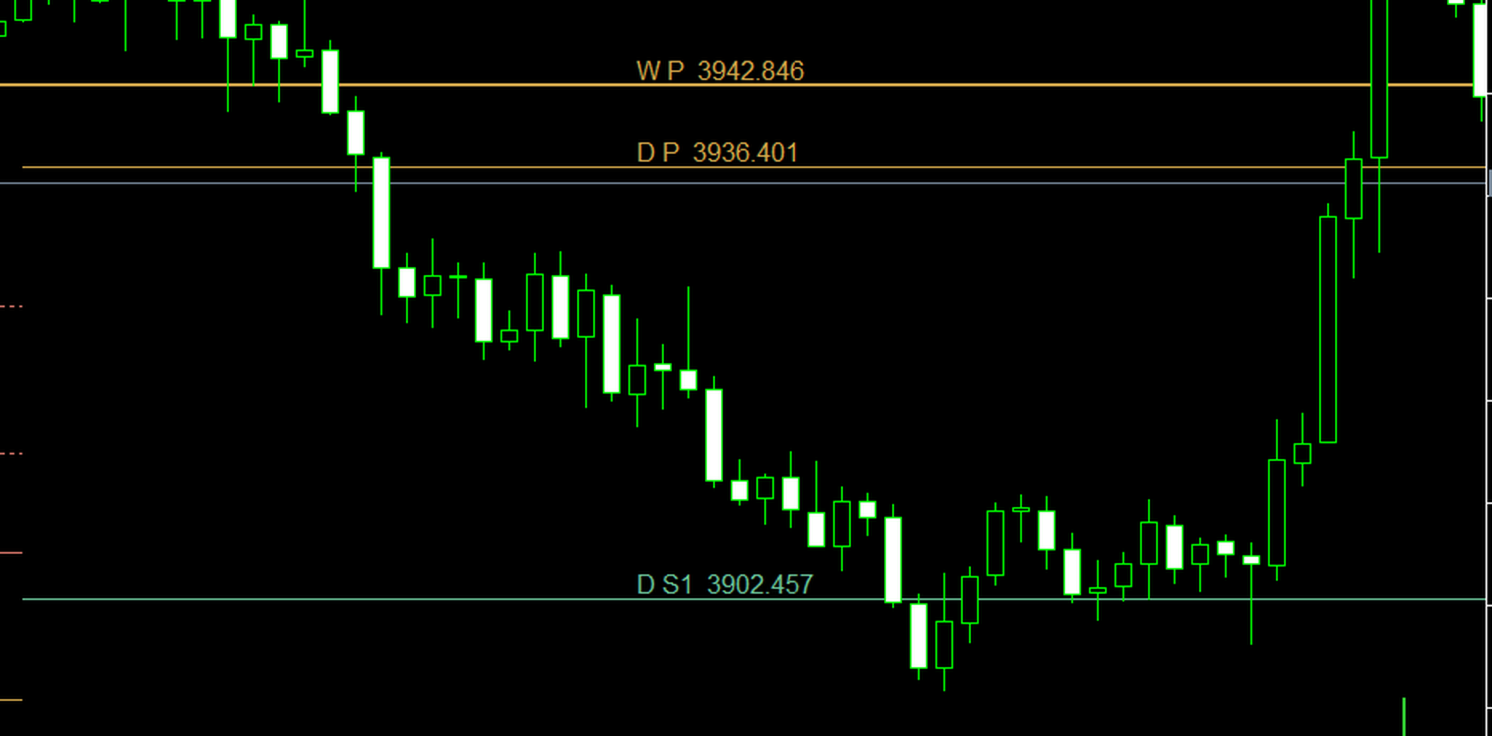
- Daily, weekly and monthly pivots, each with its own label (for example "D R1", "W P")
- The current period's labels show the exact price and stay near the latest candles, so they are always readable
- Past periods drawn for reference (you choose how many)
- Optional mid-levels between pivots
PIVOT STYLES
Classic, Fibonacci, Camarilla and Woodie.
ALERTS
Optional alert when a closed candle touches one of the current period's levels: pop-up, push notification to the MT5 mobile app, and sound.
SETTINGS
- Pivot style
- Daily / weekly / monthly on or off
- Past periods to draw, mid-levels on or off
- Colours, labels and font size
Works on any symbol (forex, gold, indices and more). Pivots of a period are only drawn on charts with a smaller timeframe (for example, daily pivots on H4 and below).
Pivot levels are reference levels, not trading signals. Trading involves risk.