Stress Scope MT5
- Göstergeler
-
Damir Ikinic
 🔷 VELTIS — PROFESYONEL ALGORİTMİK İŞLEM SİSTEMLERİ
- Sürüm: 1.34
VELTIS Stress Scope
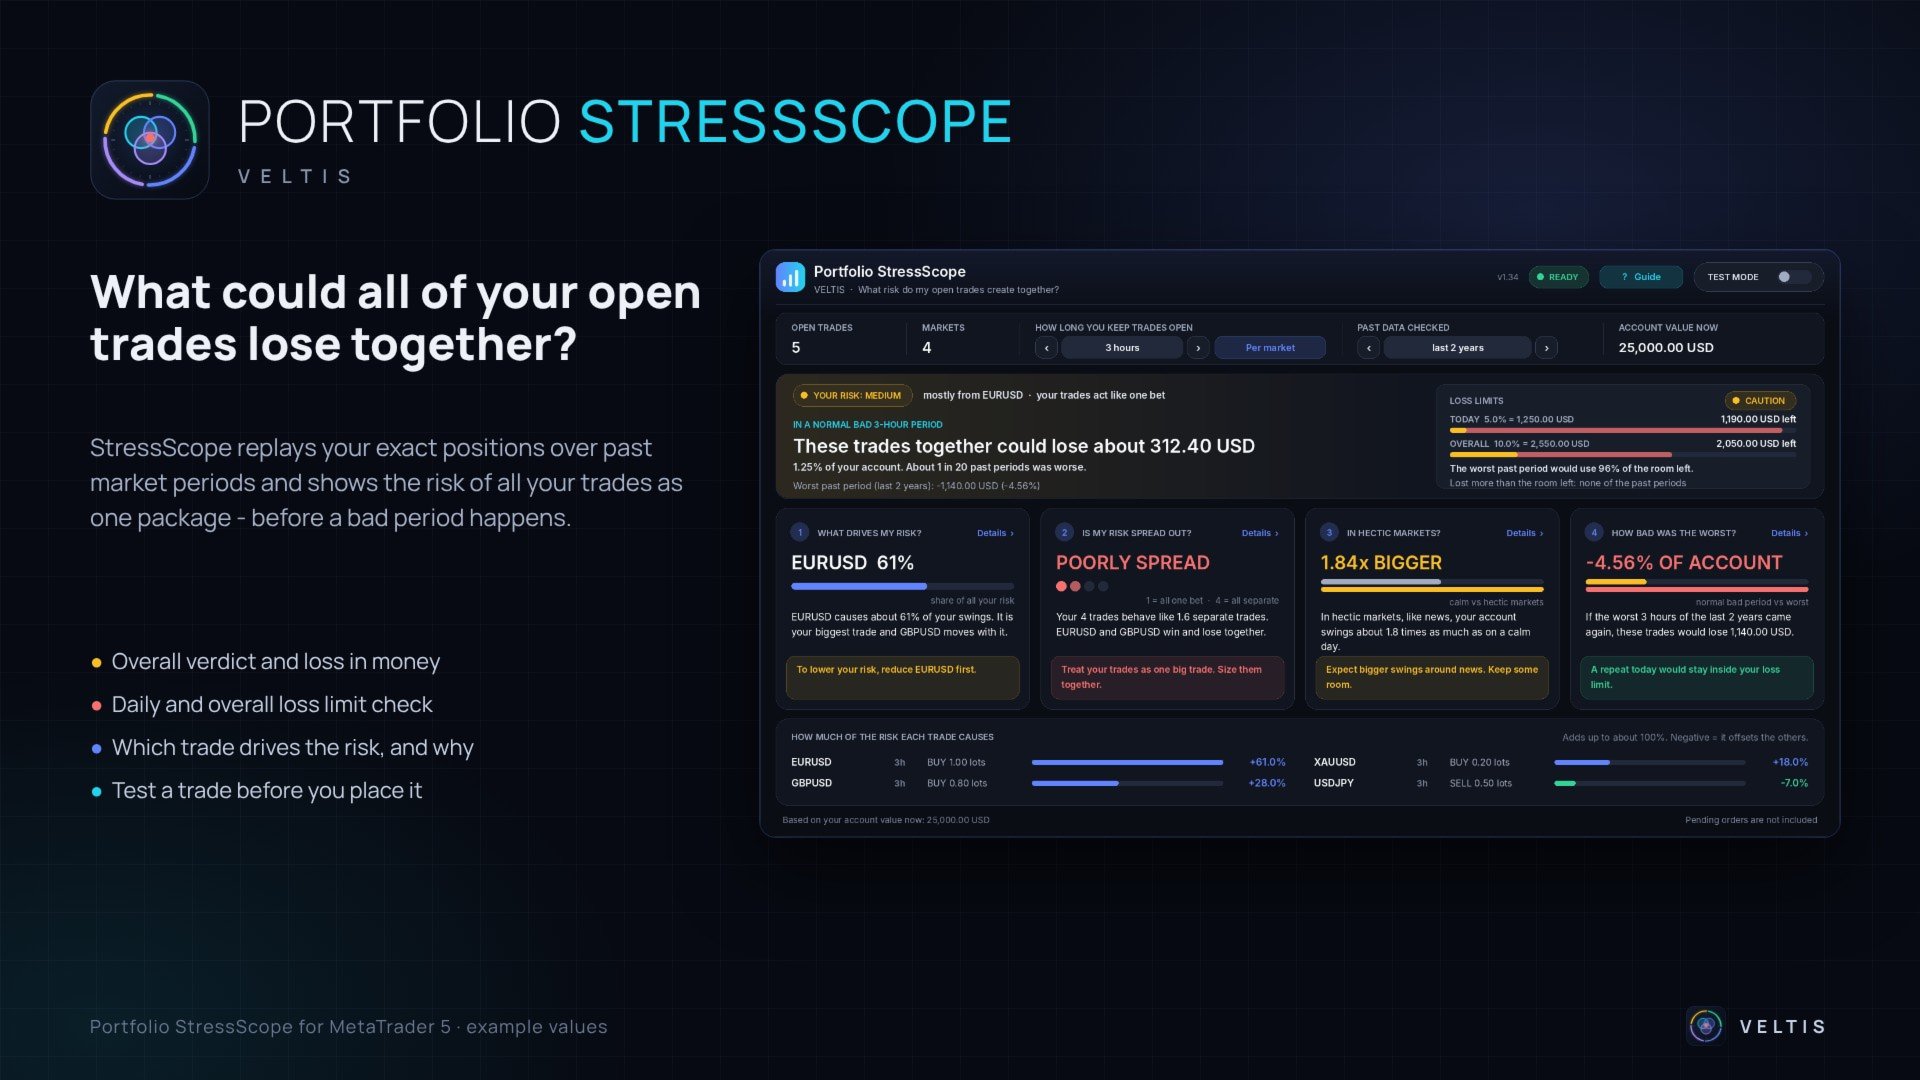
StressScope is a risk panel for MetaTrader 5. It looks at all of your open trades together and shows how much they could lose as one package over the time you usually keep trades open. It replays your exact positions over past market periods, shows which trade causes most of the risk, whether your trades are really spread out or are one bet, and whether a bad period could break the daily or overall loss limit of your account. The indicator does not open, close or change trades and does not give buy or sell signals.
A step-by-step user manual with every element of the panel explained is available in the author's blog: [LINK TO BLOG POST]
Free for the first 50 downloads. $129 after the free licenses have been exhausted
Questions and suggestions are welcome in the comments section or by private message.
Main features
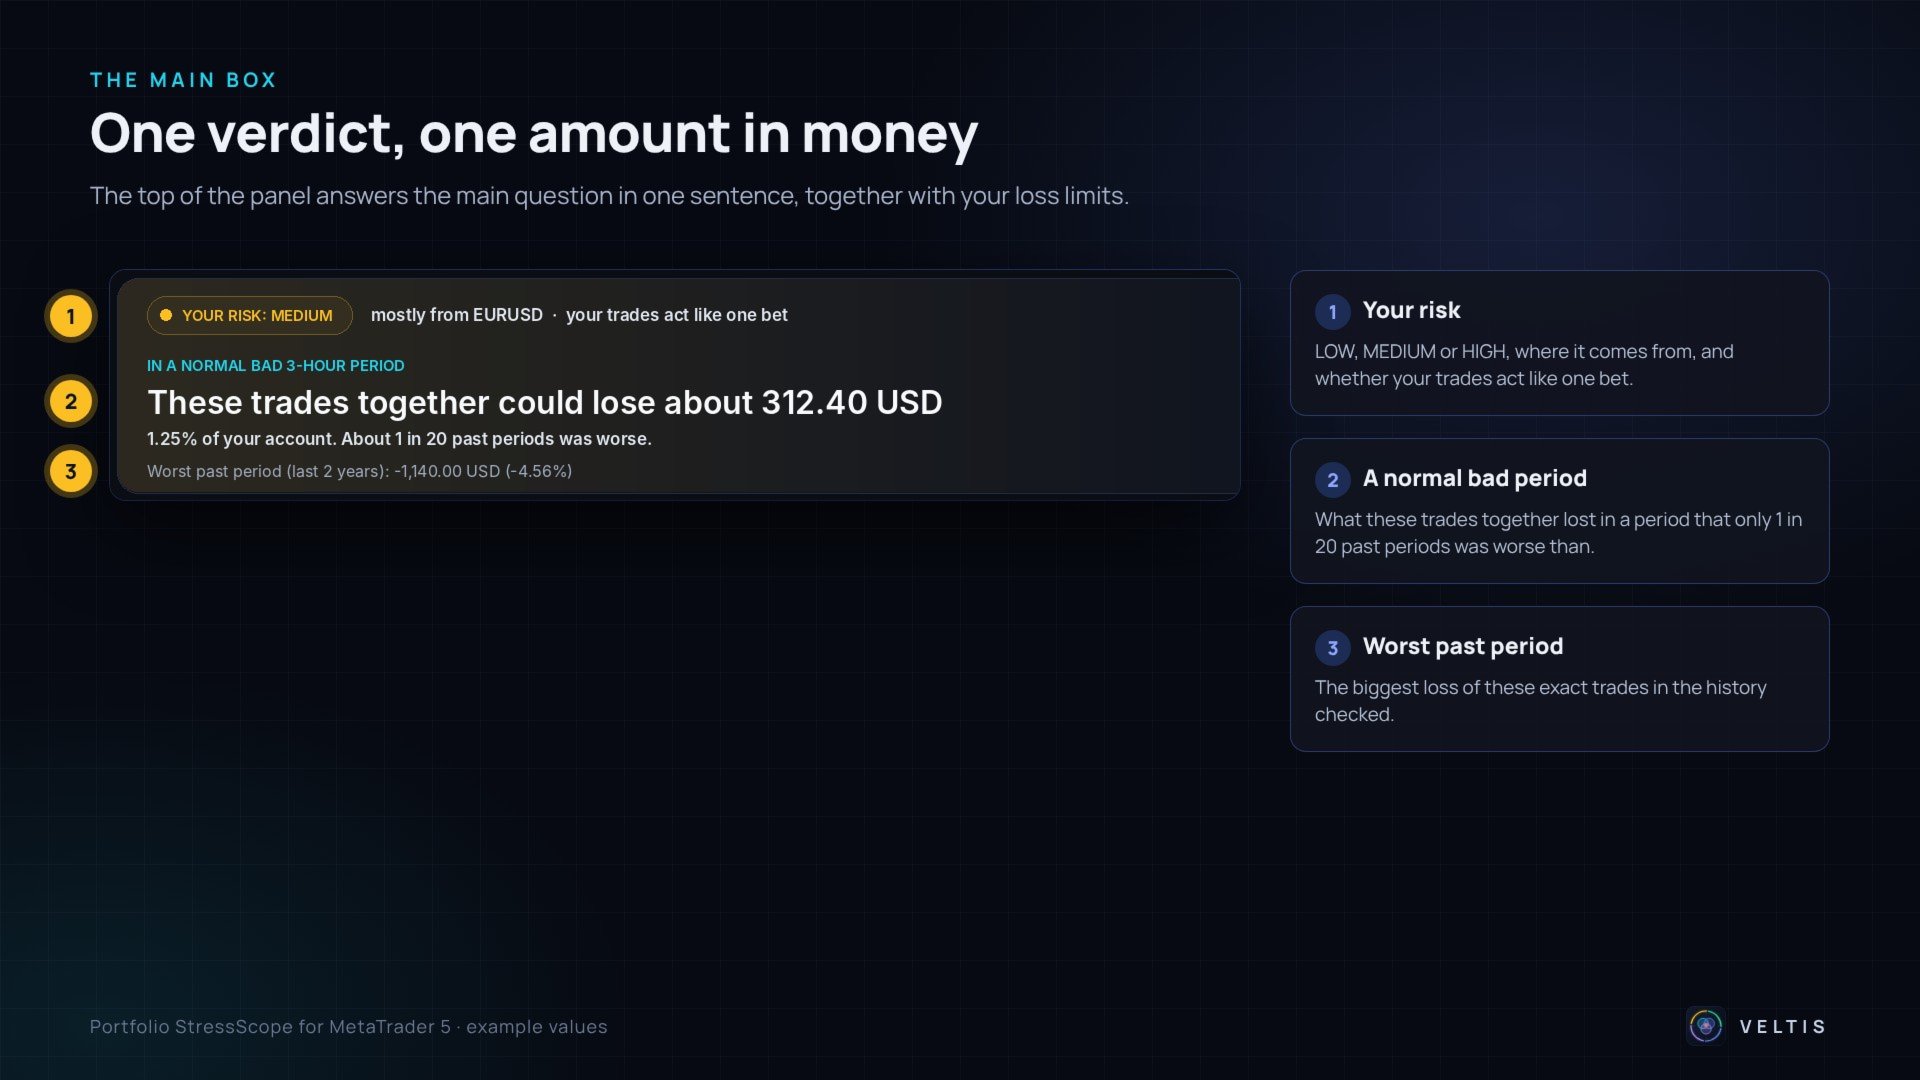
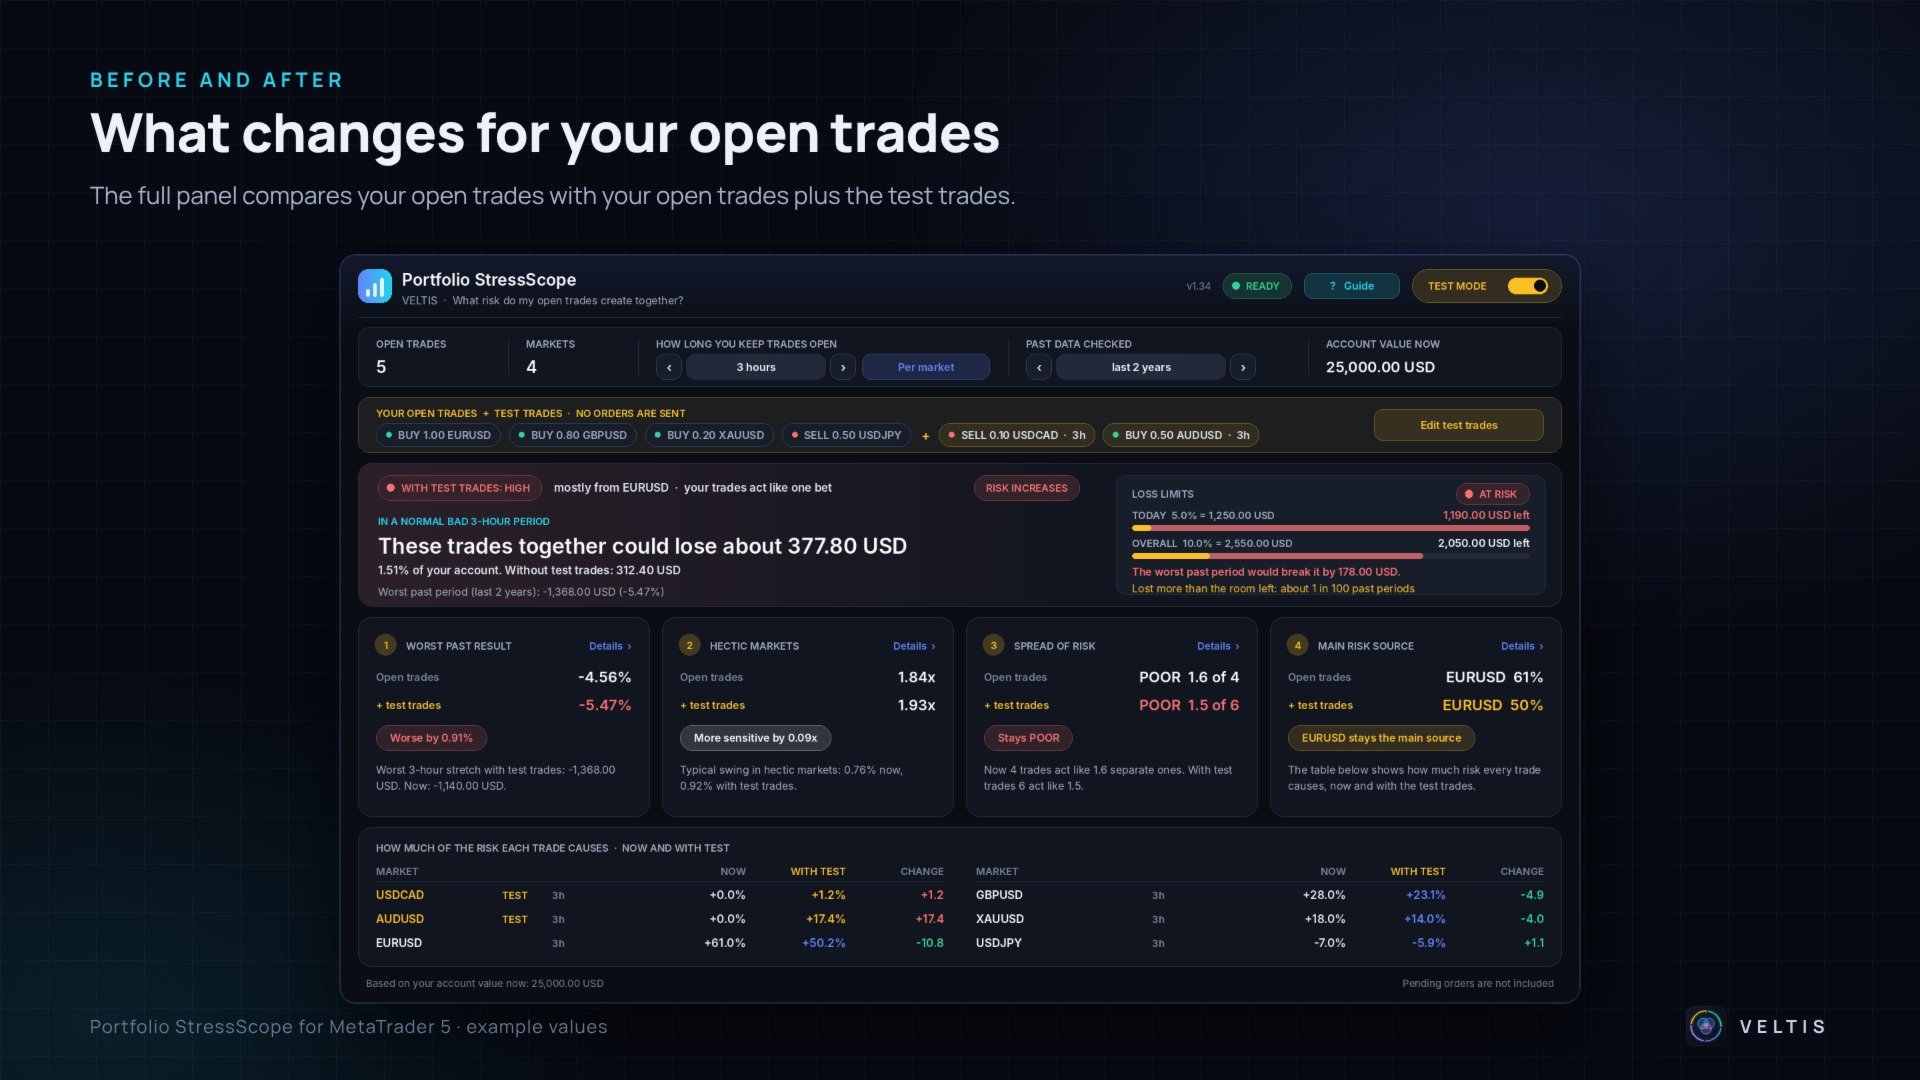
- Overall verdict. The top line shows your risk as low, medium or high, which trade it mainly comes from, and whether your trades act like one bet.
- Loss in a normal bad period. The panel shows in money and in percent of your account what your open trades together lost in a bad period of your holding time. A normal bad period is one that only about 1 in 20 past periods was worse than. The worst past period is shown as well.
- Loss limits. Enter the daily and the overall loss limit of your account, for example the rules of a prop firm. The panel shows the room left today and overall, whether the worst past period would break a limit, and how often past periods lost more than the room left.
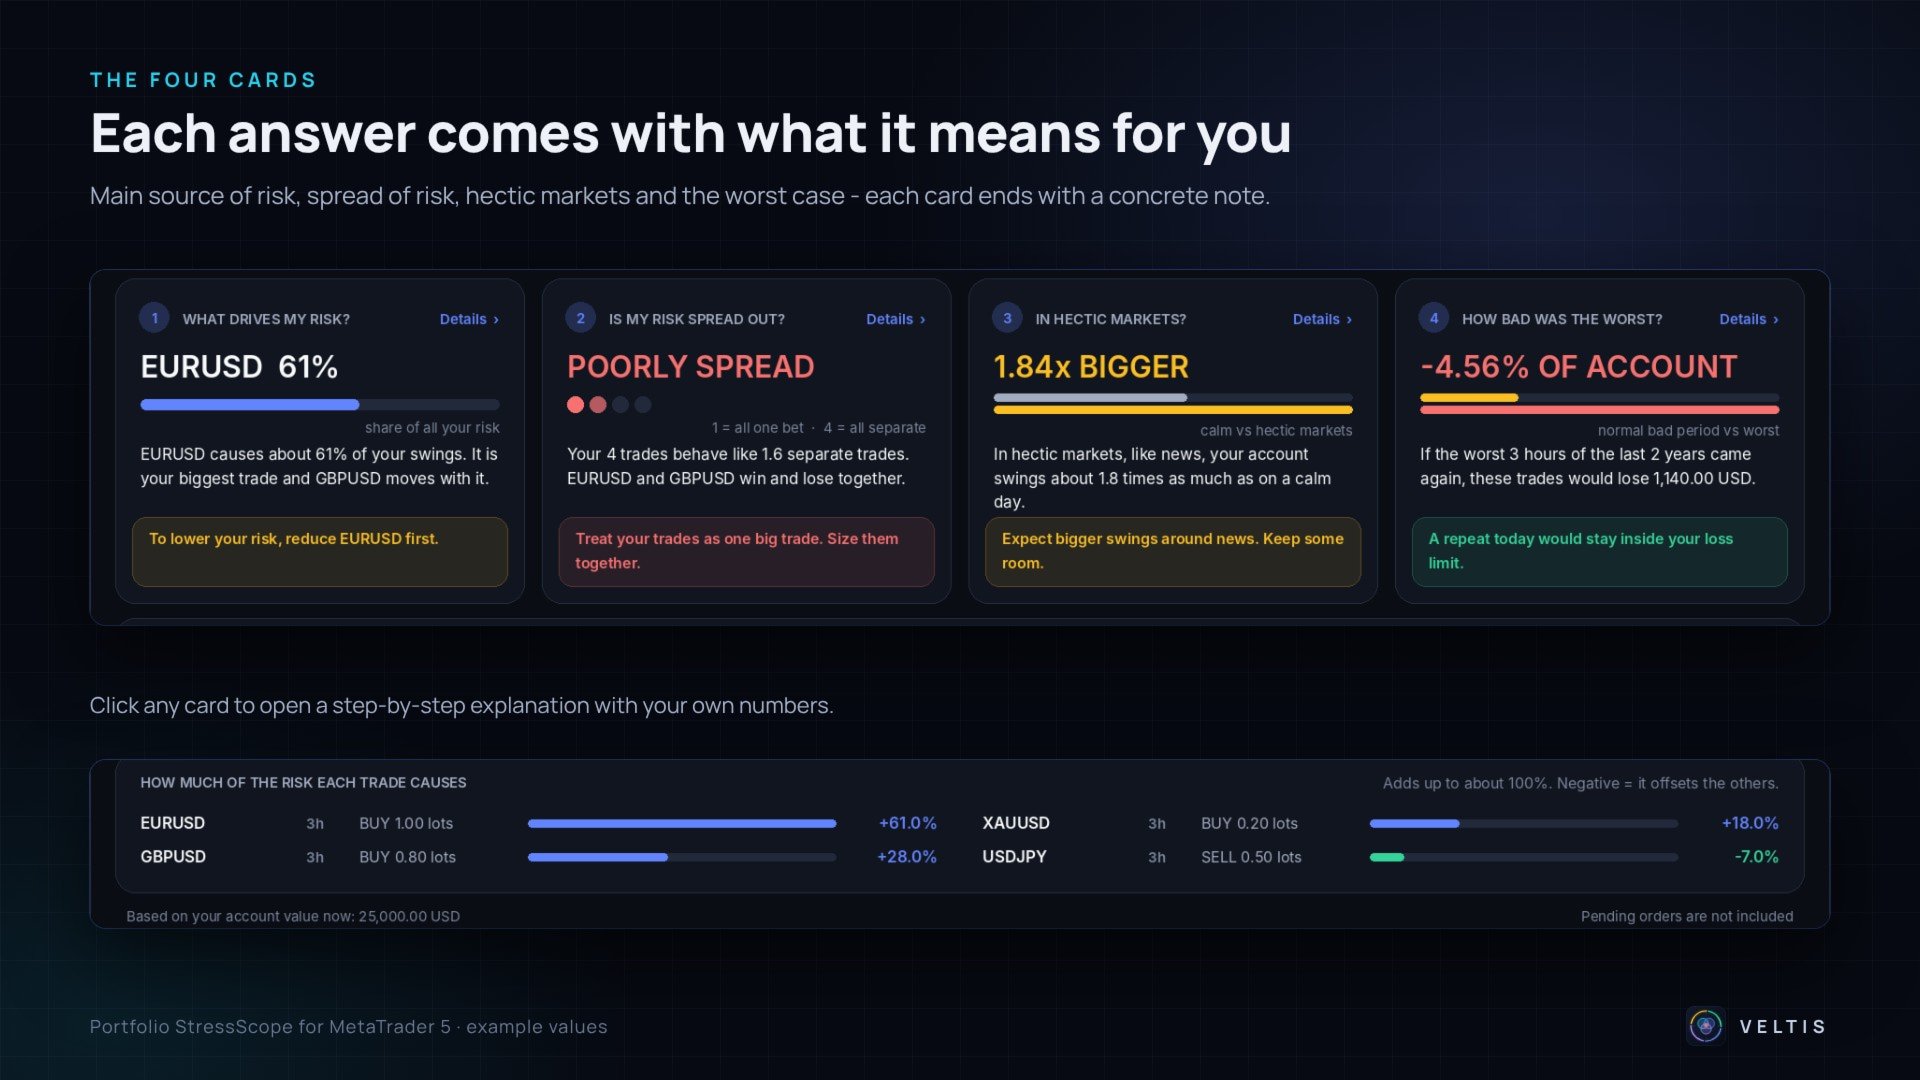
- Main source of risk. Each trade receives a share of the total risk, including how it moves together with your other trades. A negative share means the trade partly offsets the others. The panel names the trade that moves with the main source and the one that offsets it.
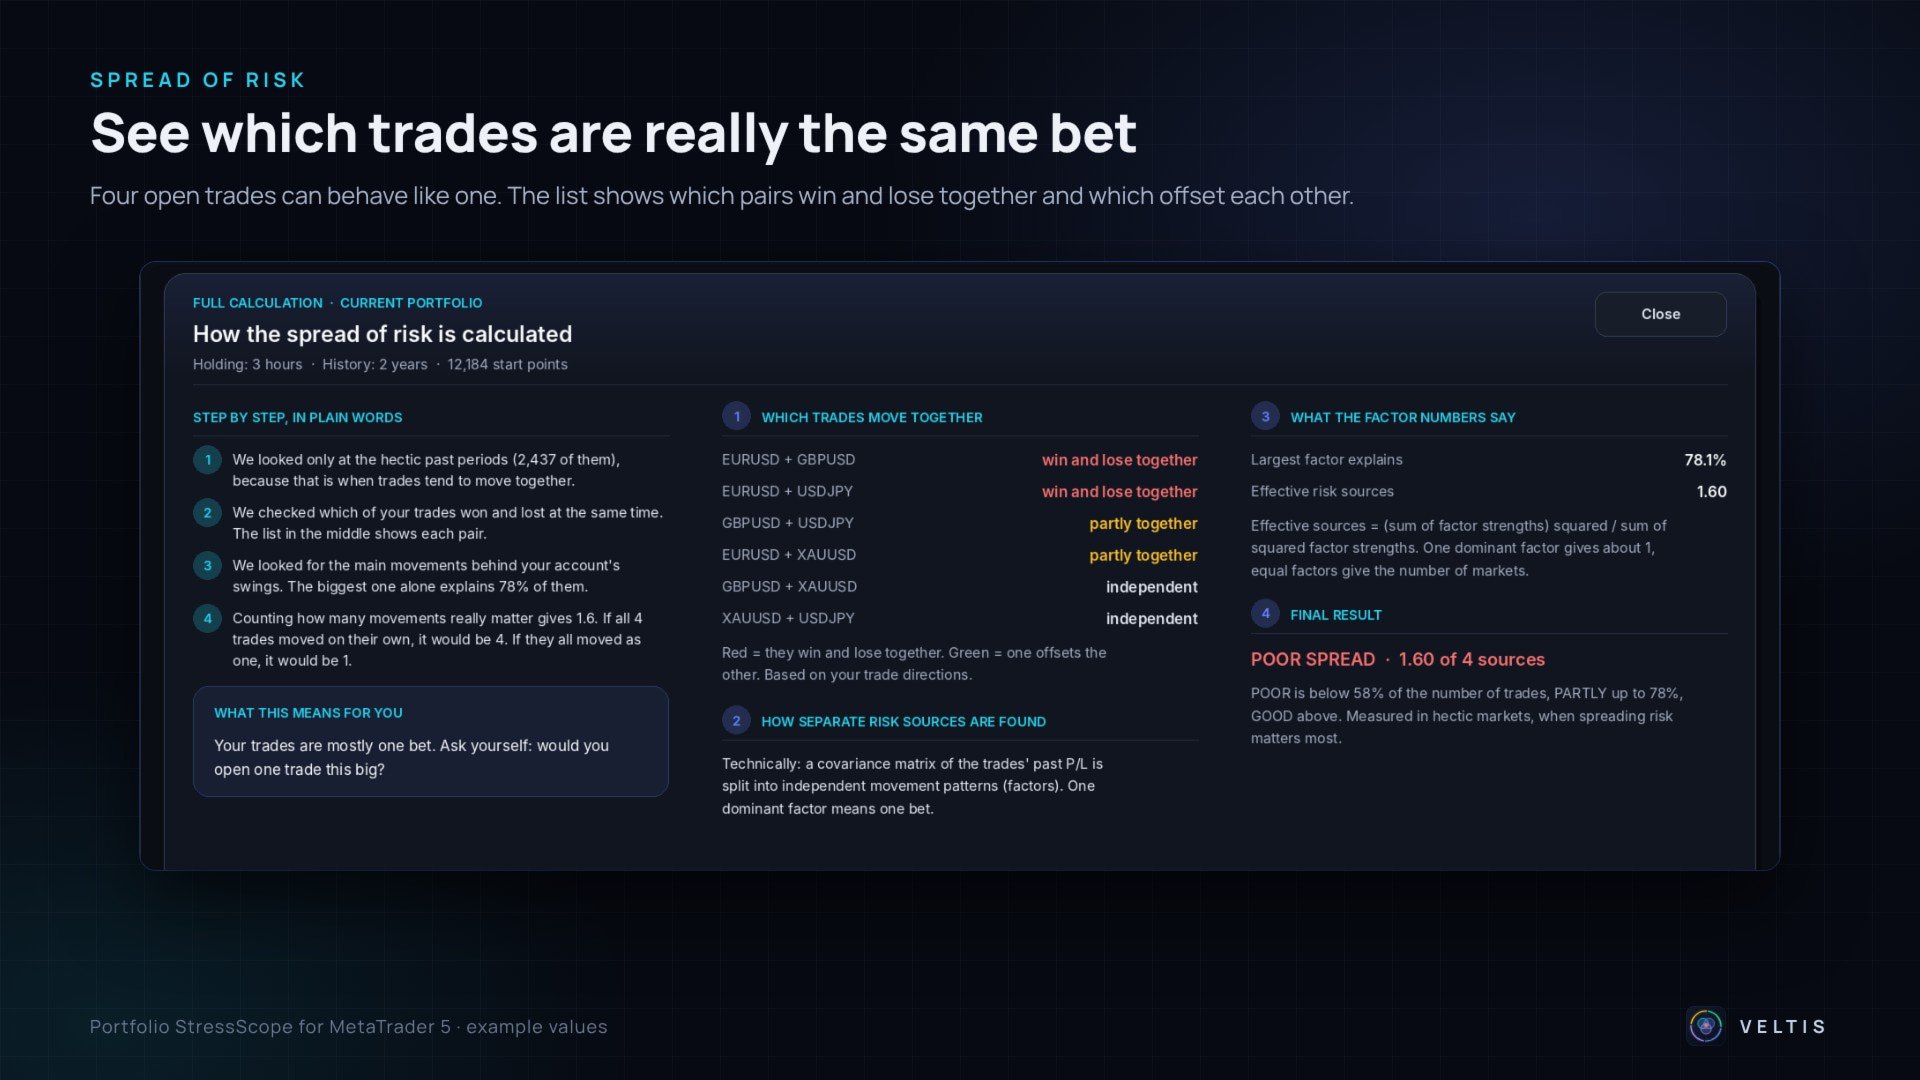
- Spread of risk. The panel shows how many separate trades your positions behave like in hectic markets. Several trades that win and lose together count almost as one. A list shows which pairs of trades move together and which offset each other.
- Hectic markets. The panel compares the swings of your account in calm periods with the most active 20 percent of past periods, for example around news.
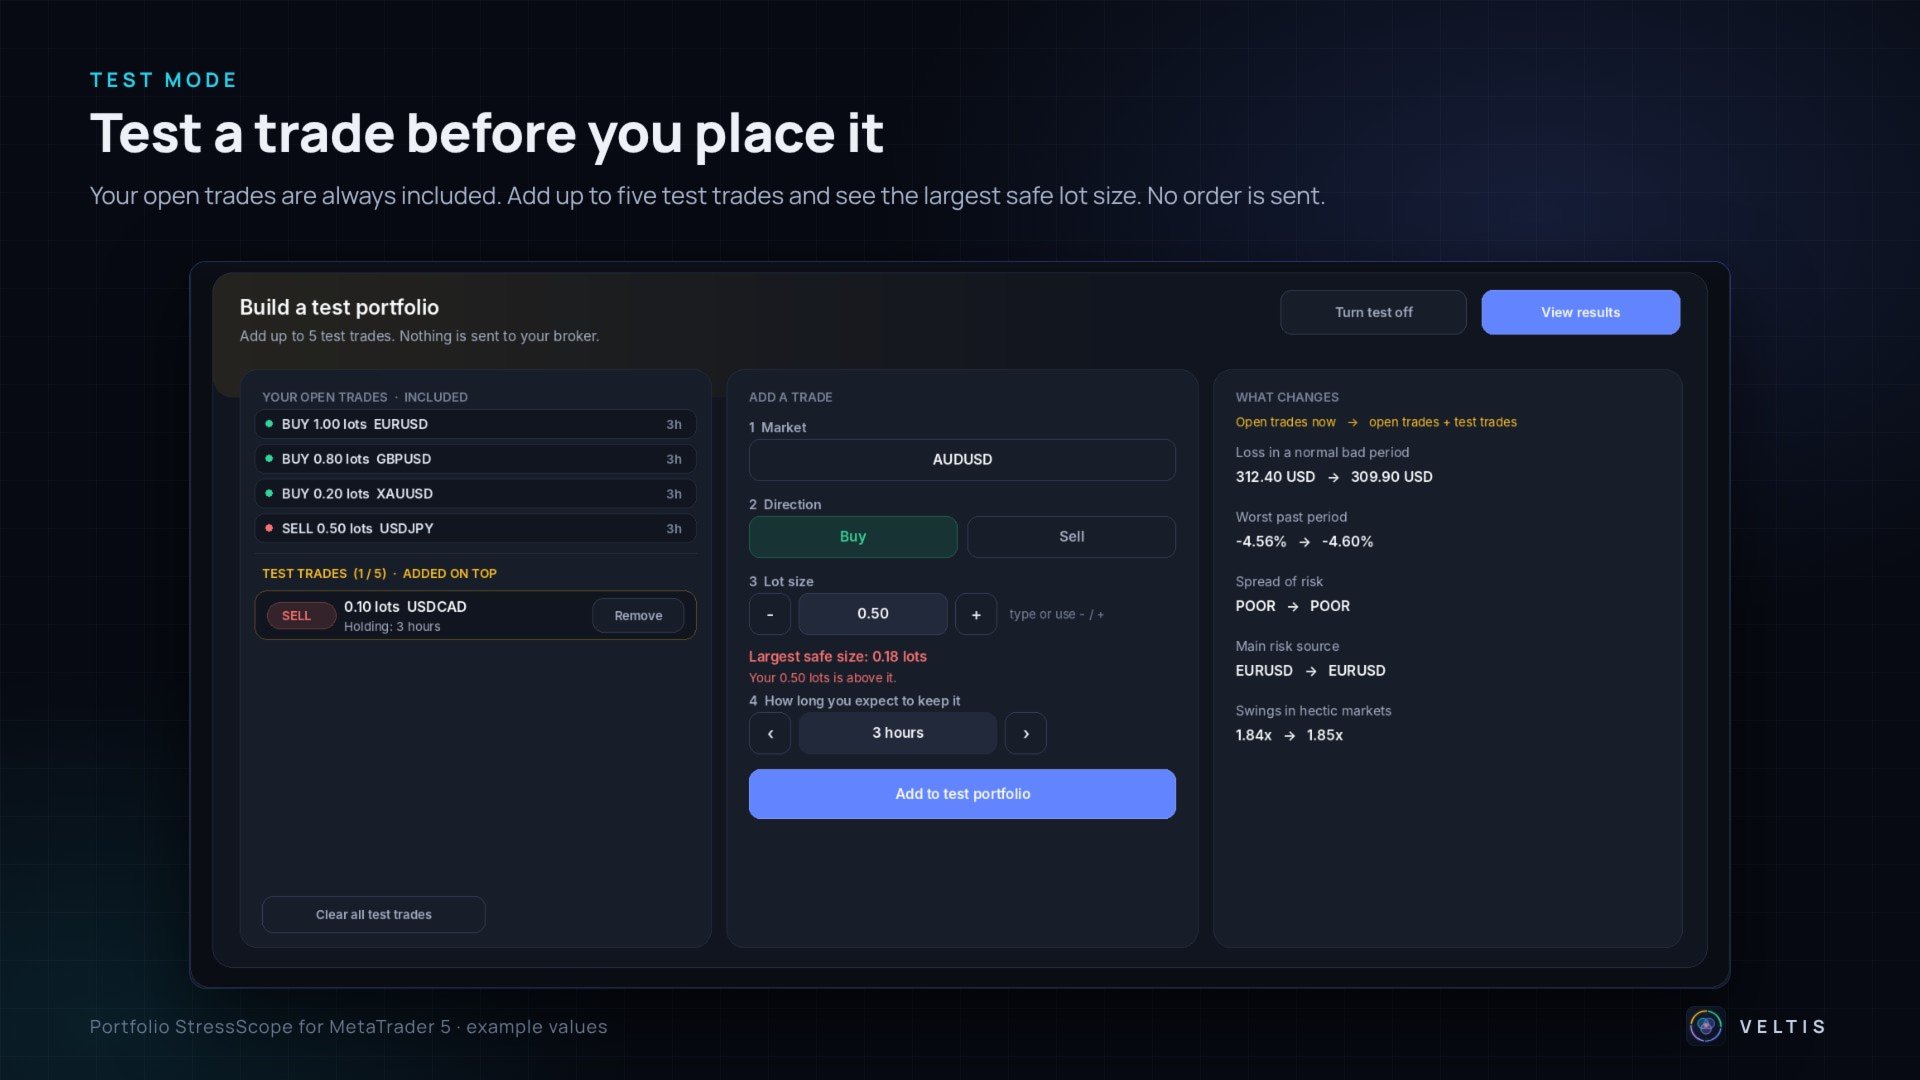
- Test mode. Add up to five virtual trades on top of your open trades and compare the risk before and after. When a loss limit is set, the panel shows the largest lot size at which the worst past period still stays inside the room left. No order is sent.
- Lines on the price chart. On the chart of a market you hold, a line marks the price at which the daily limit would be reached if that market moves there and your other trades move as they usually do with it. A shaded zone shows the normal move range of the market over your holding time.
- Attach the indicator to the chart of one of your markets. No settings are required.
- Set how long you usually keep trades open with the arrows at the top of the panel.
- If your account has loss limits, enter them in the inputs.
- Before a new trade, switch on test mode, add the planned trade and compare the result with your open trades.
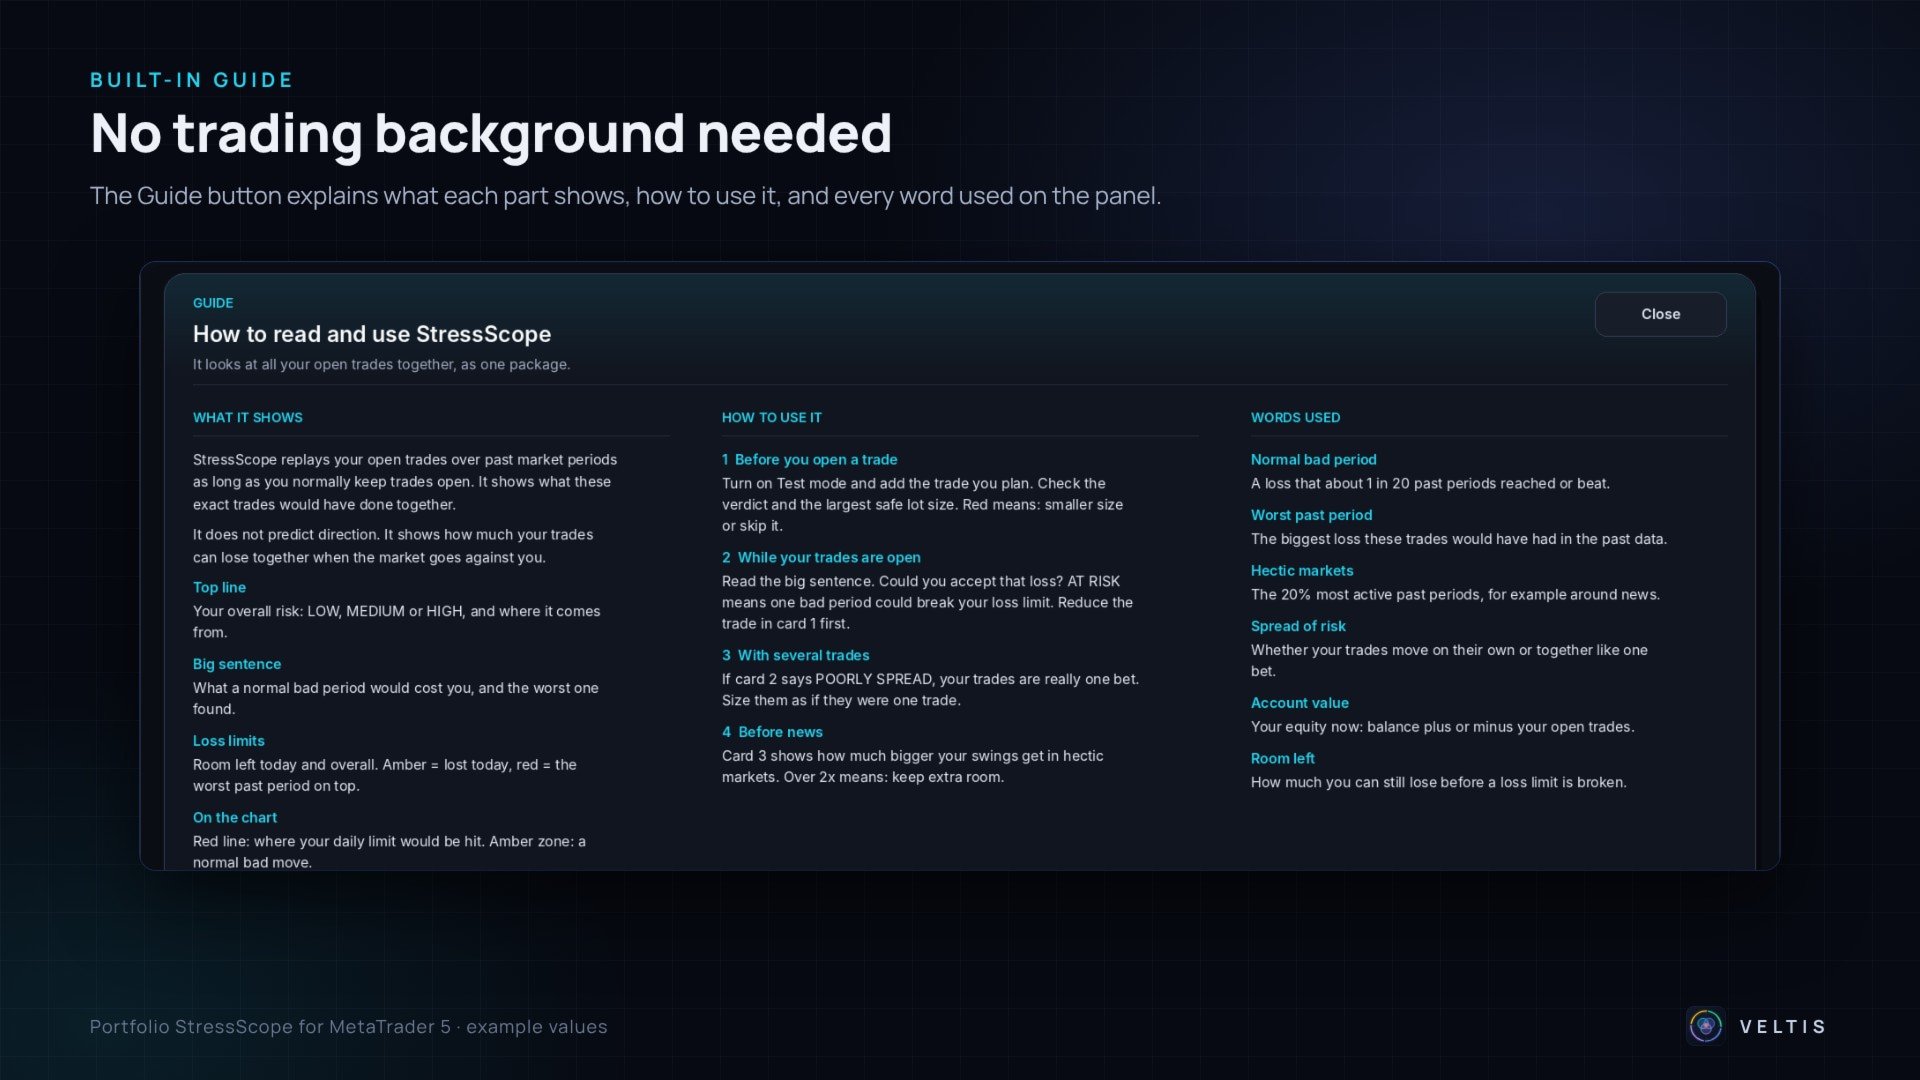
- Click any result card for a step-by-step explanation with your own numbers. The Guide button explains every word used on the panel.
StressScope is intended for traders who keep several positions open at the same time: prop firm traders with daily and overall loss limits, accounts that run several Expert Advisors or signals, and traders of baskets and several currency pairs. For a single trade at a time it adds little information.
Settings
- Portfolio risk: typical holding time from 15 minutes to 5 days, and 6 months to 3 years of history.
- Loss limits: daily limit in percent, overall limit in percent, starting account size and the hour at which the trading day starts.
- Chart: limit line and normal move zone on or off.
- Dashboard: corner, position, automatic or fixed size, text size.
- Advanced: minimum number of past periods, threshold for hectic periods, refresh interval, example trades in the Strategy Tester, export of the calculation as a CSV file.
The results describe how your current positions behaved in past market periods and are not a forecast. Percentages use your account equity at the moment of calculation. Pending orders are not included, and buy and sell positions on the same symbol are netted. Price history is read from H1 bars, or from M15 bars when a holding time is shorter than one hour. In the Strategy Tester the panel loads example trades, because there are no open positions there. Trading involves risk.