RSI Cloud

Free
Meta Trader 5

Professional Marketplace Description (Formal & Detailed)

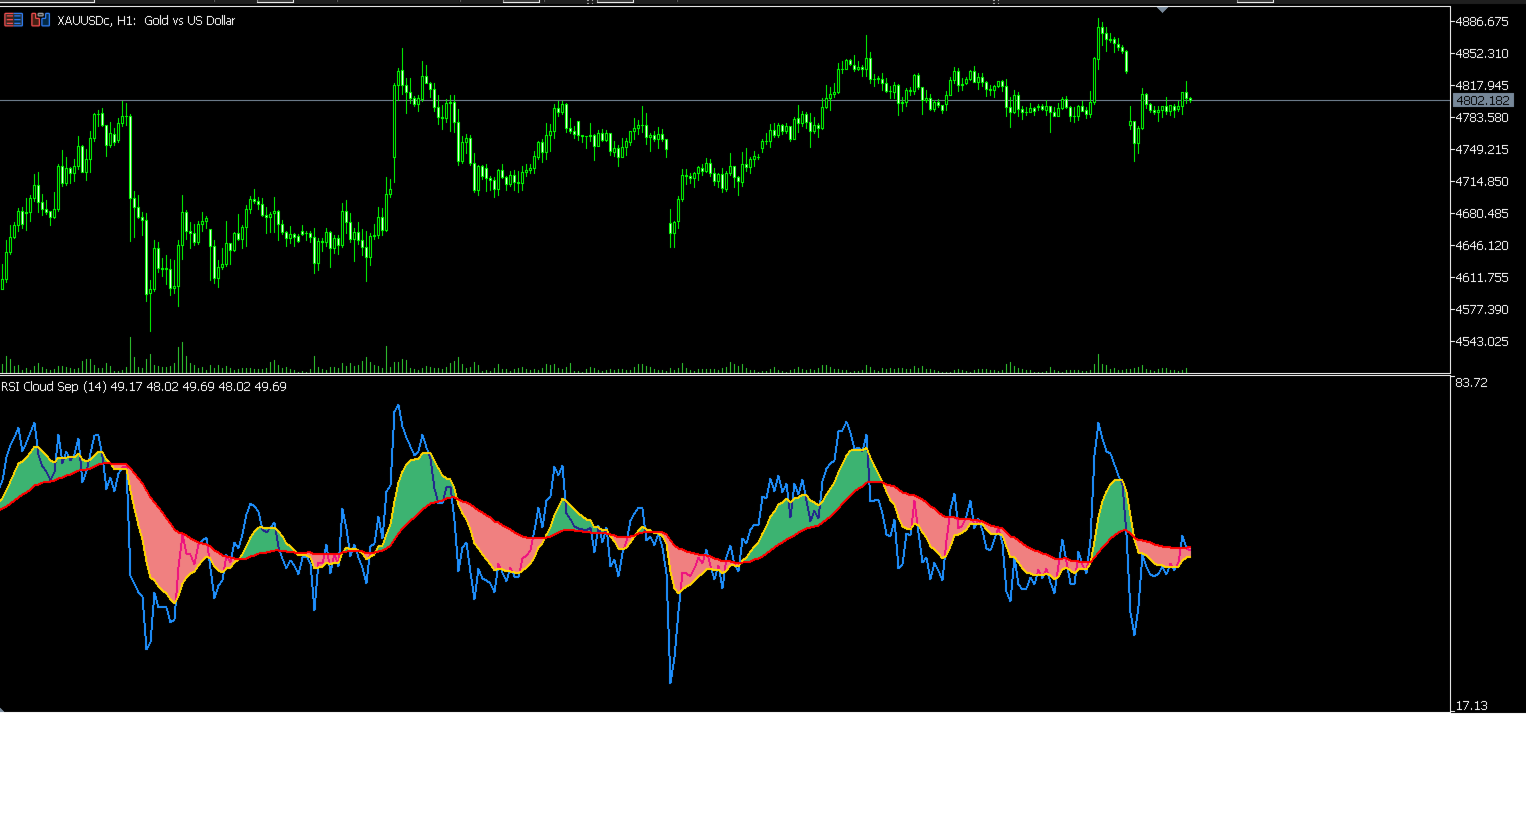
Title: RSI Cloud Momentum & Trend Visualizer

Overview: The RSI Cloud is an advanced trend-following indicator that transforms the classic Relative Strength Index (RSI) into a comprehensive visual system. By utilizing a dual-line approach—typically an RSI line and its smoothed Signal average—it creates a dynamic "Cloud" (filling) that identifies the current market sentiment at a glance.

Key Features:

  • Trend Identification: When the RSI is above the Signal line (Green Cloud), the trend is considered bullish. When below (Red Cloud), bearish momentum prevails.

  • Noise Reduction: The Cloud area helps traders ignore minor RSI fluctuations, focusing instead on significant crossovers and sustained momentum.

  • Overbought/Oversold Context: Maintains the core functionality of RSI while providing a clearer picture of whether the price is extending within a trend or preparing for a reversal.

  • Clean Visualization: Designed for high-speed decision-making with aesthetic color filling between the fast and slow components.


Yazarın diğer ürünleri
Feature-Focused Title: Professional Trade Execution & Risk Management Panel Overview: The Trade Execution Tool is a high-performance utility designed for manual and semi-algorithmic traders who prioritize speed and precision. This comprehensive dashboard streamlines order entry, management, and bulk closing operations, allowing you to focus on the market while the tool handles the technical execution. Key Components: Real-time Monitoring: Instantly track Account Number, Broker Spread vs. Max Spr
Professional & Technical  Title: Adaptive Trend Momentum Classifier Overview: The Adaptive Trend Momentum Classifier is a sophisticated trend-following tool designed to filter market noise and provide clear, actionable signals. Unlike standard moving averages, this indicator employs a color-coded algorithm that instantly identifies shifts in market direction and trend strength. Key Features: Dynamic Trend Visualization: The indicator utilizes a dual-color scheme ( Blue for Bullish , Red for Bear
Dual MA Cloud Trend Ribbon Overview: The Dual MA Cloud is a trend-following visualization tool that uses two distinct moving average ribbons to identify market direction and momentum. By filling the space between fast and slow averages, it provides a clear "cloud" that acts as dynamic support and resistance. How it works: Fast Cloud (Pink/Red): Represents short-term momentum. When the price is above this cloud, short-term bulls are in control. Slow Cloud (Light Blue): Represents the long-term tr
Filtrele:
Değerlendirme yok
Değerlendirmeye yanıt