HMA with notifications MT5
- Göstergeler
- Sergey Sapozhnikov
- Sürüm: 21.11
- Güncellendi: 30 Kasım 2021
- Etkinleştirmeler: 5
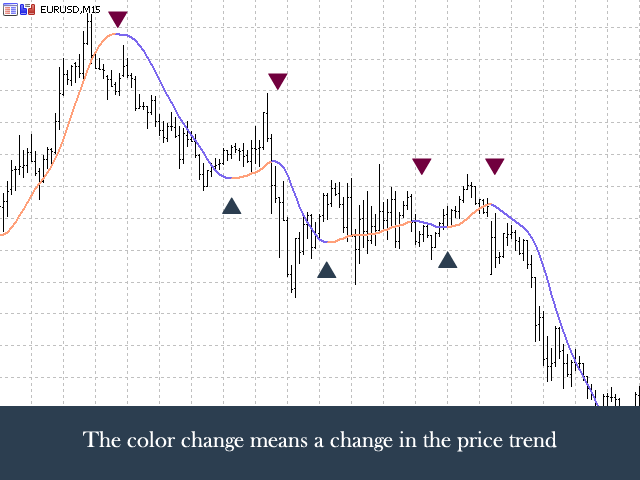
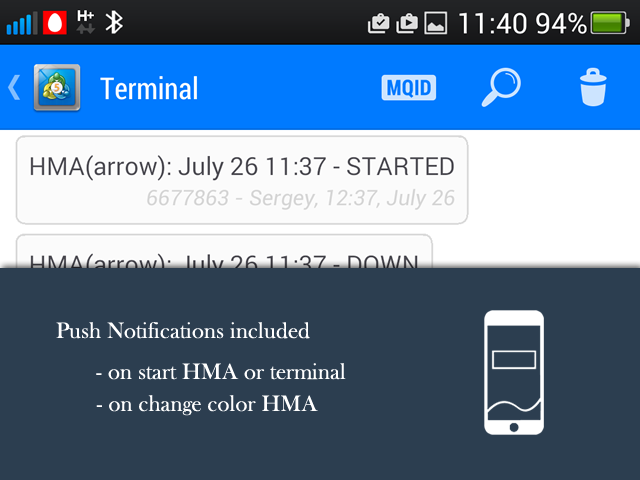
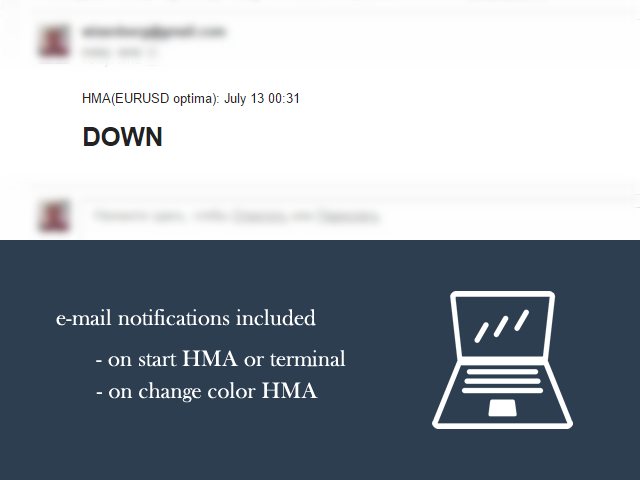
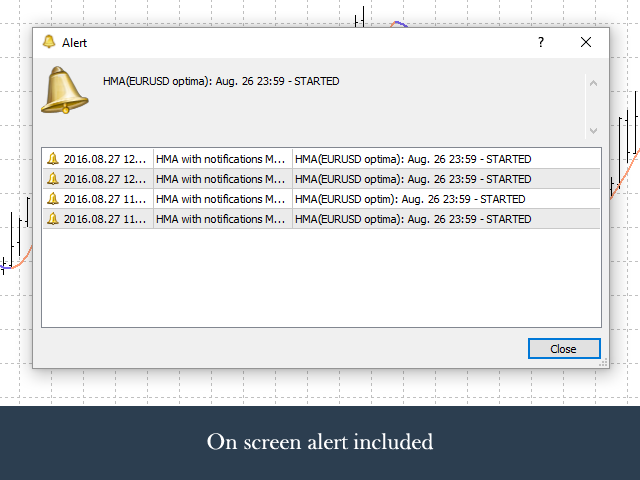
Alan Hull's moving average, more sensitive to the current price activity than the normal MA. Reacts to the trend changes faster, displays the price movement more clearly. When the indicator color changes, it sends a push notification to the mobile device, a message to the email and displays a pop-up alert.
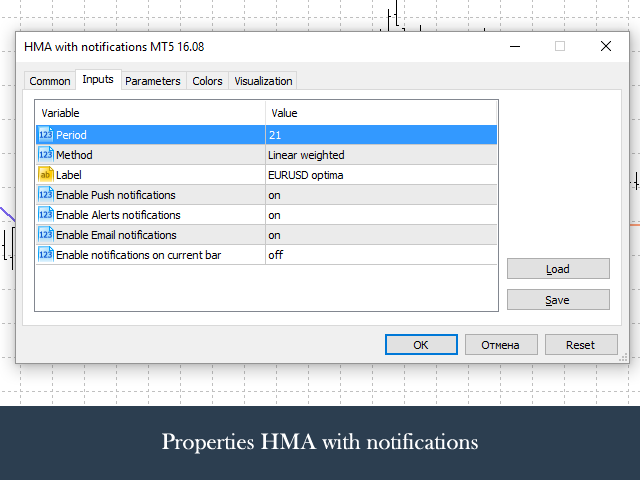
Parameters
- Period - smoothing period, recommended values are from 9 to 64. The greater the period, the smoother the indicator.
- Method - smoothing method
- Label - text label used in the message. Set different labels for instance of the indicator used in the terminal.
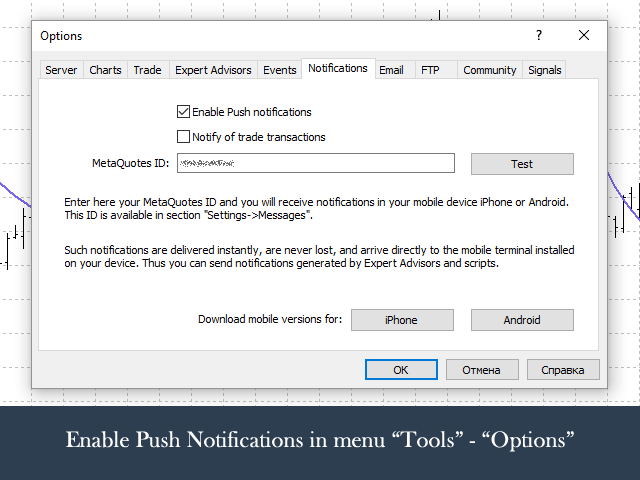
- Enable Push notifications - enable sending push notifications to the mobile terminal
- Enable Alerts notifications - enable displaying pop-up alerts
- Enable Email notifications - enable sending notifications to email
- Enable notifications on current bar - enable sending messages when the color changes on the current bar.
If you use multiple HMA indicators simultaneously, use the 'Label' to distinguish their messages. For example, "EURUSD H1", "EURUSD H4", "optimized", "slow", "GBPUSD test", etc.
In order for push notifications to be sent on your mobile device, install the mobile version of MetaTrader and specify its MQID in the settings of the terminal. More details on setting up push notifications can be found here.
In order for notifications to be sent on your email, enable sending emails in the terminal settings. Also, specify the email login and password in the settings. For example, if you use the GMail service, enter in "SMTP server": "smtp.gmail.com:465", in "SMTP login": your email address, "SMTP password": your email password, "From": your address one more time, "To": address again. Press the 'Test' button to check the correctness of settings.