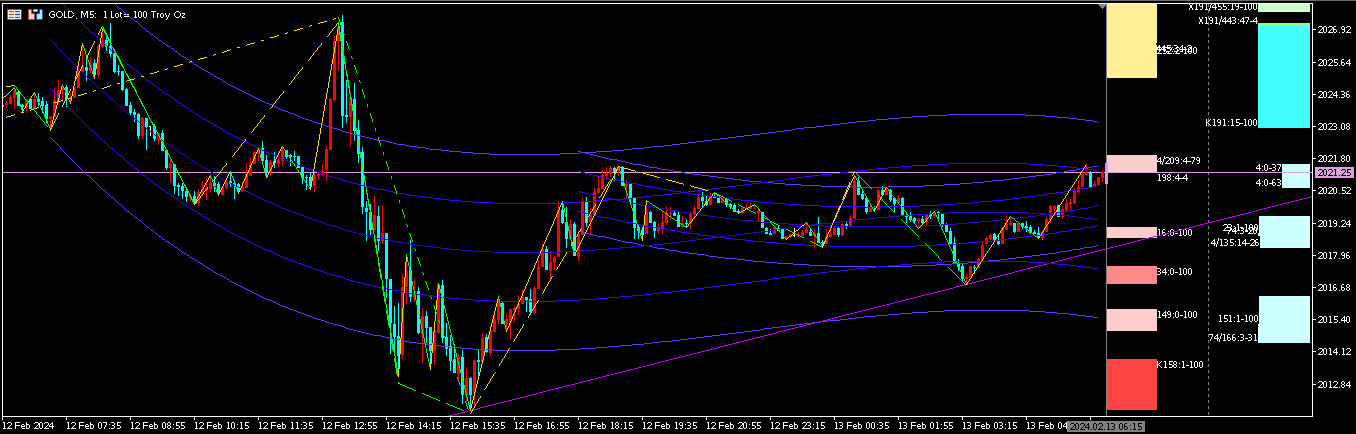
Multilevel Support and Resistance Zones
- Göstergeler
- Zheng Chen Liang
- Sürüm: 2.0
- Etkinleştirmeler: 10
The is the indicator for multilevel support and resistance zones, working on any symbol in any period.
Its execution algorithms and speed are optimized.
* The 1st-level support/resistance:
- Fractal low/high shown by green & gold solid lines in the main chart;
- Support/resistance zones shown by light cyan & light red blocks on the right panel;
* The 2nd-level support/resistance
- Fractal low/high shown by green & gold dash lines in the main chart;
- Support/resistance zones shown by cyan & red blocks on the right panel;
- Trendline shown by purple lines (if exists);
* The 3rd-level support/resistance
- Fractal low/high shown by green & gold dash-dot lines in the main chart;
- Support/resistance zones shown by dark cyan & dark red blocks on the right panel;
* The candle unit i.e. 240-candle MA of (high - low) is shown by the small violet bar.
* The 2nd-order and 3rd-order polynomial grids are shown in dark blue curves.
* The default color scheme:
- Uptrend or demand in red & gold colors;
- Downtrend or supply in cyan & green colors;
* If the user wants to customize the color scheme or else parameters please contact the author for the code.