• Genel bakış
  • İncelemeler
  • Yorumlar
  • Yenilikler

Fractals Higher Timeframe

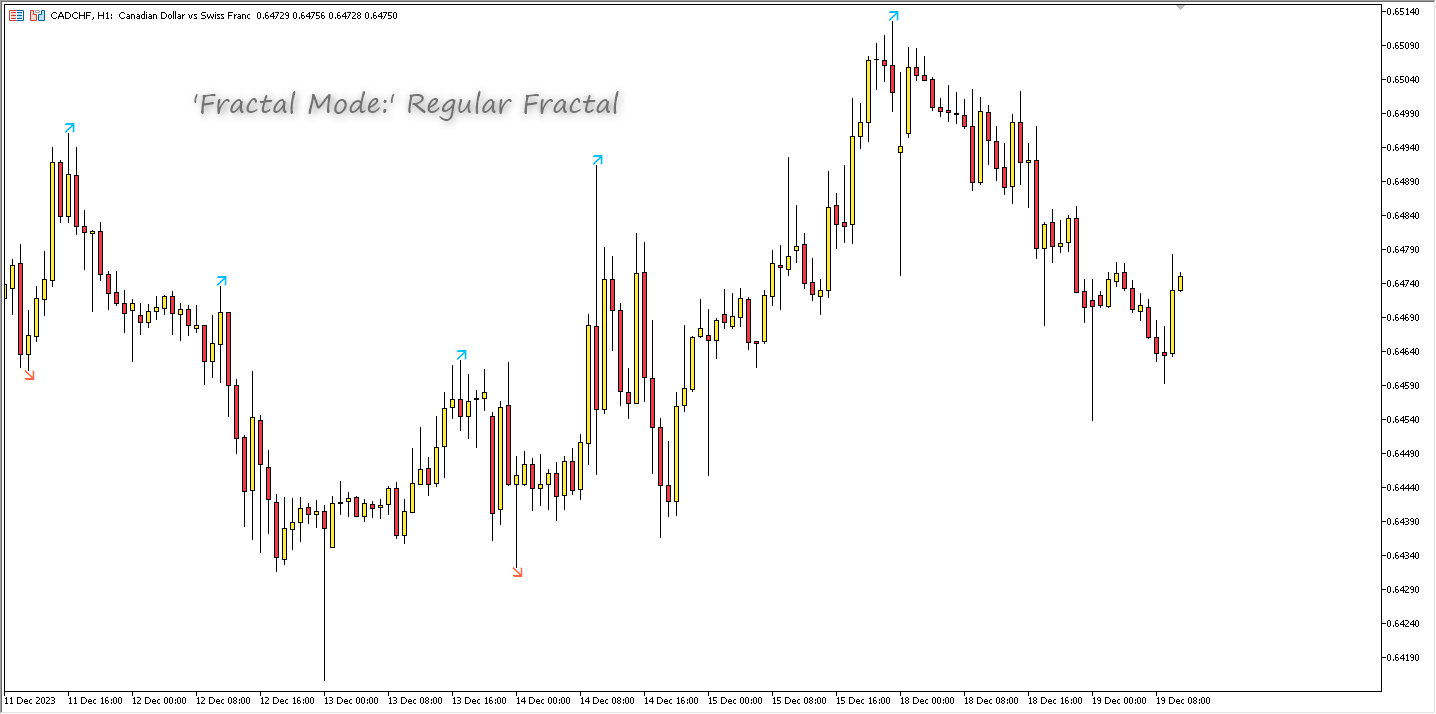
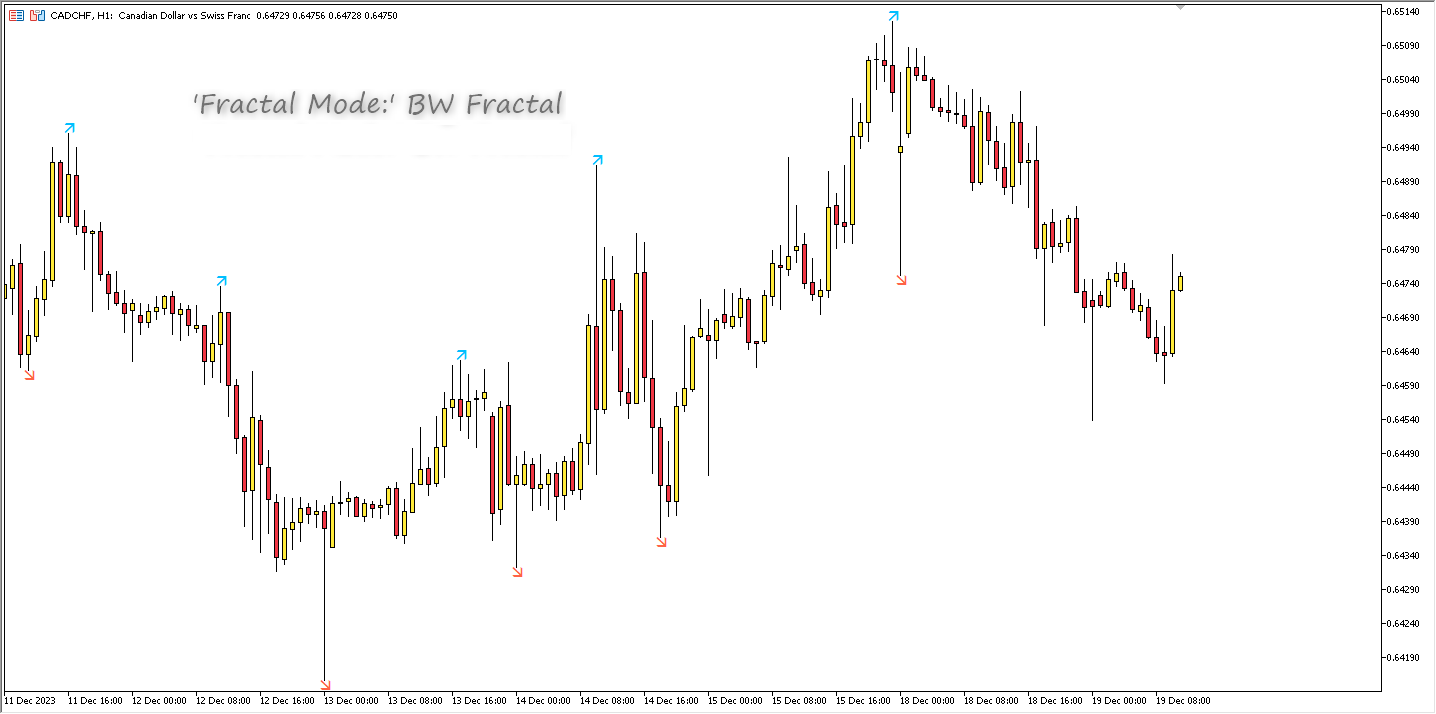
Gösterge daha yüksek zaman dilimindeki Fraktalları gösterir. İki tür Fraktal görüntülemek mümkündür: 'Normal Fraktal' ve 'BW Fraktal'.
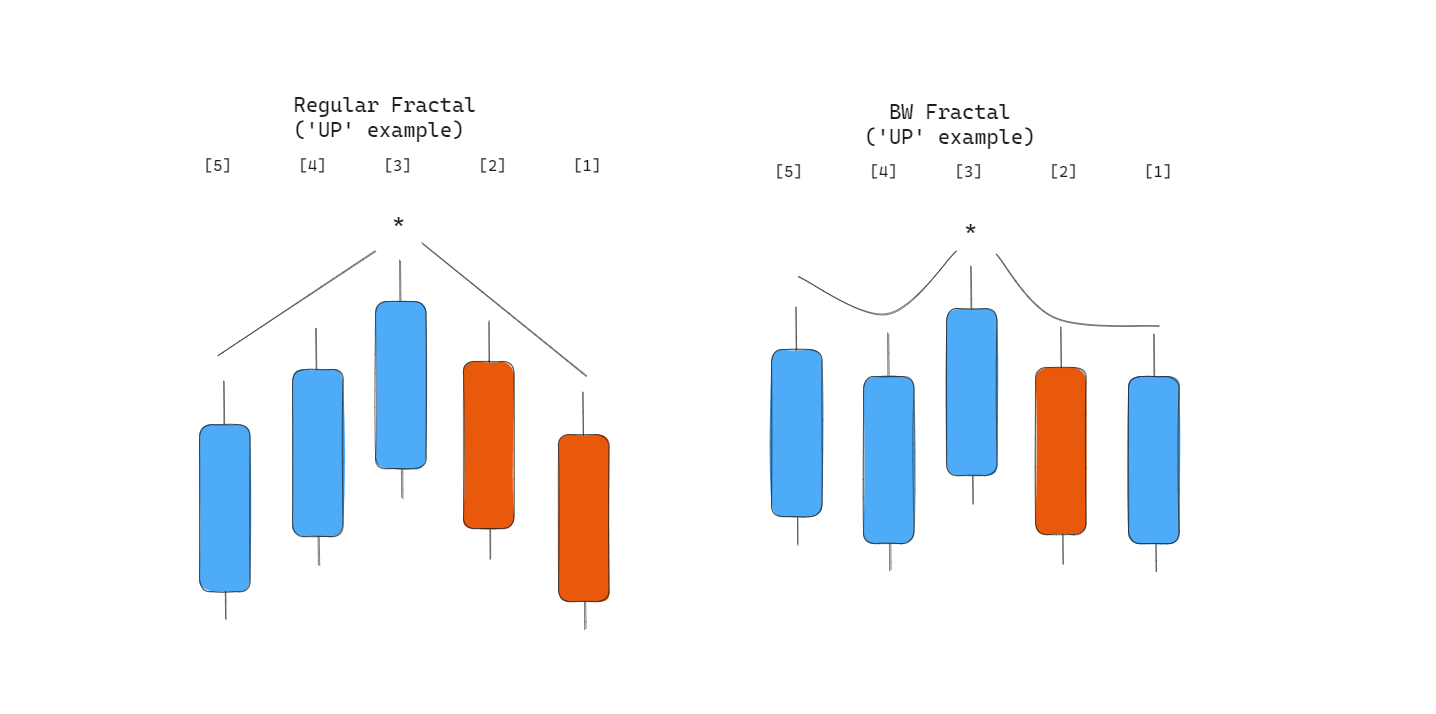
Fraktal 'UP' oluşumunu düşünün.
'Düzenli Fraktal', her bir sonraki 'yüksek' fiyatın (orta çubuğun solunda ve sağında) daha küçük olduğu çok katı bir Fraktaldır. Oysa 'BW Fractal'da tek bir koşul vardır: Merkezi çubuğun (fiyatı 'yüksek') en yüksek olması gerekir. Görsel olarak bu iki mod arasındaki fark diyagram 1'de görülebilir.
'Daha Yüksek Zaman Çerçevesi' parametresi mevcut olandan daha büyük olmalıdır; bu gereklilik karşılanmazsa, hatanın açıklamasını içeren bir Uyarı verilecek ve gösterge çalışmayacaktır. Ayrıca optimizasyon amacıyla arama yalnızca yeni çubukta gerçekleştirilir.
Ayrıca 'İndirme geçmişini zorla' seçeneğini de göz ardı edemem - bu seçenek hafta sonları iyi çalışır: yüksek zaman aralığı geçmişini zorla indirir.


Önerilen ürünler
Owl Smart Levels MT5
Sergey Ermolov
4.47 (36)
MT4 versiyonu  |  FAQ Owl Smart Levels Indicator , Bill Williams'ın gelişmiş fraktalları , piyasanın doğru dalga yapısını oluşturan Valable ZigZag ve kesin giriş seviyelerini gösteren Fibonacci seviyeleri gibi popüler piyasa analiz araçlarını içeren tek gösterge içinde eksiksiz bir ticaret sistemidir. pazara ve kar elde edilecek yerlere. Stratejinin ayrıntılı açıklaması Gösterge ile çalışma talimatı Baykuş Yardımcısı ticaretinde Danışman Yardımcısı Kullanıcıların özel sohbeti -> Satın aldıktan
Trend Channel is a Forex trend arrow indicator for identifying potential entry points. I like it, first of all, because it has a simple operating mechanism, adaptation to all time periods and trading tactics. Created based on a regression channel with filters. We display the signals of the Trend Channel indicator on the price function chart using a mathematical approach. How it works: when the price breaks through the overbought/oversold zone (channel levels), a buy or sell signal is generate
Noize Absorption Index - is the manual trading system that measures the difference of pressure between bears forces and bulls forces. Green line - is a noize free index that showing curent situation. Zero value of index shows totally choppy/flat market.Values above zero level shows how powerfull bullish wave is and values below zero measures bearish forces.Up arrow appears on bearish market when it's ready to reverse, dn arrow appears on weak bullish market, as a result of reverse expectation.
LT Rainbow Trend
Thiago Duarte
5 (1)
Do you, like me, like to trade with the trend? Then this indicator will help you! Rainbow Trend is a trend indicator, which uses several Moving Averages on the chart. It measures different trend strenght zones for different periods: very long term, long term, mid term, short term and very short term. Each zone has its color, and it is possible to have sound alert when the prices leaves a zone and enters another. Its configuration is very simple. If you find any bug or have any suggestions, co
Features All Ichimoku Signals (Selectable) : Display all reliable signals generated by the Ichimoku indicator. You can choose which signals to view based on your preferences. Filter by Signal Strength : Sort signals by their strength—whether they are weak, neutral, or strong. Live Notifications : Receive real-time notifications for Ichimoku signals. Transparent Cloud : Visualize the Ichimoku cloud in a transparent manner. Available Signals Tenkensen-Kijunsen Cross Price-Kijunsen Cross Pri
Trend Side - trendi belirlemek için teknik bir gösterge. Birkaç tam teşekküllü ticaret stratejisi kümesidir. Gösterge, gelişmiş bir trend filtreleme sistemi kullanır, istatistiksel bir panele sahiptir, giriş ve çıkış seviyelerini hesaplar ve dinamik Takip Durdurma seviyesini hesaplar. Her tür sembol için uygundur, sinyallerini ve sonuçlarını asla yeniden çizmez. Profesyonel trend ticareti için kapsamlı bir araç. Trend Side göstergesi seti ayrıca Andrews Trend Scanner'ı içerir - çok para birimi
Premium seviye, %80'den fazla doğru tahmin doğruluğuna sahip benzersiz bir göstergedir! Bu gösterge en iyi Ticaret Uzmanları tarafından iki aydan uzun süredir test edilmiştir! Yazarın göstergesini başka hiçbir yerde bulamazsınız! Ekran görüntülerinden bu aracın doğruluğunu kendiniz görebilirsiniz! 1, sona erme süresi 1 mum olan ikili opsiyon ticareti için harikadır. 2 tüm döviz çiftleri, hisse senetleri, emtialar, kripto para birimleri üzerinde çalışır Talimatlar: Kırmızı ok görün
Öncelikle belirtmek gerekir ki bu Ticaret Göstergesi Yeniden Çizim Yapmaz, Gecikmez ve Gecikme Göstermez, bu da hem manuel hem de robot ticareti için ideal hale getirir. Atom Analisti, Piyasada Daha İyi Bir Avantaj Bulmak İçin Fiyatın Gücünü ve Momentumunu Kullanan PA Fiyat Hareketi Göstergesidir. Gürültüleri ve Yanlış Sinyalleri Kaldırmaya ve Ticaret Potansiyelini Artırmaya Yardımcı Olan Gelişmiş Filtrelerle Donatılmıştır. Birden fazla katmanlı karmaşık göstergeler kullanarak, Atom Analisti
KDJ Index 4   交易实用必备工具指标 波浪自动计算指标,通道趋势交易 完美的趋势-波浪自动计算通道计算 , MT4版本 完美的趋势-波浪自动计算通道计算 , MT5版本 本地跟单复制交易 Easy And Fast Copy , MT4版本 Easy And Fast Copy , MT5版本 本地跟单复制交易 模拟试用 Easy And Fast Copy , MT4 模拟账号运行 Easy And Fast Copy , MT5 模拟账号运行 "Cooperative QQ:556024  "  "Cooperation wechat:556024"  "Cooperative email:556024@qq.com" 强烈推荐趋势指标, 波浪的标准自动计算   和   波浪的标准自动计算MT5版本     KDJ指标又叫 随机指标 ,是一种相当新颖、实用的技术分析指标,它起先用于期货市场的分析,后被广泛用于股市的中短期趋势分析,是期货和股票市场上最常用的技术分析工具。 随机指标KDJ一般是用于股票分析的统计体系,根据统计学原理,通过一个特定的周期(常为9日、9周等
Double HMA MTF for MT5
Pavel Zamoshnikov
5 (2)
This is an advanced multi-timeframe version of the popular Hull Moving Average (HMA) Features Two lines of the Hull indicator of different timeframes on the same chart. The HMA line of the higher timeframe defines the trend, and the HMA line of the current timeframe defines the short-term price movements. A graphical panel with HMA indicator data from all timeframes at the same time . If the HMA switched its direction on any timeframe, the panel displays a question or exclamation mark with a tex
Madx Cobra   Madx Cobra Indicator. Create to traders both experienced and inexperienced to use it because it is a basic indicator How to use : Setting Indicator 1. MA Fast  : Moving Average fast (10) 2. MA Slow :  Moving Average Slow control trend markets.(200) 3. ADX : Control trend(5) 4. For alert you can set to alert Next bar or instant bars.  When arrow sky blue show or arrow up, you can entry order "Buy" or "Long" and arrow red show or arrow down, you can entry order "Sell" or "Short"
Point Black
Ignacio Agustin Mene Franco
Black Card Pack indicator 5/1 point black It has the strategy of professional bollingers where each arrow gives you a different entry signal. It is used to operate in m1 and in d1 It is used for scalping and intraday, modified for forex markets ! suitable for all pairs modified for synthetic index markets suitable for all pairs! Ideal for volatility and jumps!
Description : Rainbow EA MT5 is a simple Expert advisor based on   Rainbow MT5 indicator witch is based on Moving average with period 34. The indicator is incorporated in the EA, therefore, it is not required for the EA to operate, but if you wish, you can download it from   my product page . The Expert Advisor settings are as follows : Suitable for Timeframes up to H1 The parameters below can be set according to your trading rules. StopLoss ( Stop Loss in pips) TakeProfit ( Take Profit in pi
This plots  Fibonacci deviation levels above and below a moving average of the price. Companion indicator to the " Golden Bull Wave Trader "  expert advisor which uses volume\price trend to determine price reversals. https://www.mql5.com/en/market/product/56291 The expert advisor and this indicator were created in order to: Identify ideal and repeatable trade entries with high level of certainty Create a day trading strategy which doesn’t require a hard SL and TP Use alternate risk management me
This Indicator help you to identify trends and patterns. It shows the short-term, medium-term and long-term trend at the same time on the screen. It supports every timeframe except monthly. This indicator NOT implement the ZigZag indicator, but it uses its own algorithm. Supported markets: -         Forex -         Metal -         Energies Spot -         in Energies Futures only o    US Crude Oils -         in Indices Spot only o    US Tech 100 Index o    UK 100 Index o    US Wall Street 30 I
Indicator and Expert Adviser  EA Available in the comments section of this product. Download with Indicator must have indicator installed for EA to work. Mt5 indicator alerts for bollinger band and envelope extremes occurring at the same time. Buy signal alerts occur when A bullish candle has formed below both the lower bollinger band and the lower envelope  Bar must open and close below both these indicators. Sell signal occur when A bear bar is formed above the upper bollinger band and upp
The standard Bollinger Bands indicator has been improved by integrating additional indications from the Standard Deviation indicator (StdDev), which gives an additional filter for confirming trading signals. In addition, the color of the indicator's lines shows the beginning of a trend, its development and exhaustion. This indicator has a signal block that notifies the trader of the beginning of the trend on any time frame to which it is attached. Settings Type of messages - select the type of
Ichimoku Aiko MTF
Michael Jonah Randriamampionontsoa
Ichimoku Aiko MTF is a collection of technical indicators that show support and resistance levels, as well as momentum and trend direction. It is a multi-timeframe indicator so you don't need to change the chart timeframe when you want to see the ichimoku clouds on a higher timeframe.  eg. The chart timeframe is M15 and you want to see on the M15 timeframe chart the H1 ichimoku indicators (the ichimoku in Metatrader can't do that) that's why you need to use Ichimoku Aiko MTF.
Trend Monitor MT5
Pavel Zamoshnikov
3.67 (3)
The indicator generates early signals basing on ADX reading data combined with elements of price patterns. Works on all symbols and timeframes. The indicator does not redraw its signals. You see the same things on history and in real time. For better visual perception signals are displayed as arrows (in order not to overload the chart). Features The best results are obtained when the indicator works on two timeframes. For example: M30 – the indicator shows the main trend; M5 – the indicator ge
Order Book, known also as Market Book, market depth, Level 2, - is a dynamically updated table with current volumes of orders to buy and to sell specific financial instument at price levels near Bid and Ask. MetaTrader 5 provides the means for receiving market book from your broker, but in real time only, without access to its history. The indicator OrderBook Cumulative Indicator accumulates market book data online and visualizes them on the chart. In addition, the indicator can show the market
Note : i only sell this EA on MQL5, any other sellers is fake. Orbit Rage Final, a cutting-edge trading strategy meticulously designed around the bull/bear candle approach and divergence analysis. This powerful tool is engineered to empower you to shape the life you desire. To embark on this transformative journey, simply download and seamlessly integrate it into your MetaTrader 4 platform by placing it in the experts advisors folder. Orbit Rage Final revolutionizes trading by offering a risk-f
Trend Yakalayıcı: Alarm İndikatörü ile Trend Yakalayıcı Stratejisi, piyasa trendlerini ve potansiyel giriş ve çıkış noktalarını belirlemede yardımcı olan çok yönlü bir teknik analiz aracıdır. Piyasa koşullarına uyum sağlayarak trend yönünün net görsel temsili için dinamik bir Trend Yakalayıcı Stratejisi sunar. Tüccarlar tercihlerine ve risk toleranslarına göre parametreleri özelleştirebilirler. Gösterge, trendleri tanımlamaya yardımcı olur, potansiyel ters dönüşleri sinyaller, trailing stop m
FREE
This unique indicator automatically builds Wolfe Waves and features a highly efficient trading strategy.   Use If number 5 appears, wait till the first candle is closed behind Moving Average, then look at the three center lines showing what lot volume should be used if the fifth dot crossed the line 25%. The candle is closed behind Moving Average, and then we open a trade with the lot: = (Let's apply the lot of, say, (0.40), divide it into four parts and open a quarter of the lot (0.10)). If the
Welcome to the Ultimate Harmonic Patterns recognition indicator that is focused to detect advanced patterns. The Gartley pattern, Bat pattern, and Cypher pattern  are popular technical analysis tools used by traders to identify potential reversal points in the market. Our Ultimate Harmonic Patterns recognition Indicator is a powerful tool that uses advanced algorithms to scan the markets and identify these patterns in real-time. With our Ultimate Harmonic Patterns recognition Indicator, you
Bu, fiyat etiketleriyle (devre dışı bırakılabilir)   Gelişmiş ZigZag Dinamik   ve/veya   Genişletilmiş Fraktallar   göstergesi ekstremumlarına dayalı destek ve direnç seviyelerinin bir MTF göstergesidir. MTF modu için daha yüksek TF'ler seçilebilir. Varsayılan olarak, seviyeler ZigZag gösterge noktalarına göre oluşturulur. Fraktal gösterge noktaları da ZigZag ile birlikte veya onun yerine kullanılabilir. Kullanımı basitleştirmek ve CPU zamanından tasarruf etmek için, açılışta her çubuk için bir
Renko Gold
Ignacio Agustin Mene Franco
Renko Gold! clearly indicates the floors and ceilings where it goes from 4 lines, the line below that marks the floor in green confirming with the thinnest line clarifies the purchase entry, the same is for sale, the top line marks the ceiling and the thinnest red line marks the sale, This indicator works for all temporalities! For Forex and Synthetic Indices markets! It also works for crypto markets! Good profit! World Investor.
Gösterge, piyasa analizi için en etkili araçlardan biri olan Fibonacci destek ve direnç seviyelerini otomatik olarak hesaplar ve çizer. Hesaplama, seçilen dönem ve zaman çerçevesi için ortalama fiyat verilerini kullanır. Bu süre için minimum ve maksimum hareketin başlangıcı ve sonu olarak alınır. Fibonacci seviyeleri, etrafında fiyat hareketinin yavaşlayabileceği veya tersine dönebileceği potansiyel referans noktalarını görmenizi sağlar, yani bunlar daha fazla hareketi tahmin etmek ve ayrıca sto
Your Trend Friend
Luigi Nunes Labigalini
The trend is your friend! Look at the color of the indicator and trade on that direction. It does not  repaint. After each candle is closed, that's the color of the trend. You can focus on shorter faster trends or major trends, just test what's most suitable for the symbol and timeframe you trade. Simply change the "Length" parameter and the indicator will automatically adapt. You can also change the color, thickness and style of the lines. Download and give it a try! There are big movements
WanaScalper
Isaac Wanasolo
1 (1)
A scalping indicator based on mathematical patterns, which on average gives signals with relatively small SL, and also occasionally helps to catch big moves in the markets (more information in the video) This indicator has three main types of notifications: The first type warns of a possible/upcoming signal on the next bar The second type indicates the presence of a ready signal to enter the market/open a position The third type is for SL and TP levels - you will be notified every time price r
Renko Plus
Eadvisors Software Inc.
With Renko Plus you can use the features in the Indicator functionality, just add it to the Metatrader5 chart.             The Renko chart is a type of chart, developed by the Japanese, that is constructed using price movement rather than standardized prices and time intervals like most charts. It is believed to be named after the Japanese word for bricks, "renga", as the graphic looks like a series of bricks.             A new brick is created when the price moves a specified p
Bu ürünün alıcıları ayrıca şunları da satın alıyor
Öncelikle, bu Ticaret Sistemi'nin Non-Repainting, Non-Redrawing ve Non-Lagging Göstergesi olduğunu vurgulamak önemlidir, bu da hem manuel hem de robot ticareti için ideal hale getirir. "Smart Trend Trading System MT5", yeni ve deneyimli tüccarlar için özelleştirilmiş kapsamlı bir ticaret çözümüdür. 10'dan fazla premium göstergeyi birleştiriyor ve 7'den fazla sağlam ticaret stratejisi sunuyor, bu da çeşitli piyasa koşulları için esnek bir seçim yapar. Trend Takip Stratejisi: Trendleri etkili bir
Quantum Trend Sniper
Bogdan Ion Puscasu
5 (37)
Tanıtım       Kuantum Trend Keskin Nişancı Göstergesi   , trend tersine dönmeleri belirleme ve ticaret yapma şeklinizi değiştiren çığır açan MQL5 Göstergesi! 13 yılı aşkın ticaret tecrübesine sahip deneyimli tüccarlardan oluşan bir ekip tarafından geliştirilmiştir.       Kuantum Trend Keskin Nişancı Göstergesi       trend dönüşlerini son derece yüksek doğrulukla belirlemenin yenilikçi yolu ile ticaret yolculuğunuzu yeni zirvelere taşımak için tasarlanmıştır. ***Kuantum Trend Keskin Nişancı Gö
FX Volume MT5
Daniel Stein
4.94 (17)
Sabah Brifingimiz aracılığıyla ayrıntılar ve ekran görüntüleri ile günlük piyasa güncellemenizi alın burada mql5 ve on Telegram ! FX Volume, bir brokerin bakış açısından piyasa duyarlılığı hakkında GERÇEK bir fikir veren İLK ve TEK hacim göstergesidir. COT raporlarından çok daha hızlı bir şekilde, brokerlar gibi kurumsal piyasa katılımcılarının Forex piyasasında nasıl konumlandıklarına dair harika bilgiler sağlar. Bu bilgileri doğrudan grafiğinizde görmek, ticaretiniz için gerçek oyun değiştir
Trend Screener Pro MT5
STE S.S.COMPANY
4.89 (61)
Trend Göstergesi, Trend Alım Satım ve Filtreleme için Çığır Açan Benzersiz Çözüm, Tüm Önemli Trend Özellikleriyle Tek Bir Araç İçinde Yerleştirildi! Forex, emtialar, kripto para birimleri, endeksler ve hisse senetleri gibi tüm sembollerde/araçlarda kullanılabilen %100 yeniden boyamayan çoklu zaman çerçevesi ve Çoklu para birimi göstergesidir. Trend Screener, grafikte noktalarla ok trend sinyalleri sağlayan etkili bir trend trend göstergesidir. Trend analizörü göstergesinde bulunan özellikler: 1.
FX Power MT5 NG
Daniel Stein
5 (4)
Sabah Brifingimiz burada mql5 ve on Telegram! FX Power MT5 NG , uzun zamandır çok popüler olan döviz gücü ölçerimiz FX Power'ın yeni neslidir. Peki bu yeni nesil güç ölçer ne sunuyor? Orijinal FX Power hakkında sevdiğiniz her şey PLUS GOLD/XAU güç analizi Daha da hassas hesaplama sonuçları Ayrı ayrı yapılandırılabilir analiz dönemleri Daha da iyi performans için özelleştirilebilir hesaplama limiti Özel çokluDaha fazlasını görmek isteyenler için örnek ayarlar Her grafikte en sevdiğiniz renkler i
Top indicator for MT5   providing accurate signals to enter a trade without repainting! It can be applied to any financial assets:   forex, cryptocurrencies, metals, stocks, indices .  Watch  the video  (6:22) with an example of processing only one signal that paid off the indicator! MT4 version is here It will provide pretty accurate trading signals and tell you when it's best to open a trade and close it. Most traders improve their trading results during the first trading week with the help of
Öncelikle, bu Ticaret Aracının Non-Repainting, Non-Redrawing ve Non-Lagging Gösterge olduğunu vurgulamakta fayda var, bu da onu profesyonel ticaret için ideal hale getiriyor. Akıllı Fiyat Hareketi Kavramları Göstergesi, hem yeni hem de deneyimli tüccarlar için çok güçlü bir araçtır. İleri ticaret fikirlerini, Inner Circle Trader Analizi ve Smart Money Concepts Ticaret Stratejileri gibi 20'den fazla kullanışlı göstergeyi bir araya getirerek bir araya getirir. Bu gösterge, büyük kurumların tica
RelicusRoad Pro MT5
Relicus LLC
4.82 (22)
Şimdi 147 $ (birkaç güncellemeden sonra 499 $ 'a yükseliyor) - Sınırsız Hesaplar (PC'ler veya Mac'ler) RelicusRoad Kullanım Kılavuzu + Eğitim Videoları + Özel Discord Grubuna Erişim + VIP Durumu PİYASAYA BAKMAK İÇİN YENİ BİR YOL RelicusRoad, forex, vadeli işlemler, kripto para birimleri, hisse senetleri ve endeksler için dünyanın en güçlü ticaret göstergesidir ve yatırımcılara kârlı kalmaları için ihtiyaç duydukları tüm bilgileri ve araçları sağlar. Başlangıç ​​seviyesinden ileri seviyey
Auto Order Block with break of structure based on ICT and Smart Money Concepts Futures Break of Structure ( BoS )             Order block ( OB )            Higher time frame Order block / Point of Interest ( POI )    shown on current chart           Fair value Gap ( FVG ) / Imbalance   ,  MTF      ( Multi Time Frame )    Volume Imbalance     ,  MTF          vIMB Gap’s Equal High / Low’s     ,  MTF             EQH / EQL Liquidity               Current Day High / Low           HOD /
AW Trend Predictor MT5
AW Trading Software Limited
4.76 (55)
Tek bir sistemde trend ve kırılma seviyelerinin kombinasyonu. Gelişmiş bir gösterge algoritması piyasa gürültüsünü filtreler, trendi, giriş noktalarını ve olası çıkış seviyelerini belirler. Gösterge sinyalleri, sinyal geçmişinin etkinliğini gösteren en uygun enstrümanların seçilmesine izin veren bir istatistiksel modüle kaydedilir. Gösterge Kâr Al ve Zararı Durdur işaretlerini hesaplar. Kılavuz ve talimatlar ->   BURAYA   / MT4 versiyonu ->   BURAYA Gösterge ile nasıl ticaret yapılır: Trend Pre
Blahtech Supply Demand MT5
Blahtech Limited
4.57 (14)
Was: $299  Now: $99   Supply Demand uses previous price action to identify potential imbalances between buyers and sellers. The key is to identify the better odds zones, not just the untouched ones. Blahtech Supply Demand indicator delivers functionality previously unavailable on any trading platform. This 4-in-1 indicator not only highlights the higher probability zones using a multi-criteria strength engine, but also combines it with multi-timeframe trend analysis, previously confirmed swings
ICT, SMC, SMART MONEY CONCEPTS, SMART MONEY, Smart Money Concept, Support and Resistance, Trend Analysis, Price Action, Market Structure, Order Blocks, BOS/CHoCH,   Breaker Blocks ,  Momentum Shift,   Supply&Demand Zone/Order Blocks , Strong Imbalance,   HH/LL/HL/LH,    Fair Value Gap, FVG,  Premium  &   Discount   Zones, Fibonacci Retracement, OTE, Buy Side Liquidity, Sell Side Liquidity, BSL/SSL Taken, Equal Highs & Lows, MTF Dashboard, Multiple Time Frame, BigBar, HTF OB, HTF Market Structure
Gann Kare Göstergesi, W.D. Gann tarafından yazılan "Piyasa Tahminleri için Matematiksel Formül" makalesine dayalı güçlü bir piyasa analizi aracıdır. Bu araç, piyasa analizi için matematiksel ve Gann teorilerini kullanarak hassas analizler gerçekleştirir. 144, 90, 52 karelerini ve ayrıca 9 karesini kullanır. Ayrıca, ın 9 karesi ve bu kareyle ilişkili kanallar ve yıldız modelleri için yöntemini içerir. Kullanıcı Kılavuzu ve Uygulama: Bu göstergeleri kullanmadan önce, kullanıcı kılavuzunu okumanız
TPSpro TRENDPRO  - is a trend indicator that automatically analyzes the market and provides information about the trend and each of its changes, as well as giving signals for entering trades without redrawing! The indicator uses each candle, analyzing them separately. referring to different impulses - up or down impulse. Exact entry points into transactions for currencies, crypto, metals, stocks, indices!  -  Version MT4                  DETAILED DESCRIPTION        /       TRADING SETUPS       
Advanced Supply Demand MT5
Bernhard Schweigert
4.53 (15)
Herhangi bir Acemi veya Uzman Tüccar için En İyi Çözüm! Bu gösterge benzersiz, yüksek kaliteli ve uygun fiyatlı bir ticaret aracıdır çünkü bir dizi tescilli özelliği ve yeni bir formülü bir araya getirdik. Bu güncelleme ile çift zaman dilimi dilimlerini gösterebileceksiniz. Yalnızca daha yüksek bir TF gösteremeyeceksiniz, aynı zamanda TF grafiğini ve ARTIK daha yüksek TF'yi de gösterebileceksiniz: YUVARLAK BÖLGELERİ GÖSTERMEK. Tüm Arz Talebi tüccarları buna bayılacak. :) Önemli Bilgiler Açıkland
Grafiğinizde otomatik olarak destek ve direnç seviyeleri PLUS itici mum boşlukları çizin, böylece fiyatın nereye gidebileceğini ve / veya potansiyel olarak tersine dönebileceğini görebilirsiniz. Bu gösterge, web sitemde (The Market Structure Trader) öğretilen pozisyon ticareti metodolojisinin bir parçası olarak kullanılmak üzere tasarlanmıştır ve hedefleme ve potansiyel girişler için temel bilgileri görüntüler. MT4 Version:  https://www.mql5.com/en/market/product/97246/ Göstergede 2 TEMEL öze
A key element in trading is zones or levels from which decisions to buy or sell a trading instrument are made. Despite attempts by major players to conceal their presence in the market, they inevitably leave traces. Our task was to learn how to identify these traces and interpret them correctly. Reversal First Impulse levels (RFI)   -  Version MT4                  INSTRUCTIONS                 RUS                 ENG                         R ecommended to use with an indicator   -  TREND PRO  
Fiyat tersine döndükçe ve geri çekildikçe piyasa yapısından elde edilen kâr değişir. Piyasa yapısını tersine çevirme uyarısı göstergesi, bir trendin veya fiyat hareketinin ne zaman tükenmeye yaklaştığını ve tersine dönmeye hazır olduğunu tanımlar. Genellikle bir geri dönüş veya büyük bir geri çekilme meydana gelmek üzereyken meydana gelen piyasa yapısındaki değişiklikler konusunda sizi uyarır. Gösterge, olası bir tükenme noktasının yakınında her yeni yüksek veya düşük oluştuğunda, başlangıçta
Tanıtım       Quantum Breakout PRO   , Breakout Bölgeleri ile ticaret yapma şeklinizi değiştiren çığır açan MQL5 Göstergesi! 13 yılı aşkın ticaret tecrübesine sahip deneyimli tüccarlardan oluşan bir ekip tarafından geliştirilmiştir.       Kuantum Breakout PRO       yenilikçi ve dinamik koparma bölgesi stratejisiyle ticaret yolculuğunuzu yeni zirvelere taşımak için tasarlanmıştır. Kuantum Breakout Göstergesi, size 5 kar hedefi bölgesi ile kırılma bölgelerinde sinyal okları ve kırılma kutusuna
TrendLine PRO MT5
Evgenii Aksenov
4.78 (49)
The Trend Line PRO indicator is an independent trading strategy. It shows the trend change, the entry point to the transaction, as well as automatically calculates three levels of Take Profit and Stop Loss protection Trend Line PRO is perfect for all Meta Trader symbols: currencies, metals, cryptocurrencies, stocks and indices Advantages of Trend Line PRO Never redraws its signals The possibility of using it as an independent strategy It has three automatic levels Take Profit and Stop Loss lev
XQ Indicator MetaTrader 5
Marzena Maria Szmit
5 (1)
Step into the realm of Forex trading with confidence and precision using XQ, a cutting-edge Forex indicator designed to elevate your trading game to unprecedented heights. Whether you're a seasoned trader or just stepping into the world of currency exchange, XQ Forex Indicator empowers you with the insights and signals needed to make informed trading decisions. The signal conditions are a combination of three indicators, and XQ Forex Indicator only display  medium and long-term trends . The ind
Trend Line Map Pro MT5
STE S.S.COMPANY
4.67 (9)
Trend Line Map indicator is an addons for   Trend Screener Indicator . It's working as a scanner for all signals generated by Trend screener ( Trend Line Signals ) . It's a Trend Line Scanner based on Trend Screener Indicator.  If you don't have Trend Screener Pro Indicator,   the Trend Line Map Pro will not work.     LIMITED TIME OFFER : Trend Line Map Indicator is available for only 50 $ and lifetime. ( Original price 125$ ) By accessing to our MQL5 Blog,  you can find all our premium indica
TrendDecoder Premium MT5
Christophe, Pa Trouillas
5 (1)
Aralıkları ve bir sonraki olası hamleleri belirleyin     |    Trendlerin en erken sinyallerini ve gücünü alın     |    Geri dönüşten önce net çıkışlar alın     |    Fiyatın test edeceği Fibo seviyelerini tespit edin   |  Gecikmesiz, takip edilmeyen gösterge - manuel ve otomatik ticaret için ideal - tüm varlıklar ve tüm zaman birimleri için uygun 50 İNDİRİM   - lansman için sonra tekrar   >>   149 $ Satın aldıktan sonra, kişiselleştirilmiş ayarlar için   bu kanaldan benimle iletişime geçin . MT4
MetaBands M5
Vahidreza Heidar Gholami
4.67 (3)
MetaBands uses powerful and unique algorithms to draw channels and detect trends so that it can provide traders with potential points for entering and exiting trades. It’s a channel indicator plus a powerful trend indicator. It includes different types of channels which can be merged to create new channels simply by using the input parameters. MetaBands uses all types of alerts to notify users about market events. Features Supports most of the channel algorithms Powerful trend detection algorith
Was: $249  Now: $99   Market Profile defines a number of day types that can help the trader to determine market behaviour. A key feature is the Value Area, representing the range of price action where 70% of trading took place. Understanding the Value Area can give traders valuable insight into market direction and establish the higher odds trade. It is an excellent addition to any system you may be using. Inspired by Jim Dalton’s book “Mind Over Markets”, this indicator is designed to suit the
Malaysian SNR Levels
Matthias Horst Pieroth
This indicator can be used to display Support and Resistance levels according to  the  Malaysian SNR concept , in which Support and Resistance are exact levels of a line chart. Malaysian SNR There are 3 different horizontal levels in Malaysian SNR: A-Level : This level is located at the peak of this line chart. (shape looks like the letter A) V-Level : Level at the valley of a line chart, (shape looks like the letter V) Gap-Leve l: This level is located at the Close/Open gap between two cand
The Volume by Price Indicator for MetaTrader 5 features Volume Profile and Market Profile TPO (Time Price Opportunity). Get valuable insights out of currencies, equities and commodities data. Gain an edge trading financial markets. Volume and TPO histogram bar and line charts. Volume Footprint charts. TPO letter and block marker charts including split structures. Versatile segmentation and compositing methods. Static, dynamic and flexible ranges with relative and/or absolute visualizations. Lay
ICT Silver Bullet MT5
Haidar, Lionel Haj Ali
5 (19)
ICT Silver Bullet If you are searching for a reliable indicator to trade the ICT Silver Bullet concept, or ICT concepts, Smart Money Concepts, or SMC, this indicator will respond to your need!  Before version 2.2, this indicator was focused only on ICT Silver Bullet, but moving forward, we will include the different elements for smart money concept trading. This indicator will help you identify the following: FVG - fair value gaps Market structure: BOS and CHOCH. It is based on ZIGZAG as it is
Account Graph MT5
Kyra Nickaline Watson-gordon
5 (1)
An indicator to draw a graph of account current and historical state such as Balance, Equity, Margin, Free Margin, Margin Level, Drawdown, Account Profit, Deposit and Withdrawals. Indicator Inputs : Draw Balance Graph Draw Equity Graph Draw Margin Graph Draw Free Margin Graph Draw Margin Level Graph Draw Drawdown Graph Draw Account Profit Graph Hide Data on Chart and Buffers Connect Gaps by Lines Sign of DDs on Profit Sign of DDs on Loss Tips : The Indicator will draw historical balance gra
TPA True Price Action indicator reveals the true price action of the market makers through 100% non-repainting signals strictly at the close of a candle! TPA shows entries and re-entries, every time the bulls are definitely stronger than the bears and vice versa. Not to confuse with red/green candles. The shift of power gets confirmed at the earliest stage and is ONE exit strategy of several. There are available now two free parts of the TPA User Guide for our customers. The first "The Basics"
Yazarın diğer ürünleri
Trend ticaret stratejisi "Süper Trend Esnek Uyarısı EA", aynı adı taşıyan "Süper Trend Esnek Uyarısı" göstergesi üzerine inşa edilmiştir. Danışman göstergedeki tüm bilgileri kullanır, dolayısıyla danışmanın yalnızca üç parametresi vardır, bunlar: "Çalışma zaman dilimi" - çalışma zaman dilimini, göstergenin oluşturulduğu zaman dilimini ve ayrıca "OHLC" verilerinin alındığı zaman dilimini belirtir. "Zararı Durdur", "puan" cinsinden ölçülen zararı durdurmanın sabit boyutudur ("Artı, Ctrl+F" aracın
Tanım: "Piyasa Yapısı HH HL LH LL" göstergesi, finansal piyasalardaki fiyat dinamiklerini analiz etmek için güçlü ve aynı zamanda basit bir araçtır. Bu gösterge, yatırımcıların ve yatırımcıların trendlerdeki değişiklikleri tespit etmelerine ve fiyat zaman serilerindeki önemli noktaları tespit etmelerine yardımcı olur. Göstergenin temel bileşenleri: HH (Yüksek Yüksek): Fiyatın bir önceki yüksek tepenin üzerinde kapandığı tepe. HH güçlenen bir yükseliş trendine işaret ediyor. HL (Yüksek Düş
Trend göstergesi "   Süper Trend Esnek Uyarısı   " minimum ayara sahiptir. Bu gösterge, kullanımı mümkün olduğunca kolay olacak şekilde tasarlanmıştır. Gösterge, ana renkli bir çizgiyle eğilimi gösterir ("Veri Pencereleri" penceresinde görebileceğiniz ("SuperTrend" satırı). Ayrıca, trendin değiştiği yerlerde, gösterge renkli okları gösterir ( "Veri Pencereleri" penceresinde görebileceğiniz   "STBuy" ve "   STSell" simgeleri       ). Trendin değiştiği yerlerde, gösterge bir sinyal vermez: bir ses
Gösterge yükseliş ve düşüş eğilimi gösteriyor. Göstergenin kendisi (normal stokastik gibi) bir alt pencerede görüntülenir. Grafik arayüzü   : Ana pencerede, "Düşük" fiyattan "Düşük" fiyata (yükseliş farklılığı için) ve "Yüksek" fiyattan "Yüksek" fiyata (düşüş eğilimi sapması için) kadar üretilen "trend çizgisi" grafik nesneleri oluşturulur. ). Gösterge, penceresinde yalnızca grafik tamponlarını kullanarak çizer: “Ana”, “Sinyal”, “Nokta”, “Al” ve “Satış”. "Al" ve "Satış" tamponları farklılık gös
'Supertrend MetaTrader 5' göstergesi, en basit trend ticaret sisteminin temelidir. Ve yine de çok etkili olmaya devam ediyor. Gösterge herhangi bir zaman diliminde çalışır (mevcut grafiğin zaman diliminde). Adından, bu göstergenin trendi takip ettiğini ve trend değiştiğinde göstergenin trendin değişme noktasını doğru bir şekilde gösterdiğini görebilirsiniz. 'Supertrend MetaTrader 5'in temeli, fiyat ve 'Average True Range göstergesi' değerlerinin bir çarpanla çarpılmasıdır (ayrıca 'ATR' yerine '
The Candle Length Indicator Alarm generates a sound alert, sends a push notification and an email when the size of the current candlestick changes. The size of the current candlestick can be measured in two ways: The first method: the size of the candlestick is measured from the beginning of the candlestick (from the OPEN price). The second method: the size of the candlestick is measured from current price. The indicator has the following settings: sound — a sound file from the folder: "...\Meta
The Buy Sell Color Background indicator changes the background color depending on position direction. It has three settings: Background color for BUY - background color for a Buy position Background color for SELL - background color for a Sell position Default background color - background color with no open position After you detach the indicator from a chart, its background color changes to Default background color .
The calculator of signals operates directly from the MetaTrader 5 terminal, which is a serious advantage, since the terminal provides a preliminary selection and sorts out signals. This way, users can see in the terminal only the signals that ensure a maximum compatibility with their trading accounts. The calculator of signals gives the answer to the one of the questions most frequently asked by users of the Signals service: "Will I be able to subscribe to the signal NNN, and what volume of the
Arrow Signal
Vladimir Karputov
Bu gösterge "Stokastik" kategorisine aittir. Gösterge kontrolünü mümkün olduğunca basitleştirmeye çalıştım, bu nedenle giriş parametrelerinde minimum ayarlar gösteriliyor: bu, sinyal okları için bir simge seçimidir. "Satın Al" sinyali '   Al Ok kodu   ' parametresi ile, "Sat" sinyali ise '   Ok Sat kodu   ' parametresi ile kodlanır. Sinyaller için sinyal ok kodları (lütfen 32 ile 255 arasındaki değerleri kullanın) Wingdings yazı tipinden alınmıştır. Gösterge her tik üzerinde çalışır ve mevcut çu
An Expert Advisor based on the custom indicator. Search for a signal at every tick. Positions are closed by an opposite signal. No trailing. There is no stop loss. There is no take profit. Has a minimum of settings Money management: Lot OR Risk   - type Money management The value for "Money management"   - Money management value Deviation   - admissible slippage Buy Arrow code   (font Wingdings) - character code from 'Wingdings' font for BUY signals Sell Arrow code   (font Wingdings) - characte
Ma Dema Alert
Vladimir Karputov
Gösterge üç çizgi görüntüler ve iki tür kavşağı izler. Göstergenin üç satırı: "   MA   " - yavaş gösterge "Hareketli Ortalama", "   DEMA Yavaş   " - yavaş gösterge "   Çift Üstel Hareketli Ortalama" ve "   DEMA Hızlı   " - hızlı gösterge "Çift Üstel Hareketli Ortalama". İki tür kavşak       : "   MA Uyarı Fiyatı   " - fiyat   "MA" çizgisini geçiyor ve   "   Alert DEMA DEMA   " - çizgiler kesişiyor       "DEMA Yavaş" ve   "DEMA Hızlı   ". Karşıdan karşıya geçerken aşağıdaki seçenekler mevcuttur:
Bu Uzman Danışman, manuel ve yarı otomatik ticaret için yardımcı programlar sınıfına aittir. "   Günün uç   noktalarında bekleyen emir " EA, bir önceki günün uç noktalarında bekleyen iki emir verir. Parametre "   Bekleyen Emirler: ...       ", bekleyen emirlerin türünü seçmenizi sağlar: "   Alış Durdurma ve Satış Durdurma   " veya "   Alış Limiti ve Satış Limiti   "   .       aşırılık       'Düşük' ofset aşağı doğru yapılır). "   Yeni beklemede -> öncekileri sil   " "   true   " olarak ayarlandı
"Panel Kısmi Kapatma" yardımcı programı paneli, kâr getiren bir pozisyonun hızlı bir şekilde kısmen kapatılması için tasarlanmıştır. Yalnızca iki parametresi vardır: "   Kısmi kapatma #1   " ve "   Kısmi kapatma #2   ". Herhangi bir sembol ve herhangi bir 'Sihirli sayı' için çalışır - yani, yardımcı program öncelikle manuel ticaret için tasarlanmıştır. Nasıl çalışır: Örneğin, "EURUSD", "Jump 100 Index" ve "XAUUSD" (altın) üzerinde çeşitli pozisyonlarınız var. Yardımcı program en yüksek karı olan
MQL5 "Günlük direnç ve destek" göstergesi - günlük destek ve direnç çizgilerini çizer. Çizim yalnızca grafik nesnelerin (trend çizgileri) yardımıyla gerçekleştirilir - bu göstergede gösterge tamponları kullanılmaz. Göstergenin herhangi bir ayarı yoktur - seviye araması "D1" zaman aralığından son 500 barda gerçekleştirilir ve bu parametre kodun içinde fiziksel olarak bağlanmıştır. Manuel ticaret: Manuel alım satım yaparken, bu göstergenin "M10" ile "H1" arasındaki zaman dilimlerinde kullanılması
"   Çoklu Sembol İzleme   " yardımcı programı, halihazırda açık olan tüm pozisyonlar için Kaybı Durdur'u hareket ettirir (çoklu sembol izleme). Öncelikle manuel ticarete yardımcı olmayı amaçlamaktadır. Yardımcı program için döviz çiftinin adına veya bireysel tanımlayıcıya (Sihirli sayı) göre herhangi bir kısıtlama yoktur - yardımcı program kesinlikle şu anda açık olan tüm pozisyonları işler. "   Trailing Stop   " ve "   Trailing Step   " parametrelerinin ölçü birimi puandır (1.00055 fiyatı ile
"Trend İki Hareketli Ortalama" trend göstergesi, hesaplama sonuçlarını görüntülemek için iki tür Ok kullanır - bunlar "Trend UP" ve "Trend DN".       Oklar "Trend Yukarı"       çizilir       İle       fiyat       'Düşük'       çubuk   ,       A       Oklar "Trend DN" -       İle       fiyat       'yüksek'. Trend arama algoritması, bir çubuğun fiyatının analizine ve iki 'Hareketli Ortalama' göstergesinin değerlerine dayanır. Trend yönü, mevcut (sıfır) çubuğunda hesaplanır. Bu nedenle, 1 numaralı
Üç Zaman Çerçevesi gösterge paneli. Gösterge, CAppDialog sınıfına dayalı bir panel şeklinde yapılır. Panel, fare kullanılarak simge durumuna küçültülebilir veya geçerli grafikte hareket ettirilebilir. Gösterge, paneldeki mevcut sembolün üç zaman dilimini gösterir. Mevcut sürümde, göstergenin minimum sayıda ayarı vardır - bunlar üç zaman diliminin parametreleridir: "Daha genç zaman dilimi", "   Orta   zaman dilimi   " ve "   Daha eski   zaman dilimi   ". Başlatıldığında, gösterge paneli mevcut ta
"   Piyasa Seans Süreleri   " göstergesi dört işlem seansının süresini gösterir: Asya, Avrupa, Amerika ve Pasifik. Ticaret seanslarının süresi   şu formatta   ayarlanır:       GMT ve dolayısıyla ticaret sunucusuna hiç bağlı değildir. Aşağıdaki veriler kullanılır: Ticaret Seansı Şehir GMT Asya Tokyo Singapur Şanghay 00:00−06:00 01:00−09:00 01:30−07:00 Avrupa Londra Frankfurt'ta 07:00−15:30 07:00−15:30 Amerika New York Chicago 13:30−20:00 13:30−20:00 Pasifik Wellington Sidney 20:00−
Çeşitli ticaret işlemleri için ticaret sistemi. Belirli indirim görevleri veya benzerleri için kullanılan bakiyeyi sıfır civarında dolaşacak şekilde ayarlamanıza olanak tanır. Riskten korunma   hesaplarıyla çalışacak şekilde yapılandırılmıştır.   Piyasada birden fazla pozisyon bulunamaz   . Genel bir ayar olan "   Adım, Zararı Durdur, Kar Al   " parametresi puan cinsinden ölçülür (EURUSD için örnek: 1.00055-1.00045 = 10 puan). Danışman,   pozisyon yerleştirirken marj eksikliğiyle karşılaşırsa ti
Yapay Zeka Desteği Direnci Bu, “Destek” ve “Direnç” satırlarını arayan bir göstergedir. Arama, sayısal analiz ve veri işlemeye yönelik bir algoritma kullanılarak gerçekleştirilir. Üç arama seçeneği mevcuttur (“mod #1”, “mod #2” ve “mod #3”). Bu seçeneklerin her biri kendi dahili algoritmasında farklılık gösterir (şu anda bunlar tamamen dahili ayarlardır, kullanıcı tarafından kullanılamaz). Bu seçeneklerin aramanın ciddiyetine göre farklılık gösterdiğini söyleyebiliriz. Sınırlama: Şu anda gösterg
Yardımcı program "       Zaman Yöneticisini Aç       " belirli bir zamanda bir pozisyon açar ve ardından klasik takibi etkinleştirir. Zaman ("       Şimdi       ":"       dakika       ") her zaman GMT zaman diliminde bir GMT Farkı ile ayarlanır. ' tuşunu kullanarak bir pozisyon açmak için üç seçenek seçebilirsiniz.       Ticaret Modu       ': '       ELDE ETMEK       ' '       SATMAK       ' '       AL ve SAT (aynı anda)       ' '       KAPALI (değişim yok, yalnızca son çalışmalar)       ' Dörd
Gösterge       "Destek" ve "Direnç" çizgilerini gösterir (bu çizgiler DRAW_LINE çizim stili kullanılarak çizilmiştir - yani bunlar grafik nesneleri değildir). "Sinyal çubuğunun" solunda ve sağında yeni minimum ve maksimumlar için bir arama gerçekleştirilir - "sinyal çubuğu" her yeni yapının geleneksel ortasıdır. Göstergenin adında neden Esnek kelimesi geçiyor? Çünkü "sinyal çubuğunun" solunda ('Sol Çubuklar') ve sağında ('Sağ Çubuklar') farklı sayıda çubuk belirtme olanağımız var. Gösterge çizgi
Kontrol paneli iki göstergenin okumalarını tarar: 'MACD' ve 'Stokastik'. Sinyalleri üç sütunda görüntüler: MACD için, Stokastik için ve sonuç sütunu (sinyal her iki gösterge için de aynıysa). Tarama bir veya daha fazla zaman diliminde seçilebilir. Tüm zaman aralıklarını devre dışı bırakırsanız kontrol paneli yine de yüklenir, ancak bu tür durumlara özel ayarlar bulunur. Sinyaller her zaman göstergenin sıfır çubuğu (sıfır çubuğu grafikte en sağdaki çubuktur) açısından kontrol edilir. Parametreler
ATR Bantları Uyarısı, kanal genişliğinin sabit bir çarpan ("Çarpan") ve "Ortalama Gerçek Aralık" göstergesinin değeri olarak hesaplandığı bir kanal göstergesidir. Bollinger Bantlarından farklı olarak bant genişliği çok sık değişmez; ATR Bant Uyarısı göstergesinde bantlar genellikle uzun düz çizgilere sahiptir. ATR Bantları Uyarısının yorumlanması, fiyatın çoğu zaman bantların içinde olduğu gerçeğine dayanmaktadır ve fiyatın sınırlardan birine ulaşması bir trend değişikliğine işaret edebilir.
Filtrele:
İnceleme yok
İncelemeye yanıt
Sürüm 1.11 2023.12.23
Minor bug fix