Angel Algo MT4
- Göstergeler
- Mohammad Taher Halimi Tabrizi
- Sürüm: 1.0
- Etkinleştirmeler: 5
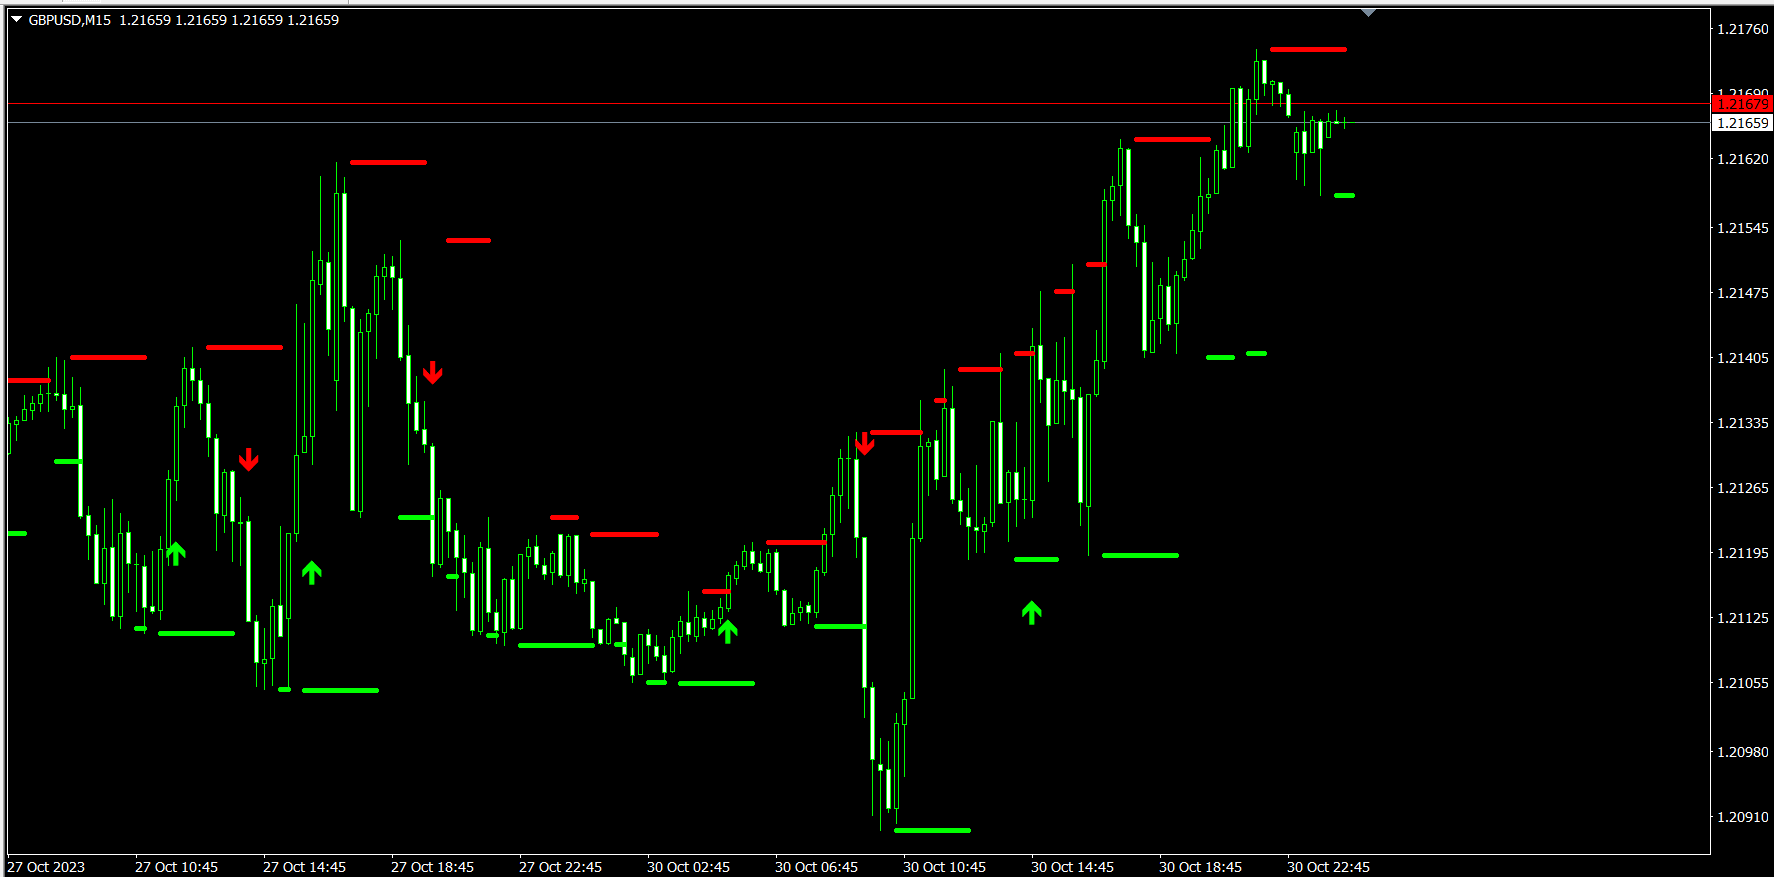
The "Angel Algo" indicator, designed for the TradingView platform, is a powerful technical analysis tool that assists traders in identifying dynamic support and resistance levels in real-time. It provides valuable insights into potential breakout points and market regimes.
At its core, the "Angel Algo" indicator utilizes a rolling window of price data to calculate maximum and minimum price levels. It then dynamically identifies support and resistance levels by examining specific conditions related to the most recent price action. This real-time analysis is invaluable for traders seeking to make informed decisions in both bullish and bearish market conditions.
The indicator also offers visual cues through the use of buy and sell signals, making it easier for traders to spot potential entry and exit points in the market. The bullish and bearish breakout signals are presented as easily recognizable arrow symbols, enhancing the clarity of trading signals.
"Angel Algo" goes beyond the traditional static support and resistance concept by adapting to evolving market conditions. By doing so, it helps traders adjust their strategies to changing market dynamics, ultimately enhancing their trading experience.
This indicator can be a valuable addition to your trading toolkit, providing you with dynamic levels and clear signals to assist in your decision-making process. Whether you are an experienced trader or just starting your journey in the world of trading, the "Angel Algo" indicator can be a useful ally in your quest for profitable trades.