• Genel bakış
  • İncelemeler
  • Yorumlar
  • Yenilikler

Market Session Times

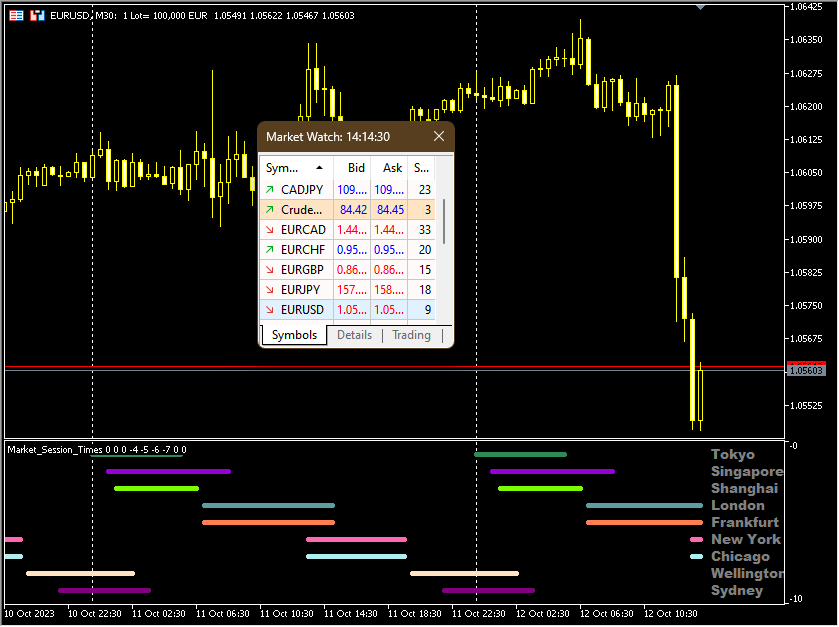
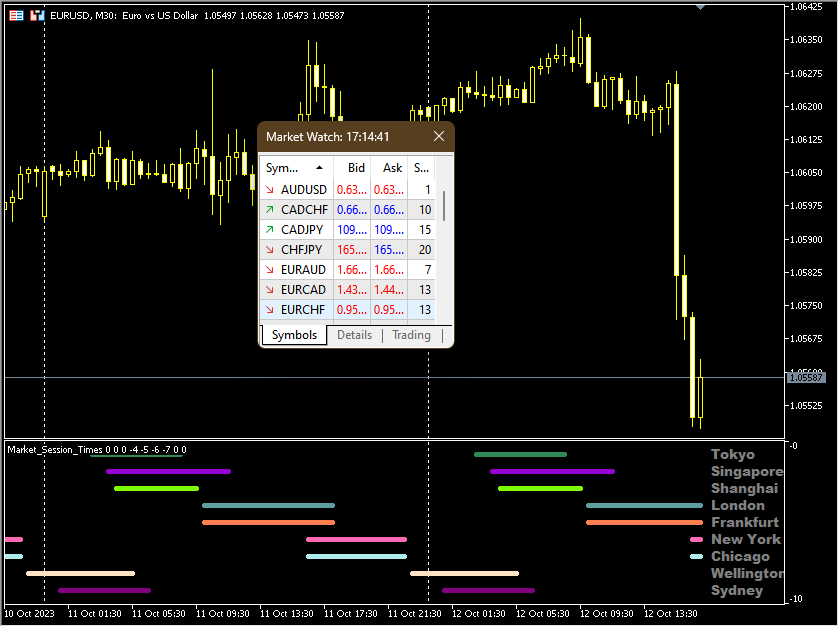
" Piyasa Seans Süreleri " göstergesi dört işlem seansının süresini gösterir: Asya, Avrupa, Amerika ve Pasifik. Ticaret seanslarının süresi şu formatta ayarlanır:   GMT ve dolayısıyla ticaret sunucusuna hiç bağlı değildir.

Aşağıdaki veriler kullanılır:

Ticaret Seansı
Şehir
GMT

Asya

Tokyo
Singapur
Şanghay

00:00−06:00
01:00−09:00
01:30−07:00

Avrupa

Londra
Frankfurt'ta

07:00−15:30
07:00−15:30

Amerika

New York
Chicago

13:30−20:00
13:30−20:00

Pasifik

Wellington
Sidney

20:00−02:45
22:00−04:00


Önerilen ürünler
The best time to trade Using this Indicator is when the time reach exactly hour,half,45 minutes,15 minutes and sometimes 5 minutes.. This indicators is helpful to those who trade boom and crash indecies.How to read this indicator first you'll see Blue allow and Red allow all these allows used to indicate or to detect the spike which will happen so the allow happens soon before the spike happen.This indicator works properly only in boom and crash trading thing which you have to consider when
Was: $249  Now: $99   Market Profile defines a number of day types that can help the trader to determine market behaviour. A key feature is the Value Area, representing the range of price action where 70% of trading took place. Understanding the Value Area can give traders valuable insight into market direction and establish the higher odds trade. It is an excellent addition to any system you may be using. Inspired by Jim Dalton’s book “Mind Over Markets”, this indicator is designed to suit the
MetaCOT 2 is a set of indicators and specialized utilities for the analysis of the U.S. Commodity Futures Trading Commission reports. Thanks to the reports issued by the Commission, it is possible to analyze the size and direction of the positions of the major market participants, which brings the long-term price prediction accuracy to a new higher-quality level, inaccessible to most traders. These indicators, related to the fundamental analysis, can also be used as an effective long-term filter
You can change the time period of the chart at the touch of a button. You can also change multiple charts at the touch of a button. You can also change multiple charts at the touch of a button,   saving you the trouble of changing time periods. We are live-streaming the actual operation of the system. Please check for yourself if it is usable. Please check it out for yourself. https://www.youtube.com/@ganesha_forex We do not guarantee your investment results. Investments should be made at y
The Netsrac Correlation Trade Indicator (NCTI) was created to trade correlations between different assets. NCTI offers five different strategies to do this. Five different correlation trading strategies with two or three assets Fast access your assets with one click via asset buttons Your profit/loss at a glance Configurable alerts via screen or mobile You can use the indicator with every timeframe. Higher timeframes give fewer but better signals. If you have some questions or suggestions - pl
Awesome Oscillator by Bill Williams with the ability to fine-tune and replace the averaging algorithms of the indicator, which significantly expands the possibilities of using this oscillator in algorithmic trading and brings it closer in its properties to such an indicator as the MACD. To reduce price noise, the final indicator is processed with an additional Smooth averaging. The indicator has the ability to give alerts, send mail messages and push signals when the direction of movement of th
Knowledge of the strength and weakness of each currency is vital for every forex trader. Our   Currency Strength Meter indicator   measures the strength of eight major currencies (USD, EUR, GBP, CHF, JPY, CAD, AUD, NZD) by using the Relative Strength Index indicator, also known as RSI. The Currency Strength Meter indicator shows you, simply and quickly, when a currency is oversold, overbought, or in "normal area". This way, you can identify which currency is the strongest and the weakest. Our
Sayı dizilerinden birine "Orman Yangını Dizisi" denir. En güzel yeni dizilerden biri olarak kabul edildi. Başlıca özelliği, bu dizinin lineer trendlerden, hatta en kısa olanlardan kaçınmasıdır. Bu göstergenin temelini oluşturan bu özelliktir. Bir finansal zaman serisini analiz ederken, bu gösterge tüm olası trend seçeneklerini reddetmeye çalışır. Ve ancak başarısız olursa, bir trendin varlığını tanır ve uygun sinyali verir. Bu yaklaşım, yeni trendlerin başladığı anların doğru bir şekilde belirl
US30NinjaMT5
Satyaseelan Shankarananda Moodley
US30 Ninja is a 5 minute scalping indicator that will let know you when there is a trade set up (buy or sell). Once the indicator gives the trade direction, you can open a trade and use a 30 pip stop loss and a 30 pip to 50 pip take profit. Please trade at own own risk. This indicator has been created solely for the US30 market and may not yield positive results on any other pair. 
Premium seviye, %80'den fazla doğru tahmin doğruluğuna sahip benzersiz bir göstergedir! Bu gösterge en iyi Ticaret Uzmanları tarafından iki aydan uzun süredir test edilmiştir! Yazarın göstergesini başka hiçbir yerde bulamazsınız! Ekran görüntülerinden bu aracın doğruluğunu kendiniz görebilirsiniz! 1, sona erme süresi 1 mum olan ikili opsiyon ticareti için harikadır. 2 tüm döviz çiftleri, hisse senetleri, emtialar, kripto para birimleri üzerinde çalışır Talimatlar: Kırmızı ok görün
Bar Follow EA
Aurelio Miguel Machado Da Silva
1 (1)
This robot has the purpose of operating in favor of force bars, the size of the force bar can be configured, the takeprofit and stoploss can be defined by the users or can be automatically placed by the robot (in this case the takeprofit and stoploss targets are the size of the previous bar). The values ​​defined in the parameters must be changed according to the users' needs. 
FREE
This MT5 indicator has been designed to be used on any currency pair and any time frame . It has the scalper and swing trader in mind.  The indicator looks for short-term high-probability reversals in price and will indicate to you to go long (buy) or short (sell) if you see a green or red arrow next to the current candlestick respectively. The indicator provides the best trading opportunities to you during the active trading hours of London and New York, but it will continue to give signals al
Your Pointer is no ordinary Forex channel. This corridor is built on the basis of the analysis of several candles, starting from the last one, as a result of which the extremes of the studied interval are determined. They are the ones who create the channel lines. Like all channels, it has a middle line as well as a high and low line. This channel is worth watching for its unusual behavior. The use of the Your Pointer indicator allows the trader to react in time to the price going beyond the bo
Upgraded - Stars added to indentify Areas you can scale in to compound on your entry  when buying or selling version 2.4 Upgraded Notifications and alerts added version 2.3 *The indicator is suitable for all pairs fromm  Deriv pairs (Vix,jump,boom & crash indices) , Currencies, cryptos , stocks(USA100, USA30 ), and metals like gold etc. How does it work? Increasing the period make it more stable hence will only focus on important entry points However  lowering the period will mean the indica
VSA target
Evgenii Bazhenov
Vsa'nın amacı Gösterge, profesyonel alıcıyı veya profesyonel satıcıyı grafikte VSA (Volume Spread Analysis) sistemini kullanarak tanımlar ve bu çubuklara (mumlara) ve hedef seviyelere göre bir eğilim destek bölgesi oluşturur.  Özellikler: 1. Bu göstergede, yalnızca profesyonel alıcının veya profesyonel satıcının tanımlanacağı ve her iki profesyonel katılımcının aynı anda tanımlanacağı bir mod seçebilirsiniz. 2. Destek bölgesini ve hedef seviyelerini belirlemek için sembol üzerindeki herhangi bi
Attention!!! Do not try to test the EA in the MT4 Tester, it is simply impossible, because the EA opens positions on 27 different instruments and 8 timeframe . The tester is able to test only one pair. Multi-currency tester is possible only in MT5. Instructions for launching a multi-currency tester in MT5:  https://youtu.be/WrQQwMQclrY How EA works: 1. The main strategy for the breakdown of local extremes is used. 2. An additional algorithm is used to control losing trades and redistribute loss
PZ Trend Trading MT5
PZ TRADING SLU
3.67 (3)
Trend Trading is an indicator designed to profit as much as possible from trends taking place in the market, by timing pullbacks and breakouts. It finds trading opportunities by analyzing what the price is doing during established trends. [ Installation Guide | Update Guide | Troubleshooting | FAQ | All Products ] Trade financial markets with confidence and efficiency Profit from established trends without getting whipsawed Recognize profitable pullbacks, breakouts and early reversals The ind
Spread highlighter
Jonathan Daniel Marion
This spread indicator displays the actual spread of each candle. It highlights the maximum spread and the minimum spread of the chosen symbol. This indicator is very helpful to see in real time the spread evolution helping to avoid taking a trade when the spread is too high. Inputs: Print value in Points: if true displays the spread as a whole number D isplay minimum and maximum spread of the past N days: select the number of days to consider the maximum and minimum spread Automatically
Several techniques use volume as an important point in the trade. Whether to indicate strength, exhaustion, pullback weakness, among others. In chief I quote Richard Wyckoff's theory, which said about the importance of looking price and volume. However, there are several possibilities to filter what is volume that should be noticed. PVRSA/PVA users use an indicator with specific colors, which assist in identifying the volume and type of movement that the price has made. Will the high
Gösterge, tarihsel olanlarla karşılaştırılabilecek güncel teklifler oluşturur ve bu temelde bir fiyat hareketi tahmini yapar. Gösterge, istenen tarihe hızlı navigasyon için bir metin alanına sahiptir. Seçenekler: Sembol - göstergenin göstereceği sembolün seçimi; SymbolPeriod - göstergenin veri alacağı dönemin seçimi; GöstergeRenk - gösterge rengi; Ters - doğru tırnakları tersine çevirir, yanlış - orijinal görünüm; Sonraki, tarihi girebileceğiniz ve 'enter' tuşuna basa
Your Trend Friend
Luigi Nunes Labigalini
5 (1)
The trend is your friend! Look at the color of the indicator and trade on that direction. It does not  repaint. After each candle is closed, that's the color of the trend. You can focus on shorter faster trends or major trends, just test what's most suitable for the symbol and timeframe you trade. Simply change the "Length" parameter and the indicator will automatically adapt. You can also change the color, thickness and style of the lines. Download and give it a try! There are big movements
Indicator and Expert Adviser  EA Available in the comments section of this product. Download with Indicator must have indicator installed for EA to work. Mt5 indicator alerts for bollinger band and envelope extremes occurring at the same time. Buy signal alerts occur when A bullish candle has formed below both the lower bollinger band and the lower envelope  Bar must open and close below both these indicators. Sell signal occur when A bear bar is formed above the upper bollinger band and upp
Basic Support and Resistance   Göstergimiz, teknik analizinizi artırmak için ihtiyacınız olan çözümdür.Bu gösterge, destek ve direnç seviyelerini grafikte yansıtmanıza olanak tanır/ MT4 sürümü Özellikler Fibonacci seviyelerinin entegrasyonu: Fibonacci seviyelerini destek ve direnç seviyelerinin yanı sıra görüntüleme seçeneğiyle, göstergemiz size piyasa davranışı ve olası tersine dönme alanları hakkında daha derin bir fikir verir. Performans Optimizasyonu: Genişletilmiş satırları yalnızca he
Volume plays a crucial role in trading, serving as a key indicator of market activity and investor sentiment. Here are some important roles of volume in trading: Confirming trends: Dow Theory emphasizes the importance of volume in determining market trends. Larger volume usually indicates greater disagreement between bulls and bears, while smaller volume may indicate higher market agreement with the current price. Capturing institutional moves: By analyzing volume over a period of time, one c
Gioteen Volatility Index (GVI) - your ultimate solution to overcoming market unpredictability and maximizing trading opportunities. This revolutionary indicator helps you in lowering your losing trades due to choppy market movements. The GVI is designed to measure market volatility, providing you with valuable insights to identify the most favorable trading prospects. Its intuitive interface consists of a dynamic red line representing the volatility index, accompanied by blue line that indicate
Market book tester
Aliaksandr Hryshyn
1 (1)
Using data from the order book in the strategy tester Key features: Simultaneous use of several symbols, up to 7 pieces DOM visualization With the visualization of order books, real-time simulation is available, as well as acceleration or deceleration Working with the library: This product also requires a utility to save data:  https://www.mql5.com/en/market/product/71642 Speed control utility:  https://www.mql5.com/en/market/product/81409 Include file:   https://c.mql5.com/31/735/Market_book_s
FREE
Visible Market Profile graphically represents the amount of trades made on each price level. This indicator in particular, unlike the daily  market profile , is calculated on the visible area of ​​the chart. Visible Market Profile cannot be considered an indicator of operational signals, but it can be a good support for reading the market, in addition to what is already used by every trader in his work process. The Visible Market Profile is able to determine with a good approximation the pric
The  DYJ  CandleShape   contains 80 candlestick Patterns, such as MORNING STAR, DOJI STAR, HARAMI CROSS,INVERT HAMMER,ENGULFING..... candlestick is a valid form of market technical analysis.  The recommended short stoploss is near the highest price of the first three to five candles The recommended long   stoploss   is near the lowest price of the first three to five candles Input InpPeriodSMA   =10         -- Period of averaging InpAlert       =true          --  Enable. alert InpCountBars   =
Sam TrendBlaster for MT5
AKILA THILINDA JAYARATHNA RANASINGHEGE
3.5 (2)
***** This is an indicator for MT5 providing accurate arrow signals without repainting. ***** Trade With Sam Simple Strategy Guide :  https://www.mql5.com/en/blogs/post/740855 MT4 version of the indicator Try Out and see the Difference The Sam's Trend Blaster indicator tracks the market trend with an unmatched reliability, by ignoring sudden fluctuations and market noise. It has been designed to trend-trade intraday charts and small timeframes. Its winning ratio is around 85%. This is a
Hello, This is an easy symbol change panel. This is a full version of Symbol1 2Changer Symbols must be active on your Market Watch list. Parameters: SymbolList - you can add more symbols with a comma(,) ratio - change the size LineNumber - you can set that how many symbols are displayed per line. button_width - modify the button size button_height - modify the button size Thank you.
Bu ürünün alıcıları ayrıca şunları da satın alıyor
Öncelikle belirtmek gerekir ki bu Ticaret Göstergesi Yeniden Çizim Yapmaz, Gecikmez ve Gecikme Göstermez, bu da hem manuel hem de robot ticareti için ideal hale getirir. Kullanıcı kılavuzu: ayarlar, girişler ve strateji. Atom Analisti, Piyasada Daha İyi Bir Avantaj Bulmak İçin Fiyatın Gücünü ve Momentumunu Kullanan PA Fiyat Hareketi Göstergesidir. Gürültüleri ve Yanlış Sinyalleri Kaldırmaya ve Ticaret Potansiyelini Artırmaya Yardımcı Olan Gelişmiş Filtrelerle Donatılmıştır. Birden fazla katmanl
Öncelikle, bu Ticaret Sistemi'nin Non-Repainting, Non-Redrawing ve Non-Lagging Göstergesi olduğunu vurgulamak önemlidir, bu da hem manuel hem de robot ticareti için ideal hale getirir. Online kurs, kılavuz ve ön ayarları indir. "Smart Trend Trading System MT5", yeni ve deneyimli tüccarlar için özelleştirilmiş kapsamlı bir ticaret çözümüdür. 10'dan fazla premium göstergeyi birleştiriyor ve 7'den fazla sağlam ticaret stratejisi sunuyor, bu da çeşitli piyasa koşulları için esnek bir seçim yapar. Tr
Reversal First Impulse levels (RFI)      INSTRUCTIONS        RUS       -       ENG              R ecommended to use with an indicator   -   TREND PRO -  Version MT4                 A key element in trading is zones or levels from which decisions to buy or sell a trading instrument are made. Despite attempts by major players to conceal their presence in the market, they inevitably leave traces. Our task was to learn how to identify these traces and interpret them correctly. Main functions:: Di
Quantum Trend Sniper
Bogdan Ion Puscasu
4.91 (43)
Tanıtım       Kuantum Trend Keskin Nişancı Göstergesi   , trend tersine dönmeleri belirleme ve ticaret yapma şeklinizi değiştiren çığır açan MQL5 Göstergesi! 13 yılı aşkın ticaret tecrübesine sahip deneyimli tüccarlardan oluşan bir ekip tarafından geliştirilmiştir.       Kuantum Trend Keskin Nişancı Göstergesi       trend dönüşlerini son derece yüksek doğrulukla belirlemenin yenilikçi yolu ile ticaret yolculuğunuzu yeni zirvelere taşımak için tasarlanmıştır. ***Kuantum Trend Keskin Nişancı Gö
Trend Screener Pro MT5
STE S.S.COMPANY
4.88 (64)
Trend Göstergesi, Trend Alım Satım ve Filtreleme için Çığır Açan Benzersiz Çözüm, Tüm Önemli Trend Özellikleriyle Tek Bir Araç İçinde Yerleştirildi! Forex, emtialar, kripto para birimleri, endeksler ve hisse senetleri gibi tüm sembollerde/araçlarda kullanılabilen %100 yeniden boyamayan çoklu zaman çerçevesi ve Çoklu para birimi göstergesidir. Trend Screener, grafikte noktalarla ok trend sinyalleri sağlayan etkili bir trend trend göstergesidir. Trend analizörü göstergesinde bulunan özellikler: 1.
Öncelikle, bu Ticaret Aracının Non-Repainting, Non-Redrawing ve Non-Lagging Gösterge olduğunu vurgulamakta fayda var, bu da onu profesyonel ticaret için ideal hale getiriyor. Çevrimiçi kurs, kullanıcı kılavuzu ve demo. Akıllı Fiyat Hareketi Kavramları Göstergesi, hem yeni hem de deneyimli tüccarlar için çok güçlü bir araçtır. İleri ticaret fikirlerini, Inner Circle Trader Analizi ve Smart Money Concepts Ticaret Stratejileri gibi 20'den fazla kullanışlı göstergeyi bir araya getirerek bir aray
The Volume by Price Indicator for MetaTrader 5 features Volume Profile and Market Profile TPO (Time Price Opportunity). Volume and TPO histogram bar and line charts. Volume Footprint charts. TPO letter and block marker collapsed and split structure charts. Session filtering and grouping. Static, dynamic and flexible range segmentation and compositing methods with relative and absolute visualizations. Graphical layering, positioning and styling options to suit the user's analytic and aesthetic n
Gold Stuff mt5
Vasiliy Strukov
4.89 (175)
Gold Stuff mt5, özellikle altın için tasarlanmış bir trend göstergesidir ve herhangi bir finansal enstrümanda da kullanılabilir. Gösterge yeniden çizilmez ve gecikmez. Önerilen zaman dilimi H1. Ayarları ve kişisel bir bonusu almak için satın alma işleminden hemen sonra benimle iletişime geçin!  Güçlü Destek ve Trend Tarayıcı göstergemizin ücretsiz bir kopyasını pm'den alabilirsiniz. Ben!   AYARLAR Ok Çiz - açık kapalı. grafik üzerinde oklar çizmek. Uyarılar - sesli uyarılar kapalı. E-post
FX Power MT5 NG
Daniel Stein
5 (5)
Sabah Brifingimiz burada mql5 ve on Telegram! FX Power MT5 NG , uzun zamandır çok popüler olan döviz gücü ölçerimiz FX Power'ın yeni neslidir. Peki bu yeni nesil güç ölçer ne sunuyor? Orijinal FX Power hakkında sevdiğiniz her şey PLUS GOLD/XAU güç analizi Daha da hassas hesaplama sonuçları Ayrı ayrı yapılandırılabilir analiz dönemleri Daha da iyi performans için özelleştirilebilir hesaplama limiti Özel çokluDaha fazlasını görmek isteyenler için örnek ayarlar Her grafikte en sevdiğiniz renkler i
ICT, SMC, SMART MONEY CONCEPTS, SMART MONEY, Smart Money Concept, Support and Resistance, Trend Analysis, Price Action, Market Structure, Order Blocks, BOS/CHoCH,   Breaker Blocks ,  Momentum Shift,   Supply&Demand Zone/Order Blocks , Strong Imbalance,   HH/LL/HL/LH,    Fair Value Gap, FVG,  Premium  &   Discount   Zones, Fibonacci Retracement, OTE, Buy Side Liquidity, Sell Side Liquidity, BSL/SSL Taken, Equal Highs & Lows, MTF Dashboard, Multiple Time Frame, BigBar, HTF OB, HTF Market Structure
TPSproTREND PrO MT5
Roman Podpora
4.86 (7)
TPSpro TRENDPRO  - is a trend indicator that automatically analyzes the market and provides information about the trend and each of its changes, as well as giving signals for entering trades without redrawing! The indicator uses each candle, analyzing them separately. referring to different impulses - up or down impulse. Exact entry points into transactions for currencies, crypto, metals, stocks, indices!  -  Version MT4               DETAILED DESCRIPTION               R ecommended to use with
FxaccurateLS
Shiv Raj Kumawat
WHY IS OUR FXACCCURATE LS MT5 THE PROFITABLE ? PROTECT YOUR CAPITAL WITH RISK MANAGEMENT Gives entry, stop and target levels from time to time. It finds Trading opportunities by analyzing what the price is doing during established trends. POWERFUL INDICATOR FOR A RELIABLE STRATEGIES We have made these indicators with a lot of years of hard work. It is made at a very advanced level. Established trends provide dozens of trading opportunities, but most trend indicators completely ignore them!
AW Trend Predictor MT5
AW Trading Software Limited
4.78 (58)
Tek bir sistemde trend ve kırılma seviyelerinin kombinasyonu. Gelişmiş bir gösterge algoritması piyasa gürültüsünü filtreler, trendi, giriş noktalarını ve olası çıkış seviyelerini belirler. Gösterge sinyalleri, sinyal geçmişinin etkinliğini gösteren en uygun enstrümanların seçilmesine izin veren bir istatistiksel modüle kaydedilir. Gösterge Kâr Al ve Zararı Durdur işaretlerini hesaplar. Kılavuz ve talimatlar ->   BURAYA   / MT4 versiyonu ->   BURAYA Gösterge ile nasıl ticaret yapılır: Trend Pre
IVISTscalp5
Vadym Zhukovskyi
5 (5)
We present you the iVISTscalp5 indicator, which is not only unique, but also effective in the analysis of trading operations. This indicator is based on time data and is the result of many years of experience and deep analysis of financial markets. The iVISTscalp5 indicator is an excellent assistant for manual trading. Convenience, simplicity and visualization. All the most difficult is hidden inside. We have simplified the settings and use of the iVISTscalp5 indicator as much as possible. The i
Top indicator for MT5   providing accurate signals to enter a trade without repainting! It can be applied to any financial assets:   forex, cryptocurrencies, metals, stocks, indices .  Watch  the video  (6:22) with an example of processing only one signal that paid off the indicator! MT4 version is here It will provide pretty accurate trading signals and tell you when it's best to open a trade and close it. Most traders improve their trading results during the first trading week with the help of
Fiyat tersine döndükçe ve geri çekildikçe piyasa yapısından elde edilen kâr değişir. Piyasa yapısını tersine çevirme uyarısı göstergesi, bir trendin veya fiyat hareketinin ne zaman tükenmeye yaklaştığını ve tersine dönmeye hazır olduğunu tanımlar. Genellikle bir geri dönüş veya büyük bir geri çekilme meydana gelmek üzereyken meydana gelen piyasa yapısındaki değişiklikler konusunda sizi uyarır. Gösterge, olası bir tükenme noktasının yakınında her yeni yüksek veya düşük oluştuğunda, başlangıçta
Owl Smart Levels MT5
Sergey Ermolov
4.38 (37)
MT4 versiyonu  |  FAQ Owl Smart Levels Indicator , Bill Williams'ın gelişmiş fraktalları , piyasanın doğru dalga yapısını oluşturan Valable ZigZag ve kesin giriş seviyelerini gösteren Fibonacci seviyeleri gibi popüler piyasa analiz araçlarını içeren tek gösterge içinde eksiksiz bir ticaret sistemidir. pazara ve kar elde edilecek yerlere. Stratejinin ayrıntılı açıklaması Gösterge ile çalışma talimatı Baykuş Yardımcısı ticaretinde Danışman Yardımcısı Kullanıcıların özel sohbeti -> Satın aldıktan
FX Volume MT5
Daniel Stein
4.94 (17)
Sabah Brifingimiz aracılığıyla ayrıntılar ve ekran görüntüleri ile günlük piyasa güncellemenizi alın burada mql5 ve on Telegram ! FX Volume, bir brokerin bakış açısından piyasa duyarlılığı hakkında GERÇEK bir fikir veren İLK ve TEK hacim göstergesidir. COT raporlarından çok daha hızlı bir şekilde, brokerlar gibi kurumsal piyasa katılımcılarının Forex piyasasında nasıl konumlandıklarına dair harika bilgiler sağlar. Bu bilgileri doğrudan grafiğinizde görmek, ticaretiniz için gerçek oyun değiştir
Introducing the Power Trade Plus indicator designed by a small group of traders with a few years of experience trading the market profitably.  The Power Trade Plus is derived from the Power Trade indicator,  the indicator strive in powerful sniper entries and take profit levels,  with an algorithm that's can determine the markets volatility and Provides entries based on the current market volatility. This indicator is much more effective in stock ,currencies and indices.
Advanced Supply Demand MT5
Bernhard Schweigert
4.53 (15)
Herhangi bir Acemi veya Uzman Tüccar için En İyi Çözüm! Bu gösterge benzersiz, yüksek kaliteli ve uygun fiyatlı bir ticaret aracıdır çünkü bir dizi tescilli özelliği ve yeni bir formülü bir araya getirdik. Bu güncelleme ile çift zaman dilimi dilimlerini gösterebileceksiniz. Yalnızca daha yüksek bir TF gösteremeyeceksiniz, aynı zamanda TF grafiğini ve ARTIK daha yüksek TF'yi de gösterebileceksiniz: YUVARLAK BÖLGELERİ GÖSTERMEK. Tüm Arz Talebi tüccarları buna bayılacak. :) Önemli Bilgiler Açıkland
Quantum Heiken Ashi PRO MT5
Bogdan Ion Puscasu
4.5 (8)
Quantum Heiken Ashi PRO ile   tanışın Pazar eğilimleri hakkında net bilgiler sağlamak üzere tasarlanan Heiken Ashi mumları, gürültüyü filtreleme ve yanlış sinyalleri ortadan kaldırma yetenekleriyle ünlüdür. Kafa karıştırıcı fiyat dalgalanmalarına veda edin ve daha sorunsuz, daha güvenilir bir grafik sunumuna merhaba deyin. Quantum Heiken Ashi PRO'yu gerçekten benzersiz kılan şey, geleneksel şamdan verilerini okunması kolay renkli çubuklara dönüştüren yenilikçi formülüdür. Kırmızı ve yeşil çubukl
Tanıtım       Quantum Breakout PRO   , Breakout Bölgeleri ile ticaret yapma şeklinizi değiştiren çığır açan MQL5 Göstergesi! 13 yılı aşkın ticaret tecrübesine sahip deneyimli tüccarlardan oluşan bir ekip tarafından geliştirilmiştir.       Kuantum Breakout PRO       yenilikçi ve dinamik koparma bölgesi stratejisiyle ticaret yolculuğunuzu yeni zirvelere taşımak için tasarlanmıştır. Kuantum Breakout Göstergesi, size 5 kar hedefi bölgesi ile kırılma bölgelerinde sinyal okları ve kırılma kutusuna
** All Symbols x All Timeframes scan just by pressing scanner button ** ***Contact me after purchase to send you instructions and add you in "123 scanner group" for sharing or seeing experiences with other users. After 17 years of experience in the markets and programming, Winner indicator is ready. I would like to share with you! Introduction The 123 Pattern Scanner indicator with a special enhanced algorithm is a very repetitive common pattern finder with a high success rate . Interestingly,
Bill Williams Advanced
Siarhei Vashchylka
5 (5)
Bill Williams Advanced is designed for automatic chart analysis using Bill Williams' "Profitunity" system. The indicator analyzes four timeframes at once. Manual (Be sure to read before purchasing) Advantages 1. Automatically analyzes the chart using the "Profitunity" system of Bill Williams. The found signals are placed in a table in the corner of the screen. 2. Equipped with a trend filter based on the Alligator indicator. Most of the system signals are recommended to be used only accordi
Easy BySell is a market indicator for opening and closing positions. It becomes easy to track market entries with the alerts. It indicates the trend reversal points when a price reaches extreme values and the most favorable time to enter the market. My other products  with its advanced technology   :   https://www.mql5.com/en/users/incepline/seller The algorithm is based on ATR and Stochastic Oscillator indicators. You can modify these two parameters as you wish to adapt the settings to t
Introducing the South African Sniper indicator created by a small group of traders with a few years trading trading the financial market profitably . This is a plug and play indicator that provides you with  BUY and SELL (SNIPER ENTRY) signals with TARGET and trail stops. The indicator Works with all MT5 trading instruments. The indicator uses previous  chart data as receipt to speculate on future market moves.  "The South African Sniper indicator community are very happy with the indicator an
AW Prime Oscillator MT5
AW Trading Software Limited
İki osilatörün birleşimi. Birincisi giriş noktalarını, ikincisi ise mevcut trendi gösterir. Gösterge, osilatör sinyallerini iki modda oklarla görüntüleyebilir; tüm hızlı osilatör sinyalleri veya yalnızca mevcut trend yönündeki sinyaller. Çok zaman dilimli bir panele ve üç tür sinyal bildirimine sahiptir. Faydalar: Günlük ve scalping ticaretine uygundur Trend filtreleme Basit ve hassas kurulum Çoklu zaman dilimi paneli Bir danışmana entegrasyona uygundur. Herhangi bir sembol ve herhangi bir zaman
RelicusRoad Pro MT5
Relicus LLC
4.83 (23)
Şimdi 147 $ (birkaç güncellemeden sonra 499 $ 'a yükseliyor) - Sınırsız Hesaplar (PC'ler veya Mac'ler) RelicusRoad Kullanım Kılavuzu + Eğitim Videoları + Özel Discord Grubuna Erişim + VIP Durumu PİYASAYA BAKMAK İÇİN YENİ BİR YOL RelicusRoad, forex, vadeli işlemler, kripto para birimleri, hisse senetleri ve endeksler için dünyanın en güçlü ticaret göstergesidir ve yatırımcılara kârlı kalmaları için ihtiyaç duydukları tüm bilgileri ve araçları sağlar. Başlangıç ​​seviyesinden ileri seviyey
ADR Ters Çevirme Göstergesi, normal ortalama günlük aralığına göre fiyatın şu anda nerede işlem gördüğünü bir bakışta size gösterir. Fiyat, ortalama aralığı ve seçtiğiniz seviyenin üzerindeki seviyeleri aştığında, açılır pencere, e-posta veya push yoluyla anında uyarılar alacaksınız, böylece hızlı bir şekilde geri çekilmelere ve geri dönüşlere atlayabilirsiniz. Gösterge, grafikte ortalama günlük aralık uç noktalarında yatay çizgiler ve ayrıca fiyatları aşan matematiksel olasılıkları olan seviye
Yeni Başlayanlar veya Uzman Tüccarlar için En İyi Çözüm! Bu gösterge benzersiz, yüksek kaliteli ve uygun fiyatlı bir ticaret aracıdır çünkü bir dizi tescilli özellik ve gizli bir formül ekledik. Yalnızca BİR grafikle 28 döviz çiftinin tümü için Uyarılar verir. Yeni bir trendin veya scalping fırsatının tam tetik noktasını belirleyebildiğiniz için ticaretinizin nasıl gelişeceğini hayal edin! Yeni temel algoritmalar üzerine inşa edilen bu sistem, potansiyel işlemlerin belirlenmesini ve onaylan
Yazarın diğer ürünleri
Gösterge yükseliş ve düşüş eğilimi gösteriyor. Göstergenin kendisi (normal stokastik gibi) bir alt pencerede görüntülenir. Grafik arayüzü   : Ana pencerede, "Düşük" fiyattan "Düşük" fiyata (yükseliş farklılığı için) ve "Yüksek" fiyattan "Yüksek" fiyata (düşüş eğilimi sapması için) kadar üretilen "trend çizgisi" grafik nesneleri oluşturulur. ). Gösterge, penceresinde yalnızca grafik tamponlarını kullanarak çizer: “Ana”, “Sinyal”, “Nokta”, “Al” ve “Satış”. "Al" ve "Satış" tamponları farklılık gös
Trend ticaret stratejisi "Süper Trend Esnek Uyarısı EA", aynı adı taşıyan "Süper Trend Esnek Uyarısı" göstergesi üzerine inşa edilmiştir. Danışman göstergedeki tüm bilgileri kullanır, dolayısıyla danışmanın yalnızca üç parametresi vardır, bunlar: "Çalışma zaman dilimi" - çalışma zaman dilimini, göstergenin oluşturulduğu zaman dilimini ve ayrıca "OHLC" verilerinin alındığı zaman dilimini belirtir. "Zararı Durdur", "puan" cinsinden ölçülen zararı durdurmanın sabit boyutudur ("Artı, Ctrl+F" aracın
Trend göstergesi "   Süper Trend Esnek Uyarısı   " minimum ayara sahiptir. Bu gösterge, kullanımı mümkün olduğunca kolay olacak şekilde tasarlanmıştır. Gösterge, ana renkli bir çizgiyle eğilimi gösterir ("Veri Pencereleri" penceresinde görebileceğiniz ("SuperTrend" satırı). Ayrıca, trendin değiştiği yerlerde, gösterge renkli okları gösterir ( "Veri Pencereleri" penceresinde görebileceğiniz   "STBuy" ve "   STSell" simgeleri       ). Trendin değiştiği yerlerde, gösterge bir sinyal vermez: bir ses
Tanım: "Piyasa Yapısı HH HL LH LL" göstergesi, finansal piyasalardaki fiyat dinamiklerini analiz etmek için güçlü ve aynı zamanda basit bir araçtır. Bu gösterge, yatırımcıların ve yatırımcıların trendlerdeki değişiklikleri tespit etmelerine ve fiyat zaman serilerindeki önemli noktaları tespit etmelerine yardımcı olur. Göstergenin temel bileşenleri: HH (Yüksek Yüksek): Fiyatın bir önceki yüksek tepenin üzerinde kapandığı tepe. HH güçlenen bir yükseliş trendine işaret ediyor. HL (Yüksek Düş
The Candle Length Indicator Alarm generates a sound alert, sends a push notification and an email when the size of the current candlestick changes. The size of the current candlestick can be measured in two ways: The first method: the size of the candlestick is measured from the beginning of the candlestick (from the OPEN price). The second method: the size of the candlestick is measured from current price. The indicator has the following settings: sound — a sound file from the folder: "...\Meta
The Buy Sell Color Background indicator changes the background color depending on position direction. It has three settings: Background color for BUY - background color for a Buy position Background color for SELL - background color for a Sell position Default background color - background color with no open position After you detach the indicator from a chart, its background color changes to Default background color .
The calculator of signals operates directly from the MetaTrader 5 terminal, which is a serious advantage, since the terminal provides a preliminary selection and sorts out signals. This way, users can see in the terminal only the signals that ensure a maximum compatibility with their trading accounts. The calculator of signals gives the answer to the one of the questions most frequently asked by users of the Signals service: "Will I be able to subscribe to the signal NNN, and what volume of the
Arrow Signal
Vladimir Karputov
Bu gösterge "Stokastik" kategorisine aittir. Gösterge kontrolünü mümkün olduğunca basitleştirmeye çalıştım, bu nedenle giriş parametrelerinde minimum ayarlar gösteriliyor: bu, sinyal okları için bir simge seçimidir. "Satın Al" sinyali '   Al Ok kodu   ' parametresi ile, "Sat" sinyali ise '   Ok Sat kodu   ' parametresi ile kodlanır. Sinyaller için sinyal ok kodları (lütfen 32 ile 255 arasındaki değerleri kullanın) Wingdings yazı tipinden alınmıştır. Gösterge her tik üzerinde çalışır ve mevcut çu
An Expert Advisor based on the custom indicator. Search for a signal at every tick. Positions are closed by an opposite signal. No trailing. There is no stop loss. There is no take profit. Has a minimum of settings Money management: Lot OR Risk   - type Money management The value for "Money management"   - Money management value Deviation   - admissible slippage Buy Arrow code   (font Wingdings) - character code from 'Wingdings' font for BUY signals Sell Arrow code   (font Wingdings) - characte
Ma Dema Alert
Vladimir Karputov
Gösterge üç çizgi görüntüler ve iki tür kavşağı izler. Göstergenin üç satırı: "   MA   " - yavaş gösterge "Hareketli Ortalama", "   DEMA Yavaş   " - yavaş gösterge "   Çift Üstel Hareketli Ortalama" ve "   DEMA Hızlı   " - hızlı gösterge "Çift Üstel Hareketli Ortalama". İki tür kavşak       : "   MA Uyarı Fiyatı   " - fiyat   "MA" çizgisini geçiyor ve   "   Alert DEMA DEMA   " - çizgiler kesişiyor       "DEMA Yavaş" ve   "DEMA Hızlı   ". Karşıdan karşıya geçerken aşağıdaki seçenekler mevcuttur:
Bu Uzman Danışman, manuel ve yarı otomatik ticaret için yardımcı programlar sınıfına aittir. "   Günün uç   noktalarında bekleyen emir " EA, bir önceki günün uç noktalarında bekleyen iki emir verir. Parametre "   Bekleyen Emirler: ...       ", bekleyen emirlerin türünü seçmenizi sağlar: "   Alış Durdurma ve Satış Durdurma   " veya "   Alış Limiti ve Satış Limiti   "   .       aşırılık       'Düşük' ofset aşağı doğru yapılır). "   Yeni beklemede -> öncekileri sil   " "   true   " olarak ayarlandı
"Panel Kısmi Kapatma" yardımcı programı paneli, kâr getiren bir pozisyonun hızlı bir şekilde kısmen kapatılması için tasarlanmıştır. Yalnızca iki parametresi vardır: "   Kısmi kapatma #1   " ve "   Kısmi kapatma #2   ". Herhangi bir sembol ve herhangi bir 'Sihirli sayı' için çalışır - yani, yardımcı program öncelikle manuel ticaret için tasarlanmıştır. Nasıl çalışır: Örneğin, "EURUSD", "Jump 100 Index" ve "XAUUSD" (altın) üzerinde çeşitli pozisyonlarınız var. Yardımcı program en yüksek karı olan
'Supertrend MetaTrader 5' göstergesi, en basit trend ticaret sisteminin temelidir. Ve yine de çok etkili olmaya devam ediyor. Gösterge herhangi bir zaman diliminde çalışır (mevcut grafiğin zaman diliminde). Adından, bu göstergenin trendi takip ettiğini ve trend değiştiğinde göstergenin trendin değişme noktasını doğru bir şekilde gösterdiğini görebilirsiniz. 'Supertrend MetaTrader 5'in temeli, fiyat ve 'Average True Range göstergesi' değerlerinin bir çarpanla çarpılmasıdır (ayrıca 'ATR' yerine '
MQL5 "Günlük direnç ve destek" göstergesi - günlük destek ve direnç çizgilerini çizer. Çizim yalnızca grafik nesnelerin (trend çizgileri) yardımıyla gerçekleştirilir - bu göstergede gösterge tamponları kullanılmaz. Göstergenin herhangi bir ayarı yoktur - seviye araması "D1" zaman aralığından son 500 barda gerçekleştirilir ve bu parametre kodun içinde fiziksel olarak bağlanmıştır. Manuel ticaret: Manuel alım satım yaparken, bu göstergenin "M10" ile "H1" arasındaki zaman dilimlerinde kullanılması
"   Çoklu Sembol İzleme   " yardımcı programı, halihazırda açık olan tüm pozisyonlar için Kaybı Durdur'u hareket ettirir (çoklu sembol izleme). Öncelikle manuel ticarete yardımcı olmayı amaçlamaktadır. Yardımcı program için döviz çiftinin adına veya bireysel tanımlayıcıya (Sihirli sayı) göre herhangi bir kısıtlama yoktur - yardımcı program kesinlikle şu anda açık olan tüm pozisyonları işler. "   Trailing Stop   " ve "   Trailing Step   " parametrelerinin ölçü birimi puandır (1.00055 fiyatı ile
"Trend İki Hareketli Ortalama" trend göstergesi, hesaplama sonuçlarını görüntülemek için iki tür Ok kullanır - bunlar "Trend UP" ve "Trend DN".       Oklar "Trend Yukarı"       çizilir       İle       fiyat       'Düşük'       çubuk   ,       A       Oklar "Trend DN" -       İle       fiyat       'yüksek'. Trend arama algoritması, bir çubuğun fiyatının analizine ve iki 'Hareketli Ortalama' göstergesinin değerlerine dayanır. Trend yönü, mevcut (sıfır) çubuğunda hesaplanır. Bu nedenle, 1 numaralı
Üç Zaman Çerçevesi gösterge paneli. Gösterge, CAppDialog sınıfına dayalı bir panel şeklinde yapılır. Panel, fare kullanılarak simge durumuna küçültülebilir veya geçerli grafikte hareket ettirilebilir. Gösterge, paneldeki mevcut sembolün üç zaman dilimini gösterir. Mevcut sürümde, göstergenin minimum sayıda ayarı vardır - bunlar üç zaman diliminin parametreleridir: "Daha genç zaman dilimi", "   Orta   zaman dilimi   " ve "   Daha eski   zaman dilimi   ". Başlatıldığında, gösterge paneli mevcut ta
Çeşitli ticaret işlemleri için ticaret sistemi. Belirli indirim görevleri veya benzerleri için kullanılan bakiyeyi sıfır civarında dolaşacak şekilde ayarlamanıza olanak tanır. Riskten korunma   hesaplarıyla çalışacak şekilde yapılandırılmıştır.   Piyasada birden fazla pozisyon bulunamaz   . Genel bir ayar olan "   Adım, Zararı Durdur, Kar Al   " parametresi puan cinsinden ölçülür (EURUSD için örnek: 1.00055-1.00045 = 10 puan). Danışman,   pozisyon yerleştirirken marj eksikliğiyle karşılaşırsa ti
Gösterge daha yüksek zaman dilimindeki Fraktalları gösterir. İki tür Fraktal görüntülemek mümkündür: 'Normal Fraktal' ve 'BW Fraktal'. Fraktal 'UP' oluşumunu düşünün. 'Düzenli Fraktal', her bir sonraki 'yüksek' fiyatın (orta çubuğun solunda ve sağında) daha küçük olduğu çok katı bir Fraktaldır. Oysa 'BW Fractal'da tek bir koşul vardır: Merkezi çubuğun (fiyatı 'yüksek') en yüksek olması gerekir. Görsel olarak bu iki mod arasındaki fark diyagram 1'de görülebilir. 'Daha Yüksek Zaman Çerçevesi' par
Yapay Zeka Desteği Direnci Bu, “Destek” ve “Direnç” satırlarını arayan bir göstergedir. Arama, sayısal analiz ve veri işlemeye yönelik bir algoritma kullanılarak gerçekleştirilir. Üç arama seçeneği mevcuttur (“mod #1”, “mod #2” ve “mod #3”). Bu seçeneklerin her biri kendi dahili algoritmasında farklılık gösterir (şu anda bunlar tamamen dahili ayarlardır, kullanıcı tarafından kullanılamaz). Bu seçeneklerin aramanın ciddiyetine göre farklılık gösterdiğini söyleyebiliriz. Sınırlama: Şu anda gösterg
Yardımcı program "       Zaman Yöneticisini Aç       " belirli bir zamanda bir pozisyon açar ve ardından klasik takibi etkinleştirir. Zaman ("       Şimdi       ":"       dakika       ") her zaman GMT zaman diliminde bir GMT Farkı ile ayarlanır. ' tuşunu kullanarak bir pozisyon açmak için üç seçenek seçebilirsiniz.       Ticaret Modu       ': '       ELDE ETMEK       ' '       SATMAK       ' '       AL ve SAT (aynı anda)       ' '       KAPALI (değişim yok, yalnızca son çalışmalar)       ' Dörd
Gösterge       "Destek" ve "Direnç" çizgilerini gösterir (bu çizgiler DRAW_LINE çizim stili kullanılarak çizilmiştir - yani bunlar grafik nesneleri değildir). "Sinyal çubuğunun" solunda ve sağında yeni minimum ve maksimumlar için bir arama gerçekleştirilir - "sinyal çubuğu" her yeni yapının geleneksel ortasıdır. Göstergenin adında neden Esnek kelimesi geçiyor? Çünkü "sinyal çubuğunun" solunda ('Sol Çubuklar') ve sağında ('Sağ Çubuklar') farklı sayıda çubuk belirtme olanağımız var. Gösterge çizgi
Kontrol paneli iki göstergenin okumalarını tarar: 'MACD' ve 'Stokastik'. Sinyalleri üç sütunda görüntüler: MACD için, Stokastik için ve sonuç sütunu (sinyal her iki gösterge için de aynıysa). Tarama bir veya daha fazla zaman diliminde seçilebilir. Tüm zaman aralıklarını devre dışı bırakırsanız kontrol paneli yine de yüklenir, ancak bu tür durumlara özel ayarlar bulunur. Sinyaller her zaman göstergenin sıfır çubuğu (sıfır çubuğu grafikte en sağdaki çubuktur) açısından kontrol edilir. Parametreler
ATR Bantları Uyarısı, kanal genişliğinin sabit bir çarpan ("Çarpan") ve "Ortalama Gerçek Aralık" göstergesinin değeri olarak hesaplandığı bir kanal göstergesidir. Bollinger Bantlarından farklı olarak bant genişliği çok sık değişmez; ATR Bant Uyarısı göstergesinde bantlar genellikle uzun düz çizgilere sahiptir. ATR Bantları Uyarısının yorumlanması, fiyatın çoğu zaman bantların içinde olduğu gerçeğine dayanmaktadır ve fiyatın sınırlardan birine ulaşması bir trend değişikliğine işaret edebilir.
Filtrele:
İnceleme yok
İncelemeye yanıt
Sürüm 1.11 2023.11.01
Bug fixes
Sürüm 1.10 2023.11.01
"Frankfurt" ve "Chicago" kaldırıldı