Visual Return Calculator MT5
- Göstergeler
- Matus German
- Sürüm: 3.0
- Güncellendi: 17 Ağustos 2023
- Etkinleştirmeler: 10
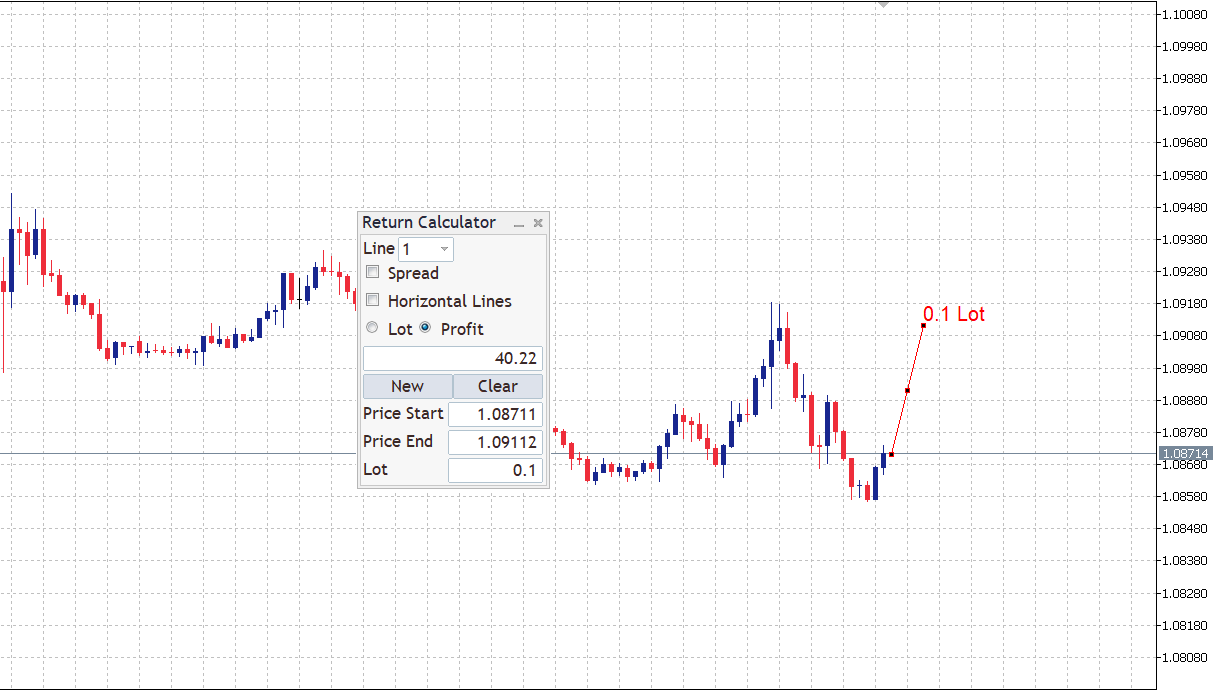
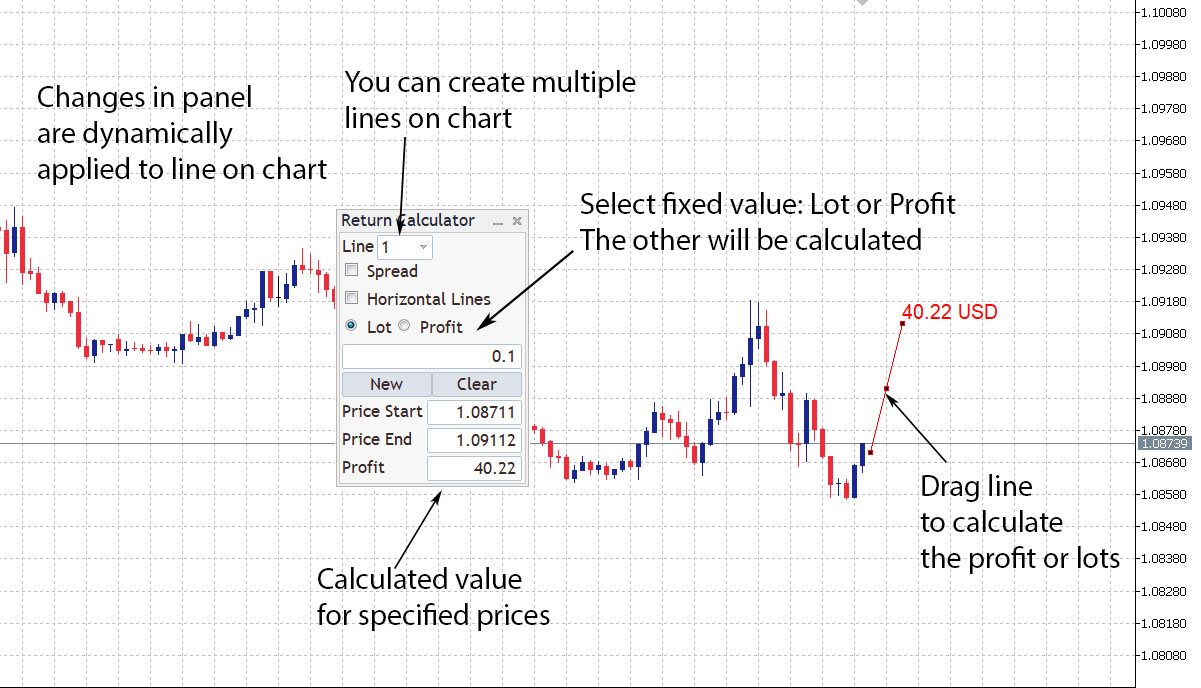
The Visual Result Calculator Indicator is a powerful tool designed to enhance your trading experience on the MetaTrader platform. This intuitive and user-friendly indicator allows you to visualize potential profits or losses on a trading chart, helping you make better-informed decisions and manage your trades with precision. The Indicator displays a dynamic line on the trading chart, representing the potential profit or loss of a trade based on the start and end of the line. Simply click and drag to adjust the positions, and the indicator will instantly update to show the corresponding profit or loss potential. With the Indicator, you can easily determine the appropriate lot size required to achieve a predefined profit target. By inputting your desired profit value, the indicator automatically calculates the lot size. You can select if you want to be included current spread into calculation.