• Genel bakış
  • İncelemeler
  • Yorumlar

Harmonic Patterns Osw MT5

HARMONİK MODELLER OSW MT5

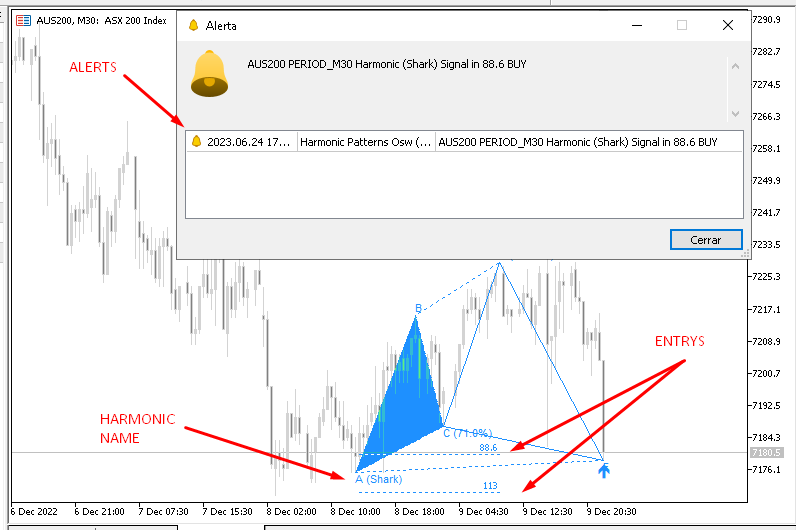
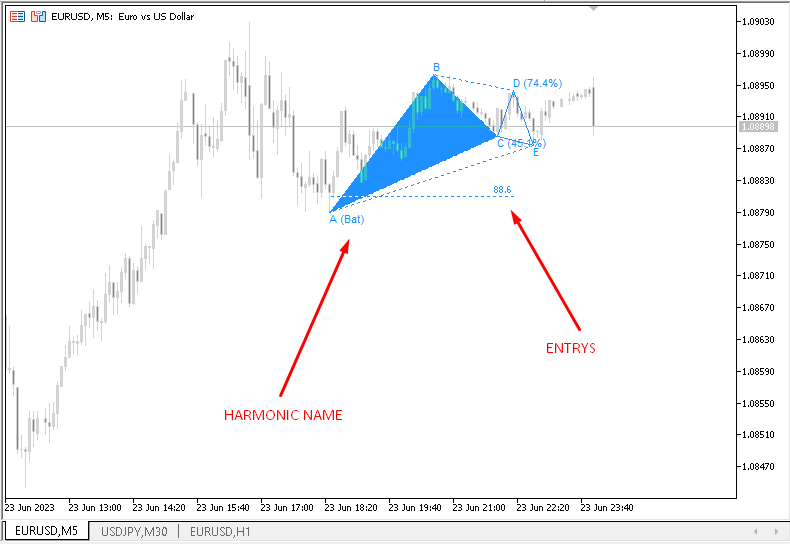
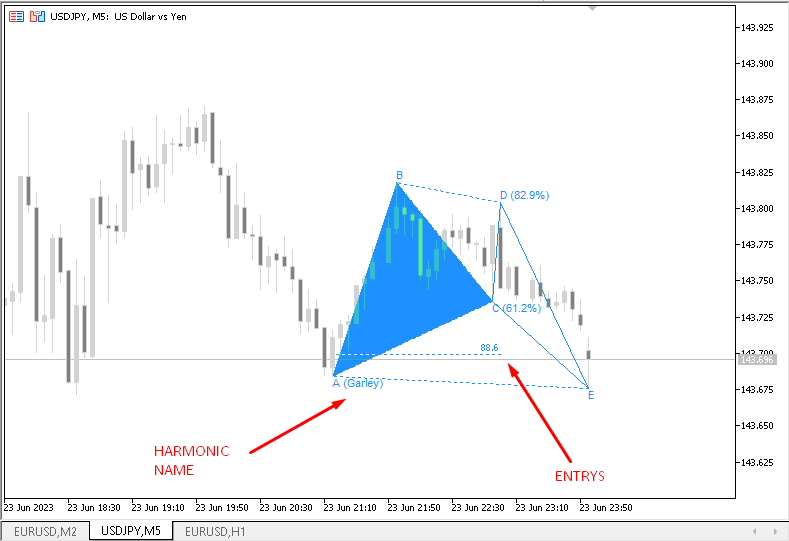
Bu indikatör Harmonik Modelleri tespit ederek üzerlerinde işlem yapmanızı sağlamakla görevli olup, siparişi alıp almadığınıza göre manuel analiz ekleyebilmeniz için size sinyal vermektedir.

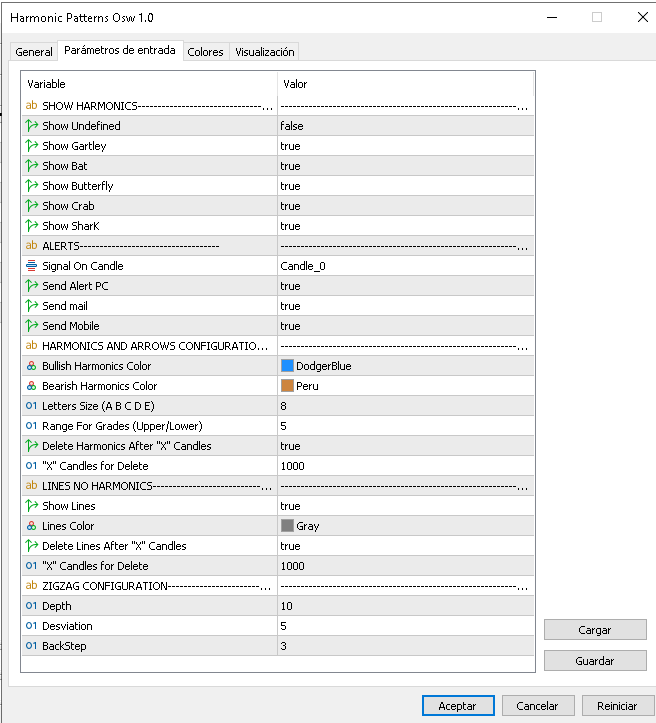
Göstergenin tespit ettiği Harmonik Modeller arasında şunlar yer alır:

>gartley

> yarasa

>Kelebek

>yengeç

>Köpekbalığı

Bulabileceğiniz işlevler arasında şunlar yer alır:

>Posta, Mobil ve PC için Uyarılar Oluşturun

>Harmoniklerin renklerini hem satın alırken hem de satarken değiştirin.

>"İzin Verilen Dereceleri" belirleyin, yani Harmonik 38.2'ye dokunmalı ve "İzin Verilen Dereceler" 5 ise, fiyatın 33.2 ile 43.2 arasında olmasını sağlayacaktır, çünkü fiyatlar tam olarak 38.2'ye değmez.

>1000 yapılandırılabilir mumdan sonra Harmonikleri silin, bu, grafiğin eski grafik nesnelerle yüklenmesini önler.

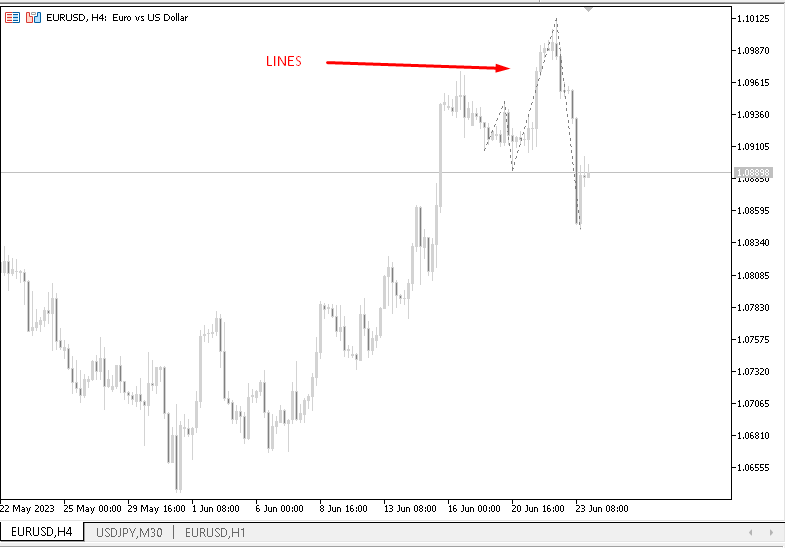
>Göstergenin hareketleri nasıl okuduğunu bilmek için analiz edilen çizgileri veya darbeleri ve gerilemeleri gösterin.

>Fiyat hareketlerini ölçmeye ve Harmonik Modelleri aramaya izin veren zikzak konfigürasyonu.
Önerilen ürünler
Matreshka
Dimitr Trifonov
5 (1)
Matreshka self-testing and self-optimizing indicator: 1. Is an interpretation of the Elliott Wave Analysis Theory. 2. Based on the principle of the indicator type ZigZag, and the waves are based on the principle of interpretation of the theory of DeMark. 3. Filters waves in length and height. 4. Draws up to six levels of ZigZag at the same time, tracking waves of different orders. 5. Marks Pulsed and Recoil Waves. 6. Draws arrows to open positions 7. Draws three channels. 8. Notes support and re
Introduction to X3 Chart Pattern Scanner X3 Cherart Pattern Scanner is the non-repainting and non-lagging indicator detecting X3 chart patterns including Harmonic pattern, Elliott Wave pattern, X3 patterns, and Japanese Candlestick patterns. Historical patterns match with signal patterns. Hence, you can readily develop the solid trading strategy in your chart. More importantly, this superb pattern scanner can detect the optimal pattern of its kind. In addition, you can switch on and off individu
Introduction to Harmonic Volatility Indicator Harmonic Volatility Indicator is the first technical analysis applying the Fibonacci analysis to the financial volatility. Harmonic volatility indicator is another level of price action trading tool, which combines robust Fibonacci ratios (0.618, 0.382, etc.) with volatility. Originally, Harmonic Volatility Indicator was developed to overcome the limitation and the weakness of Gann’s Angle, also known as Gann’s Fan. We have demonstrated that Harmonic
Introduction Harmonic Patterns are best used to predict potential turning point. Traditionally, Harmonic Pattern was identified manually connecting peaks and troughs points in the chart. Manual harmonic pattern detection is painfully tedious and not suitable for everyone. You are often exposed under subjective pattern identification with manual pattern detection. To avoid these limitations, Harmonic Pattern Plus was designed to automate your harmonic pattern detection process. The functionality
FibExtender
Syed Oarasul Islam
This Indicator draws Fibonacci Extension levels in two different ways. You can select whether to draw Fibonacci Extension levels based on your favourite ZigZag settings or you can let the indicator to draw Fibonacci Extension  level based on given number of Bars or Candles.  You can also set Mobile and Email notification for your favourite Extension  levels individually. With this indicator you will not have to feel lonely as the it can generate Voice alerts, which will keep you focused on your
Gartley Projections D
Oleksandr Medviediev
3 (2)
The indicator identifies the harmonic patterns (XABCD) according to developments of H.M.Gartley ( "Profits in the Stock Market" , 1935г). It projects D-point as a point in the perspective projection (specify ProjectionD_Mode = true in the settings). Does not redraw. When a bar of the working timeframe closes, if the identified pattern point has not moved during Patterns_Fractal_Bars bars, an arrow appears on the chart (in the direction of the expected price movement). From this moment on, the ar
Harmo EA
Matteo Schizzerotto
Hiç kazançlı harmonik kalıpları otomatik olarak tespit edebilen bir ticaret asistanına sahip olmak istediniz mi? Forex dünyasındaki harmonik kalıpları temel alan yenilikçi Uzman Danışmanımızı gururla sunarız. CANLI SİNYALLERİ BURADA BULUN: MARTINGALE  https://www.mql5.com/en/signals/ 2175074 LOT DÜZELTME  https://www.mql5.com/en/signals /2177470 Uzman Danışmanımız, finansal piyasa verilerini analiz etmek ve en karlı işlem sinyallerini belirlemek için özel olarak tasarlanmış, gelişmiş algori
ArcTracer
Syed Oarasul Islam
This Indicator draws Fibonacci Arc levels in two different ways. You can select whether to draw Fibonacci Arc levels based on your favourite ZigZag settings or you can let the indicator to draw Arc levels based on given number of bars or candles.  You can also set Mobile and Email notification for your favourite Arc levels individually. With this indicator you will not have to feel lonely as the it can generate Voice alerts, which will keep you focused on your trading and remove boredom.  Produc
Elliott Wave Trend was designed for the scientific wave counting. This tool focuses to get rid of the vagueness of the classic Elliott Wave Counting using the guideline from the template and pattern approach. In doing so, firstly Elliott Wave Trend offers the template for your wave counting. Secondly, it offers Wave Structural Score to assist to identify accurate wave formation. It offers both impulse wave Structural Score and corrective wave Structure Score. Structural Score is the rating to sh
This indicator finds wedges , which are continuation patterns identified by converging trendlines surrounding a price consolidation period. It signals trades using a donchian breakout alongside the formation breakout. [ Installation Guide | Update Guide | Troubleshooting | FAQ | All Products ] Easy to use Customizable colors and sizes It implements breakout signals It implements alerts of all kinds Optimal Usage To see wedges of all sizes, which can overlap, load the indicator several times on
The indicator for trading on the signals of the harmonic pattern AB=CD. It gives signals and shows the levels of entry into the market, as well as levels for placing stop orders, which allows the trader to make timely decisions on entering the market, as well as effectively manage positions and orders. It supports sending push notifications to a mobile device, e-mail, as well as alerts. This indicator has been ported from the version for MetaTrader 4. For more information, as well as a detailed
This indicator contains Pivot Levels of: Traditional Fibonacci Woodie Classic Demark Camarilla  Calculation periods can be set to auto / Daily / Weekly / Monthly / Yearly.  Number of Levels are editable.  Options to hide level labels and price labels.  Pivots Points are price levels chartists can use to determine intraday support and resistance levels. Pivot Points use the previous days Open, High, and Low to calculate a Pivot Point for the current day. Using this Pivot Point as the base, three
Auto Fib Retracements
Ross Adam Langlands Nelson
4.33 (6)
Automatic Fibonacci Retracement Line Indicator. This indicator takes the current trend and if possible draws Fibonacci retracement lines from the swing until the current price. The Fibonacci levels used are: 0%, 23.6%, 38.2%, 50%, 61.8%, 76.4%, 100%. This indicator works for all charts over all timeframes. The Fibonacci levels are also recorded in buffers for use by other trading bots. Any comments, concerns or additional feature requirements are welcome and will be addressed promptly. 
FREE
The 123 Pattern is one of the most popular, powerful and flexible chart patterns. The pattern is made up of three price points: a bottom, a peak or valley, and a Fibonacci retracement between 38.2% and 71.8%. A pattern is considered valid when the price breaks beyond the last peak or valley, moment at which the indicator plots an arrow, rises an alert, and the trade can be placed. [ Installation Guide | Update Guide | Troubleshooting | FAQ | All Products ] Clear trading signals Customizable c
M & W Pattern Pro is an advanced scanner for M and W patters , it uses extra filters to ensure scanned patterns are profitable. The indicator can be used with all symbols and time frames. The indicator is a non repaint indicator with accurate statistics calculations. To use , simply scan the most profitable pair using the statistics dashboard accuracy , then enter trades on signal arrow and exit at the TP and SL levels. STATISTICS : Accuracy 1 : This is the percentage of the times price hit
EchoIndicatorMT5
Phongkrit Phattanawijak
ECHO INDICATOR V2.2 Update A top-quality indicator works with trend and pattern.  The tool is a good assistant for the traders use various levels in trading. When price approaches a level, the indicator produces a sound alert and (or) notifies in a pop-up message, or via push notifications. A great decision making tool for opening orders. Can be used any timeframe and can be customized Easy to trade It implements alerts of all kinds It implements a multi-timeframe   Trade with Trend  + s
The indicator detects important peaks and troughs (extremes) on the chart. These points can be used to plot support/resistance levels and trend lines, as well as any other graphical analysis. These points can serve as reference points for setting trading orders. The indicator does not redraw . Settings: Size_History  - the size of the calculated history. Num_Candles_Right  - number of candles to the right of the peak or trough. Num_Candles_Left  - number of candles to the left of the pea
This is the Full Version, to get the free version please contact me. The free version works on “GBPCHF” charts. All symbols and time frames scanner. Harmonic Pattern Harmonic patterns are used in technical analysis that traders use to find trend reversals. They are considered one of the most accurate technical analysis tools, as they allow traders to predict the future price movement direction and the potential trend targets. Also, unlike many other technical tools, the number of false signal
Introduction to Chart Pattern MT Chart Pattern MT is a chart pattern scanner to detect the triangle pattern, falling wedge pattern, rising wedge pattern, channel pattern and so on. Chart Pattern MT uses highly sophisticated chart pattern detection algorithm. However, we have designed it in the easy to use with intuitive user interface. Chart Pattern MT will show all the patterns in your chart in the most efficient format for your trading. You do not have to do tedious manual pattern detection an
FanTracer
Syed Oarasul Islam
This Indicator draws Fibonacci Fan levels in two different ways. You can select whether to draw Fibonacci Fan levels based on your favourite ZigZag settings or you can let the indicator to draw Fan levels based on given number of bars or candles.  You can also set Mobile and Email notification for your favourite Fan  levels individually. With this indicator you will not have to feel lonely as the it can generate Voice alerts, which will keep you focused on your trading and remove boredom.  Prod
Mean Reversion Supply Demand Indicator Mean Reversion Supply Demand is the indicator to detect the important supply demand zone in your chart. The concept of supply demand trading relies on the quantity mismatching between buying and selling volumes in the financial market. Typically, supply demand zone serves to predict the turning point. The wave pattern, for any supply demand zone to work as an successful trade, looks like the price must touch the base zone, move away and then return to zone
This indicator finds pennants , which are continuation patterns identified by converging trendlines surrounding a price consolidation period. Trades are signaled using a breakout period alongside the formation breakout.  [ Installation Guide | Update Guide | Troubleshooting | FAQ | All Products ] Easy to use Customizable colors and sizes It implements breakout signals It implements alerts of all kinds Optimal Usage To see pennants of all sizes, which can overlap, load the indicator several tim
The   ICT Unicorn Model   indicator highlights the presence of "unicorn" patterns on the user's chart which is derived from the lectures of   "The Inner Circle Trader" (ICT) . Detected patterns are followed by targets with a distance controlled by the user.   USAGE (image 2) At its core, the ICT Unicorn Model relies on two popular concepts, Fair Value Gaps and Breaker Blocks. This combination highlights a future area of support/resistance. A   Bullish Unicorn Pattern   consists ou
Introduction This indicator detects volume spread patterns for buy and sell opportunity. The patterns include demand and supply patterns. You might use each pattern for trading. However, these patterns are best used to detect the demand zone (=accumulation area) and supply zone (=distribution area). Demand pattern indicates generally potential buying opportunity. Supply pattern indicates generally potential selling opportunity. These are the underlying patterns rather than direct price action. T
FREE
This is a well-known ZigZag indicator. But it differs by the fact that its plot is based on values of the middle line which is set by a user. It can display Andrews’ Pitchfork and standard or Bobokus Fibo levels. NO REPAINTING. Parameters Period МА — middle line period. Default value is 34. Minimum value is 4. Maximum value is set at your discretion. Used to calculate price — type of price used for the midline calculations. The averaging method — type of smoothing for the middle line. Turning
Price Breakout pattern Scanner is the automatic scanner for traders and investors. It can detect following patterns automatically from your chart. Head and Shoulder - Common tradable pattern. Reverse Head and Shoulder - This pattern is the reverse formation of the Head and Shoulder. Double Top - When the price hits resistance level twice and decline toward the support level, the trader can anticipate sudden bearish breakout through the support level. Double Bottom - The double bottom pattern is
All Harmonics 26 demo
Alexey Isavnin
4.22 (9)
This is the demo version of "All Harmonics 26" indicator . "All Harmonics 26" searches for 26 types of harmonic patterns and outputs them in a convenient way. You can check out the documentation here . This demo version has the following limitations: The indicator searches only for one type of harmonic patterns out of 26:- Gartley. The indicator outputs new patterns with a lag of 10 bars.
FREE
Fibonacci and RSI Demo version MQL5
Carlos Daniel Vazquez Rosas
4 (1)
Fibonacci and RSI. Demo versión only works with GBPUSD. For full version, please, visit visit https://www.mql5.com/en/market/product/52101 The indicator is a combination of the Fibonacci and RSI indicators. Every time the price touches one of the fibonacci levels and the rsi condition is met, an audible alert and a text alert are generated. Parameters number_of_candles : It is the number of candles that will be calculated. If you put 100, the indicator will give you the maximum and min
FREE
"Hunttern harmonic pattern finder" base on the dynamic zigzag with the notification and prediction mode This version of the indicator identifies 11 harmonic patterns and predicts them in real-time before they are completely formed. It offers the ability to calculate the error rate of Zigzag patterns depending on a risk threshold. It moreover sends out a notification once the pattern is complete. The supported patterns: ABCD BAT ALT BAT BUTTERFLY GARTLEY CRAB DEEP CRAB CYPHER SHARK THREE
FREE
The new update makes this indicator a complete tool for studying, analyzing and operating probabilistic patterns. It includes: On-chart Multi-asset percentage monitor. Configurable martingales. Twenty-one pre-configured patterns, including Mhi patterns and C3. An advanced pattern editor to store up to 5 custom patterns. Backtest mode to test results with loss reports. Trend filter. Hit operational filter. Martingale Cycles option. Various types of strategies and alerts. Confluence between patter
Bu ürünün alıcıları ayrıca şunları da satın alıyor
Öncelikle belirtmek gerekir ki bu Ticaret Göstergesi Yeniden Çizim Yapmaz, Gecikmez ve Gecikme Göstermez, bu da hem manuel hem de robot ticareti için ideal hale getirir. Atom Analisti, Piyasada Daha İyi Bir Avantaj Bulmak İçin Fiyatın Gücünü ve Momentumunu Kullanan PA Fiyat Hareketi Göstergesidir. Gürültüleri ve Yanlış Sinyalleri Kaldırmaya ve Ticaret Potansiyelini Artırmaya Yardımcı Olan Gelişmiş Filtrelerle Donatılmıştır. Birden fazla katmanlı karmaşık göstergeler kullanarak, Atom Analisti
Öncelikle, bu Ticaret Sistemi'nin Non-Repainting, Non-Redrawing ve Non-Lagging Göstergesi olduğunu vurgulamak önemlidir, bu da hem manuel hem de robot ticareti için ideal hale getirir. "Smart Trend Trading System MT5", yeni ve deneyimli tüccarlar için özelleştirilmiş kapsamlı bir ticaret çözümüdür. 10'dan fazla premium göstergeyi birleştiriyor ve 7'den fazla sağlam ticaret stratejisi sunuyor, bu da çeşitli piyasa koşulları için esnek bir seçim yapar. Trend Takip Stratejisi: Trendleri etkili bir
FX Volume MT5
Daniel Stein
4.94 (17)
Sabah Brifingimiz aracılığıyla ayrıntılar ve ekran görüntüleri ile günlük piyasa güncellemenizi alın burada mql5 ve on Telegram ! FX Volume, bir brokerin bakış açısından piyasa duyarlılığı hakkında GERÇEK bir fikir veren İLK ve TEK hacim göstergesidir. COT raporlarından çok daha hızlı bir şekilde, brokerlar gibi kurumsal piyasa katılımcılarının Forex piyasasında nasıl konumlandıklarına dair harika bilgiler sağlar. Bu bilgileri doğrudan grafiğinizde görmek, ticaretiniz için gerçek oyun değiştir
Quantum Trend Sniper
Bogdan Ion Puscasu
5 (38)
Tanıtım       Kuantum Trend Keskin Nişancı Göstergesi   , trend tersine dönmeleri belirleme ve ticaret yapma şeklinizi değiştiren çığır açan MQL5 Göstergesi! 13 yılı aşkın ticaret tecrübesine sahip deneyimli tüccarlardan oluşan bir ekip tarafından geliştirilmiştir.       Kuantum Trend Keskin Nişancı Göstergesi       trend dönüşlerini son derece yüksek doğrulukla belirlemenin yenilikçi yolu ile ticaret yolculuğunuzu yeni zirvelere taşımak için tasarlanmıştır. ***Kuantum Trend Keskin Nişancı Gö
Tanıtım       Quantum Breakout PRO   , Breakout Bölgeleri ile ticaret yapma şeklinizi değiştiren çığır açan MQL5 Göstergesi! 13 yılı aşkın ticaret tecrübesine sahip deneyimli tüccarlardan oluşan bir ekip tarafından geliştirilmiştir.       Kuantum Breakout PRO       yenilikçi ve dinamik koparma bölgesi stratejisiyle ticaret yolculuğunuzu yeni zirvelere taşımak için tasarlanmıştır. Kuantum Breakout Göstergesi, size 5 kar hedefi bölgesi ile kırılma bölgelerinde sinyal okları ve kırılma kutusuna
RelicusRoad Pro MT5
Relicus LLC
4.82 (22)
Şimdi 147 $ (birkaç güncellemeden sonra 499 $ 'a yükseliyor) - Sınırsız Hesaplar (PC'ler veya Mac'ler) RelicusRoad Kullanım Kılavuzu + Eğitim Videoları + Özel Discord Grubuna Erişim + VIP Durumu PİYASAYA BAKMAK İÇİN YENİ BİR YOL RelicusRoad, forex, vadeli işlemler, kripto para birimleri, hisse senetleri ve endeksler için dünyanın en güçlü ticaret göstergesidir ve yatırımcılara kârlı kalmaları için ihtiyaç duydukları tüm bilgileri ve araçları sağlar. Başlangıç ​​seviyesinden ileri seviyey
Quantum Heiken Ashi PRO MT5
Bogdan Ion Puscasu
4.5 (8)
Quantum Heiken Ashi PRO ile   tanışın Pazar eğilimleri hakkında net bilgiler sağlamak üzere tasarlanan Heiken Ashi mumları, gürültüyü filtreleme ve yanlış sinyalleri ortadan kaldırma yetenekleriyle ünlüdür. Kafa karıştırıcı fiyat dalgalanmalarına veda edin ve daha sorunsuz, daha güvenilir bir grafik sunumuna merhaba deyin. Quantum Heiken Ashi PRO'yu gerçekten benzersiz kılan şey, geleneksel şamdan verilerini okunması kolay renkli çubuklara dönüştüren yenilikçi formülüdür. Kırmızı ve yeşil çubukl
A key element in trading is zones or levels from which decisions to buy or sell a trading instrument are made. Despite attempts by major players to conceal their presence in the market, they inevitably leave traces. Our task was to learn how to identify these traces and interpret them correctly. Reversal First Impulse levels (RFI)   -  Version MT4                  INSTRUCTIONS                 RUS                 ENG                         R ecommended to use with an indicator   -  TREND PRO  
Öncelikle, bu Ticaret Aracının Non-Repainting, Non-Redrawing ve Non-Lagging Gösterge olduğunu vurgulamakta fayda var, bu da onu profesyonel ticaret için ideal hale getiriyor. Akıllı Fiyat Hareketi Kavramları Göstergesi, hem yeni hem de deneyimli tüccarlar için çok güçlü bir araçtır. İleri ticaret fikirlerini, Inner Circle Trader Analizi ve Smart Money Concepts Ticaret Stratejileri gibi 20'den fazla kullanışlı göstergeyi bir araya getirerek bir araya getirir. Bu gösterge, büyük kurumların tica
FX Power MT5 NG
Daniel Stein
5 (5)
Sabah Brifingimiz burada mql5 ve on Telegram! FX Power MT5 NG , uzun zamandır çok popüler olan döviz gücü ölçerimiz FX Power'ın yeni neslidir. Peki bu yeni nesil güç ölçer ne sunuyor? Orijinal FX Power hakkında sevdiğiniz her şey PLUS GOLD/XAU güç analizi Daha da hassas hesaplama sonuçları Ayrı ayrı yapılandırılabilir analiz dönemleri Daha da iyi performans için özelleştirilebilir hesaplama limiti Özel çokluDaha fazlasını görmek isteyenler için örnek ayarlar Her grafikte en sevdiğiniz renkler i
Advanced Supply Demand MT5
Bernhard Schweigert
4.53 (15)
Herhangi bir Acemi veya Uzman Tüccar için En İyi Çözüm! Bu gösterge benzersiz, yüksek kaliteli ve uygun fiyatlı bir ticaret aracıdır çünkü bir dizi tescilli özelliği ve yeni bir formülü bir araya getirdik. Bu güncelleme ile çift zaman dilimi dilimlerini gösterebileceksiniz. Yalnızca daha yüksek bir TF gösteremeyeceksiniz, aynı zamanda TF grafiğini ve ARTIK daha yüksek TF'yi de gösterebileceksiniz: YUVARLAK BÖLGELERİ GÖSTERMEK. Tüm Arz Talebi tüccarları buna bayılacak. :) Önemli Bilgiler Açıkland
TPSpro TRENDPRO  - is a trend indicator that automatically analyzes the market and provides information about the trend and each of its changes, as well as giving signals for entering trades without redrawing! The indicator uses each candle, analyzing them separately. referring to different impulses - up or down impulse. Exact entry points into transactions for currencies, crypto, metals, stocks, indices!  -  Version MT4                  DETAILED DESCRIPTION        /       TRADING SETUPS       
This is arguably the most complete harmonic price formation auto-recognition indicator you can find for the MetaTrader Platform. It detects 19 different patterns, takes fibonacci projections as seriously as you do, displays the Potential Reversal Zone (PRZ) and finds suitable stop-loss and take-profit levels. [ Installation Guide | Update Guide | Troubleshooting | FAQ | All Products ] It detects 19 different harmonic price formations It plots primary, derived and complementary Fibonacci p
Noize Absorption Index - is the manual trading system that measures the difference of pressure between bears forces and bulls forces. Green line - is a noize free index that showing curent situation. Zero value of index shows totally choppy/flat market.Values above zero level shows how powerfull bullish wave is and values below zero measures bearish forces.Up arrow appears on bearish market when it's ready to reverse, dn arrow appears on weak bullish market, as a result of reverse expectation.
MetaForecast M5
Vahidreza Heidar Gholami
5 (2)
MetaForecast, fiyat verilerindeki harmonileri kullanarak herhangi bir piyasanın geleceğini tahmin eder ve görselleştirir. Piyasa her zaman tahmin edilemezken, fiyatlarda bir desen varsa, MetaForecast geleceği mümkün olduğunca doğru bir şekilde tahmin edebilir. Benzer ürünlere göre, MetaForecast piyasa eğilimlerini analiz ederek daha kesin sonuçlar üretebilir. Giriş Parametreleri Past size (Geçmiş boyut) MetaForecast'ın gelecekteki tahminler oluşturmak için kullandığı çubuk sayısını belirtir. M
Was: $249  Now: $99   Market Profile defines a number of day types that can help the trader to determine market behaviour. A key feature is the Value Area, representing the range of price action where 70% of trading took place. Understanding the Value Area can give traders valuable insight into market direction and establish the higher odds trade. It is an excellent addition to any system you may be using. Inspired by Jim Dalton’s book “Mind Over Markets”, this indicator is designed to suit the
Top indicator for MT5   providing accurate signals to enter a trade without repainting! It can be applied to any financial assets:   forex, cryptocurrencies, metals, stocks, indices .  Watch  the video  (6:22) with an example of processing only one signal that paid off the indicator! MT4 version is here It will provide pretty accurate trading signals and tell you when it's best to open a trade and close it. Most traders improve their trading results during the first trading week with the help of
Gartley Hunter Multi
Siarhei Vashchylka
5 (6)
Gartley Hunter Multi - An indicator for searching for harmonic patterns simultaneously on dozens of trading instruments and on all classic timeframes: (m1, m5, m15, m30, H1, H4, D1, Wk, Mn). Manual (Be sure to read before purchasing) | Version for MT4 Advantages 1. Patterns: Gartley, Butterfly, Shark, Crab. Bat, Alternate Bat, Deep Crab, Cypher 2. Simultaneous search for patterns on dozens of trading instruments and on all classic timeframes 3. Search for patterns of all possible sizes. Fr
The Volume by Price Indicator for MetaTrader 5 features Volume Profile and Market Profile TPO (Time Price Opportunity). Get valuable insights out of currencies, equities and commodities data. Gain an edge trading financial markets. Volume and TPO histogram bar and line charts. Volume Footprint charts. TPO letter and block marker charts including split structures. Versatile segmentation and compositing methods. Static, dynamic and flexible ranges with relative and/or absolute visualizations. Lay
Golden Gate Algo MT5
James David Lane
4 (6)
CHRISTMAS İÇİN %40 İNDİRİM! 1 OCAK'TA FİYATI $250'YE YÜKSELECEK! GoldenGate Entries Tanıtımı: Keskin Kenarlı Bir Ticaret Çözümü! GoldenGate Entries (GGE) ile ticarette devrim niteliğinde bir yaklaşım keşfedin. GGE, ticaret deneyiminizi yükseltmek amacıyla tasarlanmış gelişmiş bir gösterge olup kullanıcılara ticaret kararlarında hassasiyet ve güven sağlamak için kapsamlı bir özellik seti sunar. Çiftler: Herhangi biri (FX - Emtia - Hisse Senetleri - Hisse Senetleri - Kripto) Zaman Çerçeve
Good day! I present to you a trading technical indicator for Deriv broker synthetic indices. This indicator ONLY works with the following indices: Boom 300 Index Boom 500 Index Boom 1000 Index Crash 300 Index Crash 500 Index Crash 1000 Index The indicator was created to give signals to open medium-term trades in the direction of Spikes. But you can open trades in the opposite direction to Spikes, at your own risk. Trade only on M1. Other TFs do not guarantee the correct operation of the indic
FxaccurateLS
Shiv Raj Kumawat
WHY IS OUR FXACCCURATE LS MT5 THE PROFITABLE ? PROTECT YOUR CAPITAL WITH RISK MANAGEMENT Gives entry, stop and target levels from time to time. It finds Trading opportunities by analyzing what the price is doing during established trends. POWERFUL INDICATOR FOR A RELIABLE STRATEGIES We have made these indicators with a lot of years of hard work. It is made at a very advanced level. Established trends provide dozens of trading opportunities, but most trend indicators completely ignore them!
Yeni Başlayanlar veya Uzman Tüccarlar için En İyi Çözüm! Bu gösterge benzersiz, yüksek kaliteli ve uygun fiyatlı bir ticaret aracıdır çünkü bir dizi tescilli özellik ve gizli bir formül ekledik. Yalnızca BİR grafikle 28 döviz çiftinin tümü için Uyarılar verir. Yeni bir trendin veya scalping fırsatının tam tetik noktasını belirleyebildiğiniz için ticaretinizin nasıl gelişeceğini hayal edin! Yeni temel algoritmalar üzerine inşa edilen bu sistem, potansiyel işlemlerin belirlenmesini ve onaylan
XQ Indicator MetaTrader 5
Marzena Maria Szmit
5 (1)
Step into the realm of Forex trading with confidence and precision using XQ, a cutting-edge Forex indicator designed to elevate your trading game to unprecedented heights. Whether you're a seasoned trader or just stepping into the world of currency exchange, XQ Forex Indicator empowers you with the insights and signals needed to make informed trading decisions. The signal conditions are a combination of three indicators, and XQ Forex Indicator only display  medium and long-term trends . The ind
Blahtech Supply Demand MT5
Blahtech Limited
4.57 (14)
Was: $299  Now: $99   Supply Demand uses previous price action to identify potential imbalances between buyers and sellers. The key is to identify the better odds zones, not just the untouched ones. Blahtech Supply Demand indicator delivers functionality previously unavailable on any trading platform. This 4-in-1 indicator not only highlights the higher probability zones using a multi-criteria strength engine, but also combines it with multi-timeframe trend analysis, previously confirmed swings
Wolfe Waves are naturally occurring trading patterns present in all financial markets and represent a fight towards an equilibrium price. These patterns can develop over short and long-term time frames and are one of the most reliable predictive reversal patterns in existence, normally preceding strong and long price movements. [ Installation Guide | Update Guide | Troubleshooting | FAQ | All Products ] Clear trading signals Amazingly easy to trade Customizable colors and sizes Implements perfo
The iPump indicator is a versatile indicator  that combines the advantages of three categories of indicators. simultaneous trend detection on several Timeframes defining zones of resistance and support determination of overbought and oversold zones Indicator functions: Defining a trend This function will be necessary for all traders who want to objectively assess the current market direction and avoid subjectivity. It will be clear and intuitive. Determination of support and resistance levels U
Royal Scalping Indicator M5
Vahidreza Heidar Gholami
5 (8)
My products are currently 50% off. Explore them and build your own strategy. Royal Scalping Indicator is an advanced price adaptive indicator designed to generate high-quality trading signals. Built-in multi-timeframe and multi-currency capabilities make it even more powerful to have configurations based on different symbols and timeframes. This indicator is perfect for scalp trades as well as swing trades. Royal Scalping is not just an indicator, but a trading strategy itself. Features Price A
Gartley Hunter MT5
Siarhei Vashchylka
5 (13)
Gartley Hunter - An indicator for searching for harmonic patterns (Gartley patterns) and their projections. The indicator is equipped with a system of alerts and push notifications. Manual (Be sure to read before purchasing) | Version for MT4 Advantages 1. 12 harmonic patterns: 7 classical and 5 exotic. New patterns will be added as the indicator develops. 2. Constant automatic search for harmonic patterns. The indicator is capable of finding from the smallest to the largest patterns. 3. Autom
Bill Williams Advanced
Siarhei Vashchylka
5 (5)
Bill Williams Advanced is designed for automatic chart analysis using Bill Williams' "Profitunity" system. The indicator analyzes four timeframes at once. Manual (Be sure to read before purchasing) Advantages 1. Automatically analyzes the chart using the "Profitunity" system of Bill Williams. The found signals are placed in a table in the corner of the screen. 2. Equipped with a trend filter based on the Alligator indicator. Most of the system signals are recommended to be used only accordi
Yazarın diğer ürünleri
RSI Alarm Osw
William Oswaldo Mayorga Urduy
RSI ALARM (For Metatrader 5) This indicator works like a normal RSI with all its settings (Periodicity, colors, levels, etc), but additionally, alarms can be set at the upper and lower level (Example 70 and 30), with the possibility of adjusting these levels by moving the blue and red lines to establish the upper and lower levels. You can also turn on and off an additional function that creates an arrow on the chart when the expected upper or lower RSI is met.
GAPS Indicator MT5
William Oswaldo Mayorga Urduy
GAPS göstergesi Metatrader 5 Endekslerde, hisse senetlerinde ve diğer varlıklarda kullanılan stratejilerden bazıları için genellikle her bir mum çubuğunun GAP'ı ölçülür, ancak bunu manuel olarak yapmak istersek bu, hesaplama hataları yapmamıza neden olabilir. Bu nedenle, mumların her biri arasında sunulan GAPS'lerin her birinin PIPS değerini otomatik olarak gösteren ve seçenek etkinleştirildiğinde ortaya çıktıklarında bir alarm oluşturan "GAP Göstergesi" oluşturulmuştur.
RSI Alarm Osw MT4
William Oswaldo Mayorga Urduy
RSI ALARM (For Metatrader 4) This indicator works like a normal RSI with all its settings (Periodicity, colors, levels, etc), but additionally, alarms can be set in the upper and lower level (Example 70 and 30), with the possibility of adjusting these levels by moving the upper and lower lines found on the indicator. You can also activate and deactivate an additional function that puts an arrow on the chart when the expected upper or lower RSI is met.
SORS Osw MT4
William Oswaldo Mayorga Urduy
THE SORS COMPLEXES (For Metatrader 4) This indicator is designed to draw the SORS lines on the graph, these are the modern way of calculating market points that it usually respects, they are comprised of supports and resistance, but unlike the classics, these are calculated from volatility endogenous and standard deviation, In the configuration you can change the color of each level linear and hide the ones that are not needed. A = Annual. M = Monthly. W = Weekly D = Daily.
Divergence Osw Metatrader 4
William Oswaldo Mayorga Urduy
DIVERGENCE OSW  (For Metatrader 4) This indicator works on divergences and has the following functions: Generate an alert when a divergence occurs. Create lines by calculating the Stoploss and Takeprofit according to projection waves of inverse waves. Create an arrow indicating the possible direction of the market. The signals sent by the indicator are given when the candle ends. The Trader must evaluate each divergence to take entries. Settings: Activation and deactivation of alerts. Alert inte
Trading Sesions MT4
William Oswaldo Mayorga Urduy
COMMERCIAL SESSIONS This indicator shows in the selected graph divided by tables each of the sessions ASIA, JAPAN, LONDON, NEW YORK: Allows you to configure: Session Color  ASIA, JAPON, LONDRES, NEW YORK Hide and show each session It works in the lowest timeframes on the market, among which H4, H1, M15, M5 and M1 are recommended. (Don't forget to check out our other indicators)
Automatic Support and Resistance Osw MT4 This Indicator graphs lines at the possible support and resistance points of the selected asset. it works in multiple temporalities. allows you to configure: Color of the lines. Width of the lines. Type of lines. When the indicator begins its operation, it analyzes the supports and resistances of higher levels for the temporality in which it is working.
Round Numbers Osw MT4
William Oswaldo Mayorga Urduy
ROUND NUMBERS (For Metatrader 4) This indicator allows you to add horizontal lines according to the round numbers that the asset contains. Unlike other indicators, this one calculates the closest levels dynamically and automatically as the price moves. works on currency pairs, indices, metals, stocks, etc. Round with 5 digits, 3 digits and integers of 10 100 or 1000. lines can be adjusted in parameters like: Hide the line or round number that you do not want to display. line col
SUPPORT LINES AND RESISTORS + COMMAND BLOCKS for METATRADER 4 A much more pleasant visual way to locate supports and resistance, unlike normal horizontal lines, these can be located from a specific point, without extending backwards, making the graph not look good, it also shows the name of the temporality in which it was created so that when you are operating, you can know to which temporality it belongs. You can also create order blocks in a comfortable and visual way, where you can also
Whatch and Candle Alarm Osw MT4
William Oswaldo Mayorga Urduy
Osw Watch for METATRADER 4 This is an indicator that shows the remaining time for the current candle to expire on a watch, this is always located next to the last candle following the price, the numbers are shown the same as in the images, and can be modified both in size and color. between your settings you can set: the size of the numbers showing the time. the color of the numbers showing the time. Also within the configuration you can activate and deactivate so that an alarm sounds
Alert Up Down MT4
William Oswaldo Mayorga Urduy
ALERT UP - DOWN FOR METATRADER 5 This indicator generates an alert when the price leaves the zone between the UP and DOWN lines. You can generate alerts of various types such as: > Sound > Message box > Message in the expert box > Mail (previously configured) > PUSH notifications (previously configured) The lines must be configured from the indicator properties and not from the lines properties, since if it is done from the lines properties, the finonacci may be affected.
Break Out Signal Osw
William Oswaldo Mayorga Urduy
KIRMA SİNYALİ OSW (METATRADER 4) İnişleri ve çıkışları kırmak için çalışmak ister misiniz? bu, bu tür girişlerden sinyal almak için mükemmel bir göstergedir. Gösterge başlar başlamaz, size herhangi bir sinyal göstermeyecek, ancak fiyat ilerledikçe, patlak verecek mükemmel modeli bulana kadar piyasayı okuyacak. Yüksekleri ve alçakları okumak için gösterge, Zig Zag için yalnızca en uygun olanları almaya izin veren özel bir konfigürasyona sahiptir. Herhangi bir gösterge gibi, mükemmel gi
Automatic OrderBlocks Osw MT4
William Oswaldo Mayorga Urduy
OTOMATİK SİPARİŞ BLOKLARI OSW (METATRADER 5) Bu gösterge, Sipariş Bloklarını önceden belirlenmiş bazı kurallara göre göstermekten sorumludur, bunlardan bazıları: >önceki dürtüyü kıran bir dürtü vardır. >Bulunduğu zaman oluşan şamdan formasyonunu bulmak, yerin en yüksek ve en düşük seviyesini en verimli şekilde hesaplamak, Order Block'un en yüksek ve en düşük seviyesini oluşturmakla görevlidir. >Sipariş Bloğu oluşturulduktan sonra Gösterge, olası bir sinyal olduğunu belirten bir uyarı
SORS Osw
William Oswaldo Mayorga Urduy
THE SORS COMPLEXES This indicator is designed to draw the SORS lines on the graph, these are the modern way of calculating market points that it usually respects, they are comprised of supports and resistance, but unlike the classics, these are calculated from volatility endogenous and standard deviation, In the configuration you can change the color of each level linear and hide the ones that are not needed. A = Annual. M = Monthly. W = Weekly D = Daily.
Automatic Support and Resistance Osw MT5 This Indicator graphs lines at the possible support and resistance points of the selected asset. it works in multiple temporalities. allows you to configure: Color of the lines. Width of the lines. Type of lines. When the indicator begins its operation, it analyzes the supports and resistances of higher levels for the temporality in which it is working.
Round Number Osw MT5
William Oswaldo Mayorga Urduy
ROUND NUMBERS (For Metatrader 5) This indicator allows you to add horizontal lines according to the round numbers that the asset contains. Unlike other indicators, this one calculates the closest levels dynamically and automatically as the price moves. works on currency pairs, indices, metals, stocks, etc. Round with 5 digits, 3 digits and integers of 10 100 or 1000. lines can be adjusted in parameters like: Hide the line or round number that you do not want to display. line col
SUPPORT LINES AND RESISTORS + COMMAND BLOCKS for METATRADER 5 A much more pleasant visual way to locate supports and resistance, unlike normal horizontal lines, these can be located from a specific point, without extending backwards, making the graph not look good, it also shows the name of the temporality in which it was created so that when you are operating, you can know to which temporality it belongs. You can also create order blocks in a comfortable and visual way, where you can also
Multi Temporalities Osw MT5
William Oswaldo Mayorga Urduy
MULTI-TIMES FOR METATRADER 5 This indicator, in a lower window, shows the current chart in different timeframes, this can help you better decipher the market, taking into account the higher timeframes. Among the settings that you can modify are: view of prices in charts view of the temporalities in the graphs enable each of the graphics in the different temporalities (M1, M5, M15, H1, H4, D1, W1, MN1).
Whatch and Candle Alarm Osw MT5
William Oswaldo Mayorga Urduy
Osw Watch for METATRADER 5 This is an indicator that shows the remaining time for the current candle to expire on a watch, this is always located next to the last candle following the price, the numbers are shown the same as in the images, and can be modified both in size and color. between your settings you can set: the size of the numbers showing the time. the color of the numbers showing the time. Also within the configuration you can activate and deactivate so that an alarm sounds
Alert Up Down MT5
William Oswaldo Mayorga Urduy
ALERT UP - DOWN FOR METATRADER 5 This indicator generates an alert when the price leaves the zone between the UP and DOWN lines. You can generate alerts of various types such as: > Sound > Message box > Message in the expert box > Mail (previously configured) > PUSH notifications (previously configured) The lines must be configured from the indicator properties and not from the lines properties, since if it is done from the lines properties, the finonacci may be affected.
Master Calendar Osw
William Oswaldo Mayorga Urduy
OSW ANA TAKVİMİ Bu gösterge başlangıçta kişisel kullanımım için oluşturuldu, ancak onu yavaş yavaş geliştiriyorum ve günlük ticaretime yardımcı olacak işlevler uyguluyorum ve yararlı olmaları durumunda işlevler uygulanmaya devam edecek. TAKVİM DETAYLARI. >Tarih, Ülke, Para Birimi, Haberin Sektörü, Haberin Adı ve Önceki, tahmin ve Güncel veriler gibi verilerle güncel tarihe yakın mobil ve ayrıntılı haber takvimi. >Takvim her 5 dakikada bir otomatik olarak güncellenir. >Menüden hangi ha
Volumes Direction MT5
William Oswaldo Mayorga Urduy
HACİM YÖNÜ MT5 Normalde, mevcut ses seviyesi öncekinden daha yüksek olduğunda ses seviyesi göstergesi varsayılan bir renk değişikliğine sahiptir, bu önemlidir ancak çok kullanışlı değildir. Bu nedenle, bu gösterge, normal hacme ek olarak, mum yükseliş veya düşüş olduğunda, onları farklı bir renge boyar, varsayılan olarak yükseliş için mavi ve düşüş için kırmızıdır, ancak bu renkler özelleştirilebilir. Tüccar tadı. Ticaretinizi geliştirmenize yardımcı olacak diğer göstergelerime göz at
Trade Panel Osw MT5
William Oswaldo Mayorga Urduy
TİCARET PANELİ OSW METATRADE 5 Bu panel, hesapta oluşturulan para birimine göre her bir işlemin maliyetini görüntülemenize olanak tanıyan piyasa emirleri vermenize yardımcı olacaktır. İŞLEV KILAVUZU: 1) Butonları ile veya yazılı olarak bir DURDURMA seçin (Koyma seçeneğini aktif veya pasif hale getirebilirsiniz). 2) Butonları ile veya yazılı olarak bir TAKEPROFIT seçin (Koyma seçeneğini aktif veya pasif hale getirebilirsiniz). 3) veya düğmeleri yazılı olarak bir VOLUME seçin. 4) "Piy
Sinyal veren bir göstergeniz var ve bunu Expert'e dönüştürmek mi istiyorsunuz? Bu uzmanla, göstergenizi yeniden programlamak veya uyarlamak zorunda kalmadan dönüştürebilirsiniz, doğru şekilde yapılandırmak için adımları izlemeniz yeterlidir: 1) Gösterge, göstergeler klasöründe olmalıdır. 2) Gösterge tarafından sağlanan AL ve SAT tamponlarını dikkatlice seçmelisiniz. 3) Tüm işlemleri mi yoksa sadece AL veya SATIŞ türündeki işlemleri mi almak istediğinizi seçin. 4) İşleminize bağlı ol
Local Copy Trading Osw
William Oswaldo Mayorga Urduy
YEREL KOPYA TİCARET OSW İşlemleri bir hesaptan diğerine kopyalamak istiyorsanız bu mükemmel bir araçtır. Uzmanı yapılandırmak için aşağıdaki adımları izlemelisiniz: 1) SLAVE terminalinde otomatik ticaretin etkinleştirildiğini doğrulayın. 2) EA'nın SLAVE terminalinde ticaret izinlerine sahip olduğunu doğrulayın. 3) Uzmanı bir MASTER grafiğine ekleyin ve MASTER olarak yapılandırın. 4) Expert'i bir SLAVE grafiğine ekleyin ve SLAVE olarak yapılandırın (1,2,3,4,5) 5) SLAVE'lerde kişise
Microlots Deriv
William Oswaldo Mayorga Urduy
TÜREV MİKROLOTLAR Bu panel, aracının yerleştirilmesine izin vermediğinde, yalnızca aracının Hacim adımını Minimum Hacimden daha düşük olması koşuluyla mikro lotlar girebileceğiniz geleneksel Panel'in yerini alır. Örneğin: Minimum Hacim 0,20 ve adım 0,01 ise ve 0,02 koymak istiyorsanız, normalde bunu yapamazsınız, ancak bu araç, açık siparişin kalması için siparişin gönderilmesini yönetmeye özen gösterecektir. 0.02 değeri. Bu aracı tamamlayacak önerilere açığız.
Heat Map OSW
William Oswaldo Mayorga Urduy
BAŞ HARİTASI OSW Bu gösterge, tüm para birimi kombinasyonlarının mevcut durumunu ve varyasyonlarını bilmek için idealdir. Varyasyon, fiyatın mevcut fiyattan 24 saat öncesine veya menüde yapılandırılan her şeye göre yüzde hareketiyle hesaplanır. Bir para biriminin varyasyonunu bilmek için birincil para birimine bakmanız yeterlidir, örneğin: EUR'da diğer para birimleriyle karşılaştırmak için dikey bakmanız gerekiyor ve hepsinin sonunda tüm bu varyasyon değerlerinin ortalamasını buluyorsun
ESS Enguifing Strategy Signals
William Oswaldo Mayorga Urduy
ESS ETKİLEYİCİ DURUM SİNYALLERİ Bu gösterge, bir filtrenin uygulandığı zarf tipi mumları algılar, bu filtre, ölçülebilir parametreler dahilinde mümkün olan en büyük etkinliği belirlemenin mümkün olduğu 3 stratejiden oluşur. Sinyaller, her yön için yukarı ve aşağı oklarla gösterilir ve ayrıca uyarıları, e-postaları ve cep telefonuna push mesajlarını etkinleştirebilir veya devre dışı bırakabilirsiniz. Hiçbir göstergenin %100 etkili olmadığını belirtmekte fayda var, bu nedenle kendi strateji
ÇOKLU ZAMANLI ÇERÇEVE HAREKETLİ ORTALAMA OSW (METATRADER 5) Bu gösterge, her tür konfigürasyonun hareketli ortalamalarını eklemenize izin verir, farkla, bir zaman dilimindeyseniz, bir örnek vermek gerekirse, 5 dakikalık bir zaman dilimindeyseniz daha yüksek bir seviyede bir tane ekleyebilirsiniz. ve 15 dakikalık, 1 saatlik ve 4 saatlik geçiciliğin 20 üstel hareketli ortalamasını görmek istiyorsanız, yalnızca gösterge menüsünde doğru parametreleri yapılandırarak bunları gösterge görüntülerin
Points Candles Osw
William Oswaldo Mayorga Urduy
PUANLAR MUMLAR OSW (METATRADER 5) Bu gösterge ile, grafikte işlenen mumların her birinin puan cinsinden boyutunu öğrenebilir, size her birinin boyutu ve yönü hakkında bilgi verebilir, gösterge yükseliş ise yukarıyı, düşüş ise aşağıyı gösterecektir. . Ek olarak, tüm mumları da gizleyebilir veya gösterebilirsiniz, yalnızca yükseliş gösterenler veya yalnızca düşüş gösterenler, bu, Deriv gibi tek yönde daha güçlü mumlar veren varlıkları yöneten aracı kurumlar içindir, aracı kurum normal ise bu
Filtrele:
İnceleme yok
İncelemeye yanıt