YouTube'dan Mağaza ile ilgili eğitici videoları izleyin
Bir ticaret robotu veya gösterge nasıl satın alınır?
Uzman Danışmanınızı
sanal sunucuda çalıştırın
sanal sunucuda çalıştırın
Satın almadan önce göstergeyi/ticaret robotunu test edin
Mağazada kazanç sağlamak ister misiniz?
Satış için bir ürün nasıl sunulur?
MetaTrader 5 için teknik göstergeler - 2

Göstergemiz, aynı anda birden fazla çiftin yayılmasını izlemek için bir yayılma ayırıcı sağlar ve ayrıca bir mum zamanlayıcı geri sayımı, mevcut çubuk kapanmadan ve yeni bir çubuk oluşmadan önce kalan süreyi görüntüler.
SINIRLI SÜRELİ TEKLİF: Tüm premium göstergelerimiz sadece 50$ karşılığında mevcuttur, MQL5 blogumuza erişerek premium göstergelerimizin tüm ayrıntılarını bulacaksınız. Buraya Tıkla.
Ana Özellikler Aynı anda yayılan çoklu çiftleri izleyin. Yerel saati değil, sunucu saatini
FREE

VR ATR Pro is a powerful professional tool for determination of target levels on a financial instrument. The indicator's effectiveness has been proved by thousands tests on real and demo accounts. VR ATR Pro is the indicator that works on real data using live true statistics. Statistics is stubborn, the usage of real statistical data in mathematical calculations allows you to calculate the exact target levels for a financial instrument. Kurulum dosyaları, talimatları ve iyi bir bonus için bana m

Magic Candles , mevcut piyasa aşamasını (yükseliş trendi, düşüş trendi veya düz) belirlemeye olanak tanıyan yeni bir üründür.
Bu gösterge, piyasanın mevcut durumuna göre çubukları farklı renklere boyar ve uyarılarla kullanıcıya trend değişiklikleri hakkında sinyal verir.
Magic Candles , para birimleri (kripto para birimleri dahil) ve ikili opsiyon ticareti için mükemmeldir.
Avantajları Ölçeklendirme ve gün içi ticaret için uygundur. Gösterge yeniden çizilmez (yeniden hesaplanır), sinyalle

A simple indicator that automatically highlights all FVGs (Fair Value Gaps) formed on the chart, as well as FVGs on history. It is possible to select colors for FVGs of different directions (long or short), select the time interval, select the color of middle point and you can also choose whether to delete filled FVGs or leave them on the chart (the option is beneficial for backtesting). The indicator can be very useful for those, who trade according to the concept of smart money, ICT, or simply
FREE

MACD (short for Moving Average Convergence/Divergence) is one of the most famous and oldest indicators ever created and is widely used among beginners . However, there is a newer version of the MACD that is named Impulse MACD which have less false signals than the standard MACD. Classic MACD helps us to identify potential trends by displaying crossovers between two lines. If MACD line crosses above the Signal line it shows us that the market is potentially up trending and that
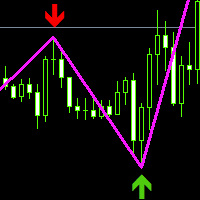
This index is based on the secondary development of zigzag, adding high and low point arrow indication, thickening the line and changing the color. Can be a good display of the current admission trading signals, current long or short. It can be combined with other indicators to determine the trading point, which has great reference value. Compared with the general trend index or oscillation batch standard, the accurate determination is higher from the perspective of historical data research and
FREE

MT4 version | Owl Smart Levels Indicator | Owl Smart Levels stratejisi | FAQ Fractals Indicator , yazarın Bill Williams ticaret stratejisinin unsurlarından biridir. Fiyat tablosunda fiyat dönüş noktalarını ve dolayısıyla destek ve direnç seviyelerini aramak için kullanılır. Full Fractals Indicator , neredeyse tüm ticaret terminallerinin araç setinde bulunan geliştirilmiş bir Fractals. Tek farkı, bir fraktal oluşturmak için ana mumun solunda 5 ve sağında 2 mum kullanmamızdır (bkz.
FREE

Tasaruf edin ve VWAP'lerle daha doğru kararlar verin Bu aracın gücünü test etmek istiyorsanız, ücretsiz MetaTrader 5 için bağlı VWAP göstergisini indirebilirsiniz. Bu gösterge bağımsız olarak çalışmanın yanı sıra aynı zamanda ücretsiz Sweet VWAP'in bir uzantısıdır. Çünkü ücretsiz sürüme tıkladığınızda, fare imlecinde gördüğünüz VWAP, bu gösterge olarak sabitlenecektir. Ve daha iyi anlamak için, sabitlenen şey bu göstergedir ve sahip olduğu tüm özelliklere sahiptir. Bu gösterge, MetaTrader 5 için

Dark Oscillator is an Indicator for intraday trading. This Indicator is based on Counter Trend strategy, trying to intercept changes in direction, in advance compared trend following indicators. We can enter in good price with this Indicator, in order to follow the inversion of the trend on the current instrument. It is advised to use low spread ECN brokers. This Indicator does Not repaint and N ot lag . Recommended timeframes are M5, M15 and H1. Recommended working pairs: All. I nst

RSI divergence indicator finds divergences between price chart and RSI indicator and informs you with alerts (popup, mobile notification or email). Its main use is to find trend reversals in the chart. Always use the divergence indicators with other technical assets like support resistance zones, candlestick patterns and price action to have a higher possibility to find trend reversals. Three confirmation type for RSI divergences: RSI line cross 50 level Price returns to previous H/L C
FREE
Fiyatı mıknatıslayacak 3,4 veya 5 kez dokunulan stratejik Bölgeyi anında alın | PowerZONES'a göre TP1/TP2/TP3'ü otomatik olarak puan veya değer olarak alın | Risk/Ödül oranınızın güvenliğini görsel olarak kontrol edin | Gecikmesiz, takip edilmeyen gösterge - manuel ve otomatik ticaret için ideal - tüm varlıklar ve tüm zaman birimleri için uygun Lansman için ÜCRETSİZ - sonra 99$ Satın aldıktan sonra, kişiselleştirilmiş ayarlar için bu kanaldan benimle iletişime geçin . MT4
FREE

MT5 için uyarılar içeren Otomatik Sabit Aralık Hacim Profili
Bu gösterge, fiyatın nerede daha fazla zaman harcadığını gösterir ve ticarette kullanılabilecek önemli seviyeleri vurgular.
ve belirli bir ticaret seansının en önemli fiyat seviyelerini, değer alanını ve kontrol değerini özetleyerek zaman içindeki fiyat yoğunluğunu gösterebilir. Bu gösterge, M1 ile D1 arasındaki zaman dilimlerine eklenebilir ve günlük, haftalık, aylık ve hatta gün içi oturumlar için Piyasa Profilini gösterir. Daha

The market is unfair if only because 10% of participants manage 90% of funds. An ordinary trader has slim changes to stand against these "vultures". This problem can be solved. You just need to be among these 10%, learn to predict their intentions and move with them. Volume is the only preemptive factor that faultlessly works on any timeframe and symbol. First, the volume appears and is accumulated, and only then the price moves. The price moves from one volume to another. Areas of volume accumu
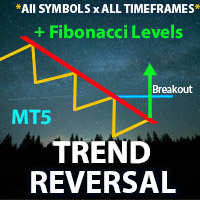
** All Symbols x All Timeframes scan just by pressing scanner button ** *** Contact me after the purchase to send you instructions and add you in "Trend Reversal group" for sharing or seeing experiences with other users. Introduction: Trendlines are the most famous technical analysis in trading . Trendlines continually form on the charts of markets across all the different timeframes providing huge opportunities for traders to jump in and profit on the action. In the other hand, The tre

Full implementation of Directional Movement System for trading, originally developed by Welles Wilder, with modifications to improve profitability, to reduce the number of unfavorable signals, and with Stop Loss lines.
No re-paint
Features
Buy/sell signals displayed on the chart Stop levels visually indicated on the chart Profit-taking points presented in the indicator window Exit points for unfavorable positions presented in the indicator window Signal confirmation through high/low swing c

The Nadaraya Watson Envelop indicator for MT5 is a popular tool used by traders to identify trends and potential buy/sell signals. The indicator is based on a non-parametric regression model that uses kernel smoothing to estimate the underlying trend of the market. The resulting envelopes are then plotted around the trend line, providing traders with an indication of where prices are likely to fluctuate. One of the key features of this indicator is its ability to send alerts, emails, and notific

RSI Entry Points is the upgrade of the standard RSI indicator to avoid lagging. Indicator draws the clouds and the arrows to have clear picture where price is and what to wait for. Why standard RSI is lagging? because mostly we do not use it correctly and it is with very weak visual flexibility, less informativity. With my current upgrade I tried to Fix both problems same time and I got much better results and more exact entries than standard RSI has. To make yourself sure check out the screens
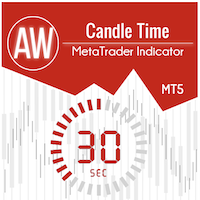
Mumun sonuna kadar geçen sürenin göstergesi. Sunucu saatinin yanı sıra mumun sonuna kadar geçen süreyi gösterir. Metin, mumun eğilimini veya yönünü görüntüleyebilir, sesli bildirimler yerleşiktir özellikler:
Mevcut mumun sonuna kadar olan süreyi ve gerekirse ayarlanabilen veya devre dışı bırakılabilen diğer zaman dilimlerini görüntüler. AW Mum Zamanı, AW Süper Trend göstergesi ile mevcut mumun veya trendin yönünü seçebilir Trend stratejisi seçilen renkte vurgulanır Mumu değiştirmeden önce yerle
FREE

MT5 için Koala FVG'yi tanıtalım: Fair Value Gap (FVG) desenleri için profesyonel bir gösterge. Koala FVG: MT5'te Hassas İşlemler İçin Yolunuz Koala FVG ile Fair Value Gap (FVG) deseninin gücünü keşfedin - MetaTrader 5 için tasarlanmış son teknoloji bir göstergedir. Kısıtlı bir süre için, bu profesyonel araca ücretsiz erişim sağlayabilirsiniz, daha sonra premium bir göstergeye dönüşmeden önce. Ana Özellikler: FVG Deseni Tespiti: Koala FVG, özelleştirilebilir minimum ve maksimum boyut kriterlerine
FREE

The indicator identifies when a divergence occurs between price and an indicator or oscillator. It identifies both regular and hidden divergences. Combined with your own rules and techniques, this indicator will allow you to create (or enhance) your own powerful system. Features
Can detect divergences for the following oscillators/indicators: MACD, OsMA, Stochastics, RSI, CCI, RVI, Awesome, ADX, ATR, OBV, Composite index, MFI and Momentum. Only one oscillator/indicator can be selected. Draws
FREE

MA3 Trend MT5 - is the good trend indicator on three MAs . Benefits of the indicator: The indicator produces signals with high accuracy.
The confirmed signal of the indicator does not disappear and is not redrawn.
You can trade on the MetaTrader 5 trading platform of any broker.
You can trade any assets (currencies, metals, cryptocurrencies, stocks, indices etc.).
You can trade on any timeframes (M5-M15 scalping and day trading / M30-H1 medium-term trading / H4-D1 long-term trading).
FREE

This indicator presents an alternative approach to identify Market Structure. The logic used is derived from learning material created by DaveTeaches (on X)
When quantifying Market Structure, it is common to use fractal highs and lows to identify "significant" swing pivots. When price closes through these pivots, we may identify a Market Structure Shift (MSS) for reversals or a Break of Structure (BOS) for continuations. The main difference with this "protected" logic is in how we determine

Non-lagging VOLATILITY indicator A radical modification of the ATR indicator, which corrected all of its shortcomings (the picture shows the difference with ATR). The indicator shows the swing size of the current market movement. Features: does not have a time window period, i.e. any subjective settings non-delayed, the extremums of the indicator always coincide with the extremum of the price (note the picture) is normalized by means of a color solution, i.e. it has the properties of an oscillat
Boom Scalper Gold It is an indicator, programmed to scalp in a timeframe of 1/5 and 15 Minutes, perfect for hunting spikes and trend sails, where in the parameters of (70) it sends you a sale/sell alert and in the level parameter (8) it sends you a buy signal It is used for indices (BOOM) of synthetic indices (Deriv) It's easy and simple to use, it does all the work by sending you the alerts! the indicator during this period will remain on SALE! Without further ado, enjoy! Good profit. World Inv

The Supertrend indicator was originally created by a french fellow named Olivier Seban , and its goal is to identify the Primary Trend of prices . Its calculation is easy and based on the average of Highs and Lows and then we add the volatility of a custom period, plus a multiplier. This way we get the Supertrend Line. You can find in the web several approaches and trading strategies using this very useful indicator.
HOW TO "READ" THIS INDICATOR
If the closing prices are above Supertrend Line
FREE

Özellikler
Fibonacci Retracement Ticareti için Gösterge 1S, 4S, 1G ve 1H arasında seçilen önceki çubuğa dayalı olarak Fibonacci grafiği çizilir. Piyasa fiyatı Fibonacci seviyesine dokunduğunda, renk değişir ve dokunma zamanı görüntülenir. Fibonacci grafiği -23.6, 0, 23.6, 38.2, 50, 61.8, 76.4, 100 ve 123.6 seviyelerinde çizilir ve çubuk güncellendiğinde grafik yenilenir.
Değişkenler
Zaman aralığı: Fibonacci grafiği, 1S, 4S, 1G ve 1H arasından seçilen zaman aralığıyla çizilir. FiboWidth:
FREE

MOST is applied on this RSI moving average with an extra default option added VAR/VIDYA (Variable Index Dynamic Moving Average)
MOST added on RSI has a Moving Average of RSI and a trailing percent stop level of the Moving Average that can be adjusted by changing the length of the MA and %percent of the stop level.
BUY SIGNAL when the Moving Average Line crosses above the MOST Line
LONG CONDITION when the Moving Average is above the MOST
SELL SIGNAL when Moving Average Line crosses belo

RSI / TDI uyarı panosu, ticaret yaptığınız her büyük çiftte RSI'leri (sizin tarafınızdan seçilebilir) bir kerede izlemenize olanak tanır.
İki şekilde kullanabilirsiniz:
1. Birden fazla zaman çerçevesi seçin ve çizgi, normal ticaret koşullarının ötesine geçen birden fazla zaman çerçevesi olduğunda size gösterecektir. Birden fazla zaman diliminde aşırı alım veya aşırı satım seviyesine ulaştığı için fiyatın son zamanlarda sert bir şekilde yükseldiğinin harika bir göstergesi, bu nedenle yakın

MT4 Version GaussChannelPro is a powerful and innovative trading indicator designed to enhance your trading strategy with the precision of Gaussian-based channels. Leveraging the principles of Gaussian (normal) distribution, this indicator creates a unique channel on your price chart, offering valuable insights into market trends and potential turning points. Utilizing advanced statistical analysis, GaussChannelPro calculates the optimal channel boundaries based on historical price data, present

The Market Structures MT5 indicator finds and shows the Break Of Structures (BoS) pattern on the chart. The pattern is an important part of the Smart Money Concepts (SMC) system.
The appearance of a pattern means that the price breaks the last peak of an uptrend, or the last bottom of a downtrend. This indicates a change in the existing trend structure and the beginning of a new movement.
BOS is a technical analysis tool used to identify trend reversals.
The set of input parameters is simple
FREE

ICT kavramını ticaret etmek için güvenilir bir gösterge arıyorsanız, ICT Piyasa Yapısı daha ileri düzey stratejiler kullanan yatırımcılar için bir kullanım kılavuzu sağlar. Bu hepsi bir arada gösterge, ICT Kavramlarına (Akıllı Para Kavramları) odaklanır. ICT Piyasa Yapısı, kurumların nasıl ticaret yaptığını anlamaya çalışır, hareketlerini tahmin etmeye yardımcı olur. Bu stratejiyi anlayarak ve kullanarak, yatırımcılar piyasa hareketleri hakkında değerli bilgiler edinebilir ve fiyat hareketine da

The indicator draws trendlines on chart. This indicator has six inputs. User can specify alternative labels for both lines. If multiple instances of the indicator are used, the labels must differ. User can set width and color of the lines and depth which specifies what significant peaks should be used. For example, Depth=10 sets trendlines using the current peaks and valleys that have at least 10 bars to the right and to the left and that have highs/lows less/greater than the peak's high/low. In
FREE

This indicator is created by using an exclusive algorithm to indicate you Buy or Sell in an accurate way all the possibles reversals within a normalized trending bands. The main goal for this algorithm is to achieve fast profitable movements and aggressive retracement. Thanks to the normalized bands, using the noises of the market. We have added the "Golden Trade", we define it as the perfect order: For those orders that had the perfect entry price. They were always in profit, or the final pr

Improved version of the free HMA Trend indicator (for MetaTrader 4) with statistical analysis. HMA Trend is a trend indicator based on the Hull Moving Average (HMA) with two periods. HMA with a slow period identifies the trend, while HMA with a fast period determines the short-term movements and signals in the trend direction.
The main differences from the free version: Ability to predict the probability of a trend reversal using analysis of history data. Plotting statistical charts for analyz

Bu gösterge panosu, piyasa yapısını tersine çevirme göstergesiyle kullanım için bir uyarı aracıdır. Birincil amacı, belirli zaman dilimlerinde geri dönüş fırsatları ve ayrıca göstergenin yaptığı gibi uyarıların yeniden test edilmesi (onay) konusunda sizi uyarmaktır. Pano, kendi başına bir grafik üzerinde oturacak ve seçtiğiniz çiftler ve zaman dilimlerinde size uyarılar göndermek için arka planda çalışacak şekilde tasarlanmıştır. Piyasa tersine çevrilme göstergesinin tek bir MT4'te birden fazla
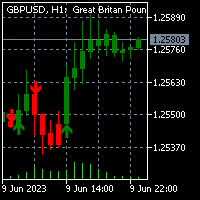
To get access to MT4 version please click here . This is the exact conversion from TradingView: "UT Bot Alerts" by "QuantNomad". This is a light-load processing and non-repaint indicator. Buffers are available for processing in EAs. You can message in private chat for further changes you need. Here is the source code of a simple Expert Advisor operating based on signals from UT Bot Alerts . #include <Trade\Trade.mqh> CTrade trade; int handle_utbot= 0 ; input group "EA Setting" input int magic_
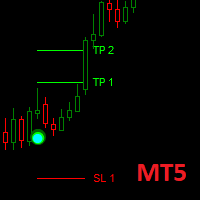
Dark Point is an Indicator for intraday trading. This Indicator is based on Trend Following strategy, also adopting the use of the atr to determine the right volatility. We can enter in good price with this Indicator, in order to follow the strong trend on the current instrument. If you love Dark Point, consider adding some power: Dark Power
Key benefits
Easily visible take profit/stop loss lines Intuitive directional points/arrows by colors Useful statistics , which indicate the
FREE
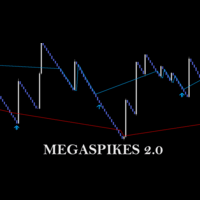
check out Megaclasic Spikes Robot here: https://www.mql5.com/en/market/product/109140 https://www.mql5.com/en/market/product/109140 MEGASPIKES BOOM AND CRASH v 2.0 NB: source codes of this indicator are available: PM me: https://t.me/Machofx The indicator is developed form a Studied combination of MA - Moving Average SAR - Parabolic Support and Resistance CCI - Commodity Channel Index
MegaSpikes 1.0 Download the 'MegaSpikes Boom and Crash' Technical Indicator for MetaTrader 5 in MetaTr
FREE

This is a simple order block locator. Searched for the existence of order blocks only at extremums. If you want multi criteria order block location check my other indicator which is more powerful here These order blocks are ICT order blocks without any buttering.
The indicator can be a useful tool for detecting reversals, continuations. You can also use the indicator as confluence with your other tools
FREE

The multi VWAP indicator will plot on your chart up to 7 different VWAPs: daily, weekly, quarterly and yearly plus up to 2 customizable intraday sessions. It will also plot the closing level of the previous period for each of the VWAPs displayed e.g. during the month of November you will see the VWAP closing level of October or during Q3 you will see the Q2's closing VWAP price. All levels can also display an optional label. Besides, in order to improve the indicator precision, it will automatic
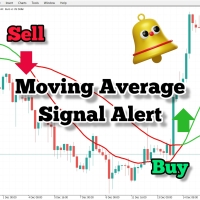
İşlem stratejinizde hareketli ortalamaları kullanıyorsanız, bu gösterge sizin için çok faydalı olabilir. İki hareketli ortalamanın kesişiminde sinyal sağlar, işitsel uyarılar gönderir, işlem platformunuzda bildirimler görüntüler ve olayla ilgili bir e-posta da gönderir. Kendi işlem tarzınıza ve stratejinize uyum sağlamak için kolayca özelleştirilebilir ayarlarla birlikte gelir. Ayarlanabilir parametreler: Hızlı MA (Fast MA) Yavaş MA (Slow MA) E-posta Gönder (Send_Email) İşitsel Uyarılar (Audibl
FREE

** All Symbols x All Timeframes scan just by pressing scanner button ** *** Contact me after the purchase to send you instructions and add you in "Head & Shoulders Scanner group" for sharing or seeing experiences with other users. Introduction: Head and Shoulders Pattern is a very repetitive common type of price reversal patterns. The pattern appears on all time frames and can be used by all types of traders and investors. The Head and Shoulders Scanner indicator Scans All char

This information indicator will be useful for those who always want to be aware of the current situation on the account.
- More useful indicators
The indicator displays data such as profit in points, percentage and currency, as well as the spread for the current pair and the time until the bar closes on the current timeframe. There are several options for placing the information line on the chart: - To the right of the price (runs behind the price); - As a comment (in the upper left corner
FREE

This multi indicator/oscillator (hereafter indicator), multi time frame and multi symbol indicator identifies when a divergence occurs between price and one, two or three indicators. It identifies both regular/classical (trend reversal) and hidden (trend continuation) divergences. It has RSI and MA trend filter options which makes it possible to filter out only the strongest setups. Combined with your own rules and techniques, this indicator will allow you to create (or enhance) your own powerfu

MT4 versiyonu | FAQ | EA Universal Breakout Universal Box , daha sonra bir fiyat aralığı kırılmasıyla işlem yapmak için kullanılabilecek fiyat aralıklarını grafikte çizer. Bu göstergeyi uygulayabileceğiniz birçok strateji vardır. Gösterge varsayılan olarak grafikte Asya, Avrupa ve Amerika ticaret seansı aralıklarını işaretleyecek şekilde ayarlanmıştır. Aralıklar, sınırları işlem seansının başlangıç ve bitiş zamanı ve o dönem için maksimum ve minimum fiyat seviyeleri olan dikdörtg
FREE

Grafiklerinize manuel olarak Fibonacci seviyeleri çizmekten sıkıldınız mı? Ticaretinizdeki temel destek ve direnç seviyelerini belirlemenin uygun ve etkili bir yolunu mu arıyorsunuz? Başka yerde arama! Otomatik fibonacci seviyeleri yapan nihai MetaTrader 5 göstergesi olan DrawFib Pro ile tanışın grafikleriniz üzerinde çizim yapar ve bu seviyeler aşıldığında zamanında uyarılar sağlar. DrawFib Pro ile ticaret stratejilerinizi geliştirebilir, zamandan tasarruf edebilir ve daha bilinçli
FREE

Marley Göstergesi: MT4 ve MT5'te Kesin İşlemler Hem MT4 hem de MT5'te olağanüstü sinyal doğruluğu için tasarlanan Marley Göstergesi ile işlemlerinizi iyileştirin. Bu çok yönlü araç, kripto para ve forex piyasaları için optimize edilmiş olup, işlem stratejinize kesinlik ve esneklik kazandırır. MT4 ile Sorunsuz Entegrasyon: MT4 platform kullanıcıları için, Marley Göstergesi tamamen uyumlu ve buradan erişilebilir. Kripto Para ve Forex Piyasaları için Optimizasyon: Kripto Para Üstünlüğü : Dina

To get access to MT4 version please click here . This is the exact conversion from TradingView: "SwingArm ATR Trend Indicator" by " vsnfnd ". Also known as : "Blackflag FTS" by "Jose Azcarate" This is a light-load processing and non-repaint indicator. All input options are available except multi time frame. Buffers are available for processing in EAs. Extra option to show buy and sell signal alerts. You can message in private chat for further changes you need.

This is diamond!
Diamond Pattern is based on Read The Market(RTM) concepts. The purpose of this model is to face the big players of the market (financial institutions and banks), As you know in financial markets, big traders try to fool small traders, but RTM prevent traders from getting trapped. This style is formed in terms of price candles and presented according to market supply and demand areas and no price oscillator is used in it. RTM concepts are very suitable for all kinds of inves

The indicator measures the accumulated balance of aggression.
The formula is as follows: Accumulated = Previous Candle Accumulated + Purchase Volume - Sales Volume. Know our products
*** Did you like the product? Then, help us doing review in the " Reviews " tab.
The indicator sends information to your email or cell phone when the accumulated balance changes direction. Example : Accumulated seller becomes a buyer.
Note : It is recommended to use the default configuration and VPS

The Ai Trend Spotter (D Originals). The Downfall of Forex.
We often ask " How do Brokerage make money ? ", and we celebrate any little wining trades on our end. But after using (D Originals) you will ask yourself " How did I became rich overnight ? ". So Deep, Action speaks louder than voice. With the Ai Trend Spotter, don't be afraid of: *Market Manipulation *Market Reversal * Sniper Entry and Exist *Candle Jump The indicator is for every Pair tradable on MT5 platform, is a 3 years proj
FREE Heiken Ashi Smoothed indicator is fully adjustable, easy to use and comes with possibility to access the indicator via iCustom function so you can use it in your own trading software. Indicator can also pop up alerts when signal changes or send push notifications. For Metatrader 4 version click here: https://www.mql5.com/en/market/product/70824 For detailed information click: >>HERE<< Features
Easy to use Accessible via iCustom Fully adjustable Alerts and Push notifications Possi
FREE

Bu, zirveleri ve dipleri değerlendirmek için net bir göstergedir ve Salınımlı piyasa için iyi çalışır.
Promosyon fiyatı 49$ → 59$
özellikler üstleri ve dipleri yargılamada iyi Yeniden çizme yok, sürüklenme yok Hızlı hesaplama, gecikme yok Zengin hatırlatma modu Birden fazla parametre ve renk ayarlanabilir
parametre "======== Ana ========" YüksekDüşükDönem1 = 9 YüksekDüşükPeriyod2 = 60 YüksekDüşükPeriyod3 = 34 YüksekDüşükEMAPeriyodu = 4 MASignalPeriod = 5 "======== Bildir ========" UseAler

check out Megaclasic Spikes Robot here: https://www.mql5.com/en/market/product/109140 https://www.mql5.com/en/market/product/109140
MEGASPIKES BOOM AND CRASH v1.32 NB: source codes of this indicator are available: PM me: https://t.me/Machofx PLEASE JOIN THE CHANNEL BELOW TO HAVE ACCESS TO ALL PREVIOUS VERSIONS check out Spikes robot
BoomCrash Cheatcode EA : https://www.mql5.com/en/market/product/103365 https://t.me/machofxprotradin g Note: PLEASE THE NEW VERSION 1.32 OF THE SPIKES
FREE

This indicator shows Fractal Breakout Trendlines and Support and Resistance
The Fractal Ascending Trendline and Fractal Descending Trendline are drawn from the last valid fractals. Breakouts can be taken above or below these trendlines. Horizontal lines are drawn from the Last upper and Last lower fractal to show support and resistance levels. Horizontal Upper and Lower Intersection lines are drawn where a fractal trendline has been last intersected, to show where to place a buy or sell orde
FREE
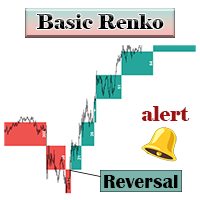
Temel Renko göstergesi ana grafikteki Renko kutularını gösterir.
MT4 Sürümü
Avantajı, hem ana grafiğe hem de Renko grafiğine aynı anda erişebilmenizdir. Ayrıca her Renko kutusunu oluşturmak için kaç çubuk gerektiğini de öğrenebilirsiniz.
Bir geri dönüş meydana geldiğinde gösterge, açılır pencere, anlık uyarı ve e-posta uyarılarıyla sizi bilgilendirecektir.
Bu göstergenin karmaşık ayarları yoktur ve yeni başlayanlar ve profesyoneller bunu stratejilerinde rahatlıkla kullanabilirler.
G
FREE

Trend Master Chart ihtiyacınız olan trend göstergesidir. Grafiği kaplar ve farklı pazar trendlerini/hareketlerini tanımlamak için renk kodlamasını kullanır. İki hareketli ortalamayı ve farklı osilatörleri birleştiren bir algoritma kullanır. Bu üç elementin periyotları değiştirilebilir. Herhangi bir zaman diliminde ve herhangi bir Çiftte çalışır.
Bir bakışta yükseliş veya düşüş trendini ve bu trende farklı giriş noktalarını tespit edebileceksiniz. Örneğin, belirgin bir yükseliş eğilimi sırasın
FREE

Fractal MA is an indicator to hunt trends and scalp on h1 m30 m15 m5 and m1 works very well for synthetic indices and forex, in eur/usd, usd/jpy pairs, in synthetic indices in Range break 100, boom pairs 300, crash 300, boom 500 and crash 500, volatility 75, it is also programmed to hunt rebounds in m5, it has a profit percentage of 80% You can also trade in the 28 currency pairs

For MT4 version please click here . This is the exact conversion from TradingView: "Range Filter 5min" By "guikroth". - This indicator implements Alerts as well as the visualizations. - Input tab allows to choose Heiken Ashi or Normal candles to apply the filter to. It means it is a (2 in 1) indicator. - This indicator lets you read the buffers for all data on the window. For details on buffers please message me. - This is a non-repaint and light processing load indicator. - You can message in p

Level 2 Book Visualization Indicator Our innovative indicator seamlessly integrates Level 2 order book data onto your trading chart, offering a real-time view of market depth and the dynamics of supply and demand. With its two key features, you can enhance your market analysis and make more informed trading decisions: Biggest Volume Highlight: This input allows traders to instantly identify the price levels with the largest order lots. By highlighting the heaviest concentration of buy or sell or
FREE

This is the forex visual orders tool & forex position size (lot) calculator with intuitive panel. Risk Reward Ratio Indicator works on all kind of symbols: currency pairs, indices, metals, commodities, cryptocurrencies, etc.
If you want to make sure that Risk Reward Ratio Indicator works on your favorite symbols contact us ( visit our profile ) and ask for 7-day free trial to test this tool without limits. If you want to place orders easier, faster and more intuitive? If you like to mark tr

The CAP Channel Trading is a volatility-based indicator that makes use of the “advanced envelope theory”. These envelopes consist of two outer lines. Envelope theory states that the market price will generally fall between the boundaries of the envelope (or channel). If prices move outside the envelope, it is a trading signal or trading opportunity.
Benefits of the Channel Trading Indicator CAP Channel Trading works with any asset
It can be applied to any financial assets: forex, cryptoc
FREE

Classic MACD
It has MACD line, Signal line, and Histogram . The Histogram has 4 colors , showing its movement direction as simple as possible. The smoothing factor in the input helps to eliminate noisy signals. Besides different price types (hlc, hlcc, ohlc, ...), there is an option to use volume data as the source for MACD calculations (which is better to be used by real volume not unreliable tick volume). While the original MACD indicator uses Exponential Moving Average, this indicator provid
FREE

Bu projeyi seviyorsanız, 5 yıldız incelemesi bırakın. instagram'da izleyin: borelatech Bu gösterge açık, yüksek, düşük ve belirtilen fiyatlar için çizer
Dönem ve belirli bir zaman bölgesi için ayarlanabilir. Bunlar birçok kurumsal ve profesyonel tarafından görünen önemli seviyelerdir.
tüccarlar ve daha fazla olabileceği yerleri bilmeniz için yararlı olabilir
Aktif. Mevcut dönemler şunlardır: Önceki gün. Önceki Hafta. Önceki Ay. Previous Quarter. Önceki yıl. Veya: Mevcut gün. Hafta. Şimdi Ay.
FREE

Create and trade timeframes in seconds. The bar time duration is freely adjustable from 1 second and up. The chart is accurately constructed using real ticks from the broker's server. Main characteristics The indicator is an overlay on the main chart, making it possible to utilize one-click trading and on-chart order manipulation. History calculated using real tick data. Built-in technical studies: 4 moving averages (Simple, Exponential, Smooth, Linear-weighted, Volume-weighted using tick or rea

Fiyat Dalga Modeli MT5 --(ABCD Modeli)-- hoş geldiniz ABCD modeli, teknik analiz dünyasında güçlü ve yaygın olarak kullanılan bir ticaret modelidir.
Tüccarların piyasadaki potansiyel alım ve satım fırsatlarını belirlemek için kullandıkları uyumlu bir fiyat modelidir.
ABCD modeliyle, tüccarlar potansiyel fiyat hareketlerini tahmin edebilir ve alım satımlara ne zaman girip çıkacakları konusunda bilinçli kararlar verebilir. EA Sürümü: Price Wave EA MT5
MT4 Sürümü : Price Wave Pattern
FREE

This is the latest iteration of my famous indicator, Reversal Fractals, published for the first time almost a decade ago. It examines the price structure of fractals to determine possible reversal points in the market, providing timing to positional traders that already have a fundamental or technical valuation model. [ Installation Guide | Update Guide | Troubleshooting | FAQ | All Products ] Reversal fractals can start long trends The indicator is non repainting
It implements alerts of all k
FREE

** All Symbols x All Timeframes scan just by pressing scanner button ** *** Contact me after the purchase to send you instructions and add you in "ABCD scanner group" for sharing or seeing experiences with other users. Introduction This indicator scans AB=CD retracement patterns in all charts. The ABCD is the basic foundation for all harmonic patterns and highly repetitive with a high success rate . The ABCD Scanner indicator is a scanner reversal ABCD pattern that helps you identify when the pr

Setup Tabajara, "The OGRO of Wall Street" olarak bilinen Brezilyalı bir tüccar tarafından oluşturuldu.
Bu kurulumun fikri, tüccara fiyatların mevcut eğilimini ve grafikte aranması gereken işlem türünü belirtmektir.
Operasyon Bunu, mumları ve VWAP'yi saat 10:40'a kadar ve sonrasında 20 periyodun aritmetik ortalaması ile mumları 4 olası renkte boyayarak konumlandırarak yapar: Yeşil -> Yükselen trendde yükselen fiyat (SATIN ALMA için giriş noktalarını arayın) Siyah -> Boğa Trendinde fiyat düze
FREE

The KT HalfTrend is a moving average-based trend indicator that draws zones. It marks a trend shift by drawing bearish and bullish invalidation zones on the chart. It also displays the trend buy-sell strength with arrows on the main chart. The indicator will be flat if no trend indicates accumulation, temporary price, or distribution zones. If there is a trend, there will be a slope in that direction. The trend signals are substantial if the slope is steep, either to the upside or the downside.
MetaTrader Mağaza, geçmiş verilerini kullanarak test ve optimizasyon için ticaret robotunun ücretsiz demosunu indirebileceğiniz tek mağazadır.
Uygulamaya genel bakışı ve diğer müşterilerin incelemelerini okuyun, doğrudan terminalinize indirin ve satın almadan önce ticaret robotunu test edin. Yalnızca MetaTrader Mağazada bir uygulamayı tamamen ücretsiz olarak test edebilirsiniz.
Ticaret fırsatlarını kaçırıyorsunuz:
- Ücretsiz ticaret uygulamaları
- İşlem kopyalama için 8.000'den fazla sinyal
- Finansal piyasaları keşfetmek için ekonomik haberler
Kayıt
Giriş yap
Gizlilik ve Veri Koruma Politikasını ve MQL5.com Kullanım Şartlarını kabul edersiniz
Hesabınız yoksa, lütfen kaydolun
MQL5.com web sitesine giriş yapmak için çerezlerin kullanımına izin vermelisiniz.
Lütfen tarayıcınızda gerekli ayarı etkinleştirin, aksi takdirde giriş yapamazsınız.