 Tüm siparişler
 Kurallar
İş tamamlandı

Şartname
This indicator consist of Dashboard & Chart indicators visualisation.
Dashboard (Always at top right)
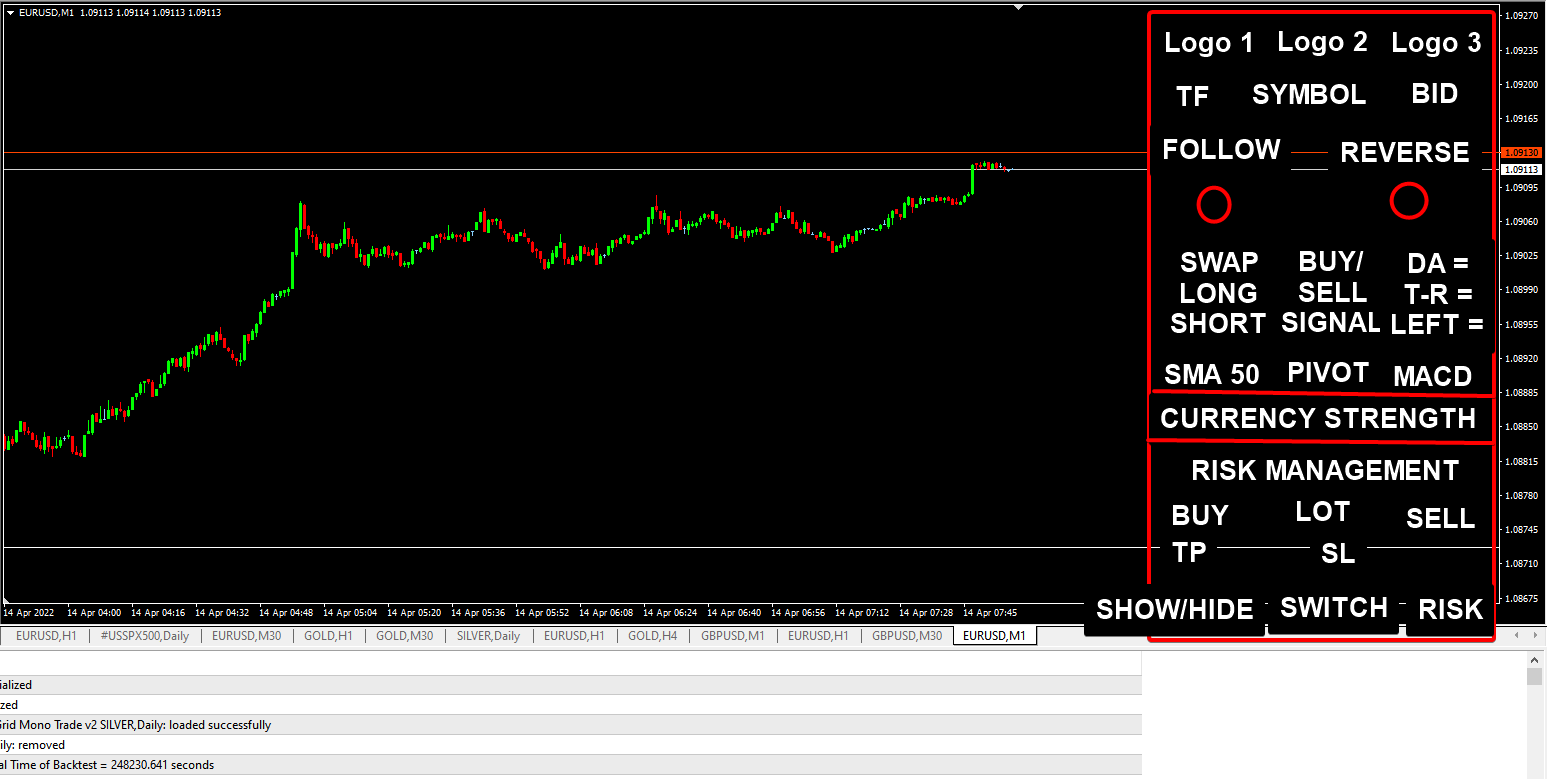
The dashboard is arranged in (Top to bottom)
- Our group logo in horizontal (send seperately in chat)
- Timeframe, Symbol, Current Bid price (left to right arrangement)
- (Left side) Follow Trendwith a circle dot below
- Dot become Lime when (1)
- Bid > Pivot Price (Previous Daily candle (H + L + C)/3
- Bid > SMA 50
- MACD > 0
- MACD Signal > 0
- Dot become Lime when (2)
- Bid < Pivot Price (Previous Daily candle (H + L + C)/3
- Bid < SMA 50
- MACD < 0
- MACD Signal < 0
- Dot is Grey when either (1) or (2) signal above is false
- When the signal changes color (switching from any signal above), it will show a pop-up alert. To avoid "spam" alert, the alert only occurs once every 5 min (Adjustable).
- (Right side) Reversing with a circle dot below
- Dot is Maroon when (1)
- (Today High - Low) > Daily Range (Last candle's Daily ATR 21)
- Dot is Red when (2)
- (Today High - Low) > Pivot + ( Previous Daily candle (H - L) ) * 2.618
- (Today High - Low) < Pivot - ( Previous Daily candle (H - L) ) * 2.618
- If (1) or (2) conditions reached, Follow Trend dot above should always in Grey
- If (1) or (2) signal is false, dot is in Grey
- When the signal changes color (switching from any signal above), it will show a pop-up alert. To avoid "spam" alert, the alert only occurs once every 5 min (Adjustable).
- Swap (Left)
- Long Swap (MediumSeaGreen) with 2 decimals
- Short Swap (Red) with 2 decimals
- Buy / Sell Signal (Middle)
- Display BUY with Lime when
- Bid > Pivot Price (Previous Daily candle (H + L + C)/3
- Bid > SMA 50
- MACD > 0
- MACD Signal > 0
- Display SELL with Red when
- Bid < Pivot Price (Previous Daily candle (H + L + C)/3
- Bid < SMA 50
- MACD < 0
- MACD Signal < 0
- Range
- DA = _____ (Value = Last candle's Daily ATR 21 in point with 0 decimal)
- T-R = _____ (Value = Today High - Low in point with 0 decimal)
- Left = _____ (Value = (DA-T-R) / DA * 100%) ** Note: Value should not be in negative)
- Signals
- SMA (with buy / sell signal below)
- BUY = Bid > SMA 50
- SELL = Bid < SMA 50
- PIVOT (with buy / sell signal below)
- BUY = Bid > Pivot
- SELL = Bid < Pivot
- MACD (with buy / sell signal below)
- BUY = MACD > 0 AND MACD Signal > 0
- SELL = MACD < 0 AND MACD Signal < 0
- Currency Meter
- Conventional currency strength meter
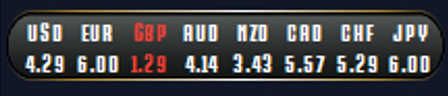
- Label
- Lime = Value >= 7
- Red = Value <= 2
- Risk Management
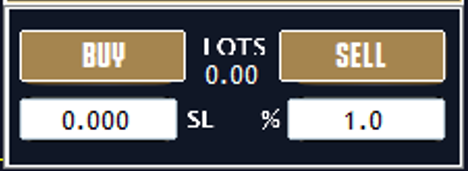
- Buy Lots Sell (Button) **Note: Need to be functional in backtesting by checking the button state
- TP SL Column (Display & Can key in value)
- % is the Equity risk per trade (and hence used to calculate the lots size) - **Note have to consider different market tick value on risk calculation (Forex, stock, crypto etc.)
- The above risk management work together with drag and drop trades line (like the example Trade Panel below)
- https://www.mql5.com/en/market/product/23415?source=Site+Market+MT5+Search+Rating006%3apanel
- It will show current buy price lines with TP and SL. User can interact with the TPSL to modify it directly and the lot size will automatically calculate based on the risk %
- Put 1 more buttonto switch buy trade to sell trade
- Alternatively, user can drag the TP / SL to the another side to automatically switch from buy to sell (or vice versa)
- Note: Only Instant order is required. No need code for pending order.
- 1 more buttonto show / hide the lines on the chart
- Color and design can follow same like the product example
- Note: Buy / Sell Button need to be functionable even in backtest and live market
Indicators Visualisation (on price chart)
All Drawing should display for more than 5000 candlesticks (or until full bars is drawn - which ever posible)
It will be better if can directly plug in the indicators directly to save the computing power
- Moving Average lines
- SMA 10 = White dash width 1
- SMA 20 = Gold dash width 1
- SMA 50 = Yellow solid width
- Note: Avoid redraw for historical lines (to avoid use too much resources)
- Pivot and SnR
- Pivot line = (Previous Daily candle (H + L + C)/3 + Yellow dash with lable below the line at center of the chart screen
- SnR 3 = Pivot +- ( Previous Daily candle (H - L) ) * 1.000 + White dash with lable below the line at center of the chart screen
- SnR 4 = Pivot +- ( Previous Daily candle (H - L) ) * 1.618 + White dash with lable below the line at center of the chart screen
- SnR 5 = Pivot +- ( Previous Daily candle (H - L) ) * 2.618 + White dash with lable below the line at center of the chart screen
- SnR 6 = Pivot +- ( Previous Daily candle (H - L) ) * 4.236 + White dash with lable below the line at center of the chart screen
- Time zone **Note: Only Display for past 20 days
- Asia
- Green box lable high to low of the zone
- London
- Blue box lable high to low of the zone
- New York
- Red box lable high to low of the zone
- Note: Only Display if the current Timeframe is <= H1
- Note: Future market no need to plot
Clean and Readable source code is needed by the end of project.
Developers that send previous dashboard project (with nice buttons and drawings) will be prioritised.
Please do send me screenshot of past projects you completed so I know more about your experience.
PS: More information will conveyed in the chatbox as well as throughout entire project. Relevant resource will provide to you.