Bir alım-satım robotunun nasıl sipariş edileceğini izleyin
Bir sipariş vermeden veya bir siparişe başvurmadan önce kuralları okuyun
MQL5 ve MQL4'teki bir alım-satım robotu nasıl sipariş edilir?
Bir robot sipariş etmek için örnek İş Gerekliliklerine bakın
Kategorideki yeni siparişler:
30 - 40 USD
30+ USD
40+ USD
200 - 500 USD
İş tamamlandı
Tamamlanma süresi: 2 gün
Müşteri tarafından geri bildirim
He provided a sample before I accepted this job. There was timely communication despite the large time zone difference. Indicator was built according to specs. Pleased to work with you.
Geliştirici tarafından geri bildirim
Great customer, smooth to work with, clear specs, recommended+
İş Gereklilikleri
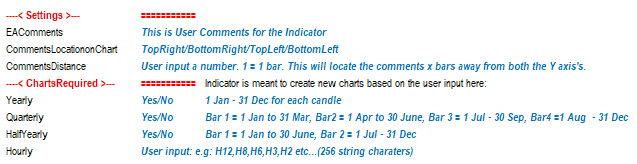
This is a request to build an indicator that creates offline charts for
- Yearly candles
- Half yearly
- Quarterly
- Hourly
Please see attached field list and formula to apply for yearly, half yearly and quarterly.
An obvious problem to building this Indicator is the MT4 data quality. Please clarify how will this be addressed.
It would be best that the applicant developer has had previous experience in building offline charts.
Yanıtlandı
1
Derecelendirme
Projeler
97
35%
Arabuluculuk
11
27%
/
45%
Süresi dolmuş
13
13%
Serbest
2
Derecelendirme
Projeler
280
55%
Arabuluculuk
0
Süresi dolmuş
5
2%
Serbest
Benzer siparişler
Convert Time Range Breakout Indicator to Strategy (Pine Script) I have an existing Time Range Breakout indicator on TradingView. I need a developer to convert it into a fully functional strategy with proper trade execution logic. Strategy Logic: Time Range: Define a specific time range (e.g., 03:00 – 04:30) During this time, the indicator marks the High and Low range Entry Conditions Buy when price touches the range
Hello, I’m looking for an experienced MQL4 developer to build a custom MT4 Expert Advisor based on a Koncorde-style indicator strategy. Here are the main requirements: 🔹 General Overview The EA must be a master EA , running on a single chart and managing multiple currency pairs simultaneously No need to attach EA to each chart Must support a configurable list of symbols 🔹 Indicator Requirement Develop a custom
Looking for special EMA cross EA
30+ USD
I want to find a Developer to perform this work and settle payments in this Application. I undertake not to communicate with Applicants anywhere else except this Application, including third-party
Hi guys I’m looking for a coder who’s experienced in one script. The candidate must be familiar with fractals and self similarity. If you can’t code self similarity, please don’t bother contacting me ( respectfully). I just don’t want us to waste each others time. My budget is 100$. If that’s too low for you please, don’t contact me. Only contact me if you can code self similarity and can accept 100$. I will provide
I hope to acquire a profitable and existing expert advisor (EA) from the gold market, with complete source code, to add to our client portfolio. you can WECHAT: Faca7898 Please note EA when adding friends. It should be clarified that this does not require you to formulate or design new strategies. If you already have a verified, consistent, and production-ready EA, I am willing to purchase it immediately and engage
Core Requirements: Platform: MetaTrader 5 (MT5). Symbol: XAUUSD (Gold). Timeframes: M1 and M5 (user selectable). Trading Style: Scalping with controlled risk (not aggressive or high-risk strategies) -> adjustable, even better. Execution: Fast execution, optimized for gold market conditions. Frequence = adjustable, but there should be 10-20 trades per day. Strategy Logic: Use a reliable and conservative strategy
MT4 TMA Reference
30+ USD
Eu preciso disso. A linha central do TMA (17,5,1.5) será a principal referência. Outra linha de média móvel (AVG) de 3 períodos decrescentes 2. As ordens serão as seguintes: abaixo, somente compra de TMA; acima, somente venda de TMA. O sinal de entrada será o seguinte: se o preço estiver acima da Média Móvel Tarifária (TMA), será apenas para venda; quando o preço se mantiver abaixo da Média Móvel Tarifária (AVG)
Non-repainting Indicator for scalping Gold / Xauusd
30 - 200 USD
I am looking for non-repainting indicator to run in all sessions for scalping gold , happy to discuss if you have developed such indicators which can show profit and stop loss levels
Hello! I want to buy two indicators: A Support and Resistence Indicator and a Trendline Indicator. Support and Resistence Indicators needs to automatically draws Support and Resistance lines based on High and Low Candle in every time-frame (If possible time-frame needs to be in inputs and choose by me what time-frame i want indicator to draw lines) Trendline Indicator needs to automatically draws Trendline Channels
I need an experienced developer to carry out an indicator and trading robot using the following; moving averages risk ( take profit and stop loss) and maximum drawdown limits heiken ashi confirmation. trendline breakout if possible The developer will test this on a demo account that I will provide before conclusion as I don’t want anyone to waste my time trying to use chartgpt trial and error. If you can do the
Proje bilgisi
Bütçe
30+ USD