Tüm siparişler
 Kurallar
İş tamamlandı
Şartname
I want an INDICATOR using the Ichimoku clouds conversion and base line and a Moving Average.
I want to be able to change those three settings. I want it to work on more than one chart at one time.
I want it to work on any time frame. It must be an Indicator because it will be ran with a trail stop EA.
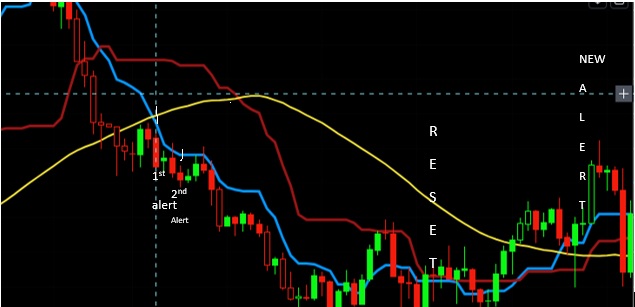
Down trend: when the MA (yellow) is above conversion line (blue), and the base line (red) is above the conversion line (blue) and the first bear candle (red) closes under all the lines and the candle is not touching them. When all these things are true I want a Sell Signal(photo 3) to show below the candle and an alert to my phone and on screen. I want an alert when It happens a second time also. I want the first alert to show a 1 on the chart and the risk to reward ratio background behind the candle (shown in the 3rd photo). I want the second alert to show a 2 without the ratio drawing
After the second alert, I don’t want another one until the candle closes above the base line
SEE PHOTO ONE ATTACHED
-------------------------------------------------------
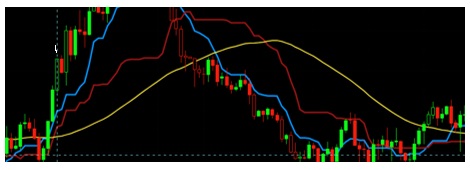
Uptrend: when the Ma (yellow) is below the conversion line (blue) and the base line (red) is below the conversion line (blue) and a bull candle (green) closes above all of the lines without touching any
When all of these things are true I want the first alert to show a 1 on the chart and the risk to reward background behind the candle (shown in the last photo). I want the second alert to show a 2 without the ratio drawing
and an alert sent to my phone and on screen
After the second alert I don’t want another one until a candle closes under the baseline (red) line
SEE PHOTO 2 ATTACHED
------------------------------------------------------------------
I want all of the past alerts to stay on the screen.
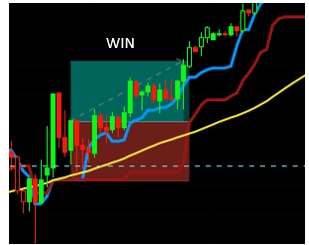
For every candle that sends an alert (past and present) I want to see an entry line, stop loss line and tp line as shown in the third photo.
When tp is hit I want it to say win, when Stop loss is hit I want it to say lose. Maybe it can look something like photo 3. I want it to stretch until SL OR TP is hit. But only for the first alert.
SEE PHOTO 3 ATTACHED
---------------------------------------------------------
for the risk to reward ration background signal (photo3)
I want to be able to Set stoploss at (x) points from entry
Set Take Profit at (x) points from entry
I want Statistics to be shown on the screen for ALERT 1. (x) wins, (x)losses, (x) most wins in a row in (y) time frame, (x)most losses in a row in (y) time frame.
Y could equal 1 day, 14 days, 60 days ect...