İş tamamlandı
Şartname
Indicator representing the number of pips per each bar that indicates the range amplitude in pips against the last maximum or minimum
The
idea of the indicator
First identify max and min values in the bars (eg. You can do that using a zig zag indicator).
The indicator is
aimed to understand what is the maximum distance in terms of pips from the last maximum without a sensible retracement.
When the indicator
reaches a certain threshold of retracement given as input parameter than it is reset.
From the last maximum point
Per each subsequent bar the indicator represents two graphs (only positive bars):
- Graph 1: the highest distance in pips of the bar from the previous identified maximum
- Graph 2: the % of the distance reached by the current bar compared to the total pips of the distance from the maximum and the last minimum
Example:
If the last maximum is 1.23100, subsequent last minimum is 1.20000, current bar maximum point reaches 1.22000 then the
indicator represents 2 graphs:
- A positive bar of length 1.100 (pips) = 1.23100 – 1.22000
- A percentage of 35,5% = 1.100 / (1.23100 – 1.20000)
Please consider that the Zig Zag indicator should be visibile on the main graph
Reset of the indicator
There
is a threshold to be introduced as an input parameter for the indicator that represents the % of reset (to be compared with the graph 2): let’s
call it “K”
If (current bar maximum - last minimum) (last maximum – last minumum) = K then the indicator is reset.
In
the previous example:
K = 35%
If the last maximum is 1.23100, subsequent last minimum is 1.20000, current bar maximum point reaches
1.22000 then the indicator represents 2 graphs:
A positive bar of length 1.100 (pips) = 1.23100 – 1.22000
A percentage of
35,5% = 1.100 / (1.23100 – 1.20000)
Then the indicator is reset since it reached the threshold of 35%.
If K = 100% then
the current bar maximum should reach the last maximum point (1.23100) in order for the indicator to reset.
From the last minimum
point
The indicator behaves the same behavior of the maximum but at the opposite (painting only negative bars)
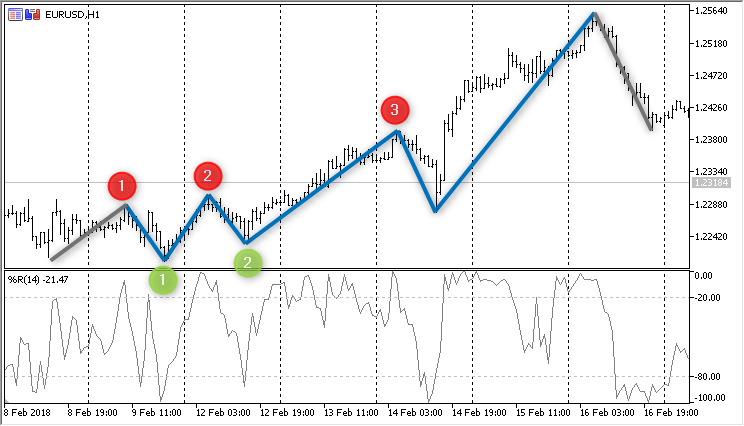
- Point 1 red is identified as maximum
- Point 1 green is identified as subsequent minimum
- From point 1 green and point 2 red: the indicator shows 2 graphs
- One graph represents bars each one showing the minimum distance from the point 1 red (ie. The current bar maximum – the last maximum)
- One graph represents the % of minimum distance of the current bar (ie. Max of current bar versus the last macimum) compared to the
total range identified from the distance between point 1 green and point 1 red
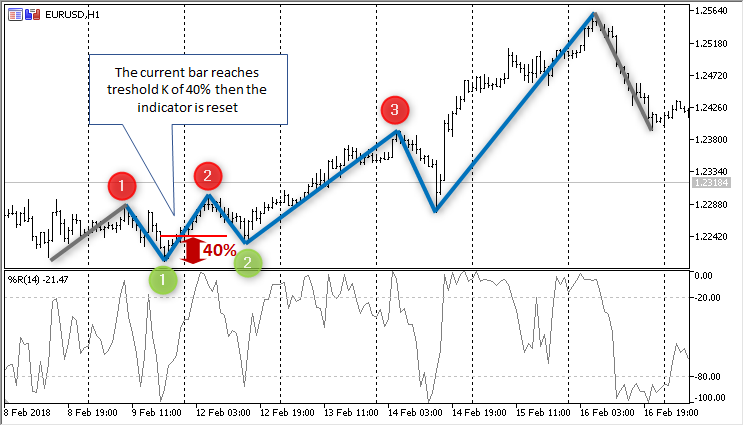
If the K threshold is set to 40% then the indicator is reset
Configuration panel
The panel should include:
The configuration parameters of the underlying zig zag indicator
The
threshold K level to reset the indicator (ranging from 0% - 100%)