Alım-satım robotlarını ücretsiz olarak nasıl indirebileceğinizi izleyin
Bizi Facebook üzerinde bulun!
Fan sayfamıza katılın
Kodu ilginç mi buldunuz?
Öyleyse bir link gönderin -
başkalarının da faydalanmasını sağlayın
Kodu beğendiniz mi? MetaTrader 5 terminalinde deneyin
Göstergeler

GDS Renko Liquidity Sweep Lab - MetaTrader 5 için gösterge

Andrey Goida
Andrey Goida
MT5 developer focused on XAUUSD, Renko tools, and structured trading systems.
Building practical indicators, panels, and research-driven solutions for traders who value clarity, logic, and disciplined execution.
Görüntülemeler:
145
Derecelendirme:
(3)
Yayınlandı:
MQL5 Freelance Bu koda dayalı bir robota veya göstergeye mi ihtiyacınız var? Freelance üzerinden sipariş edin Freelance'e git
GDS Renko Liquidity Sweep Lab2


GDS Renko Liquidity Sweep Lab


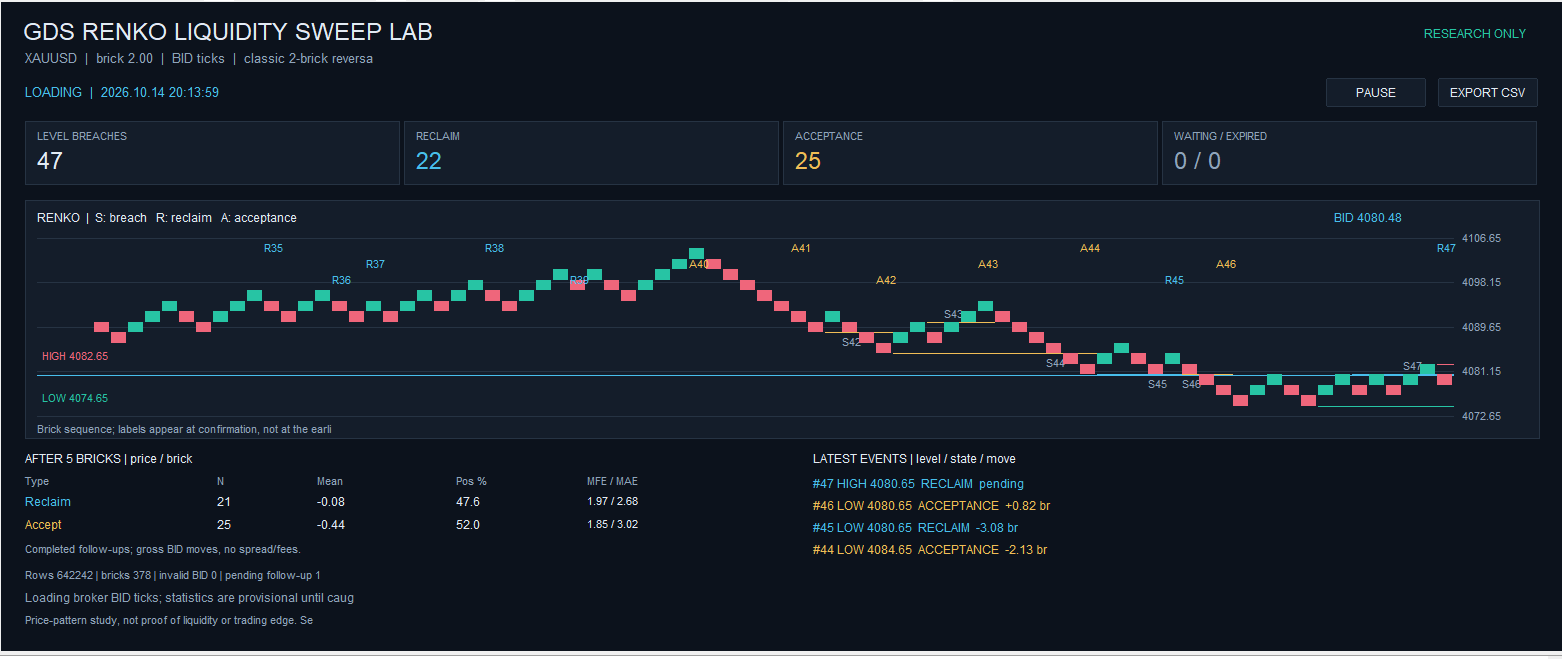
The indicator builds classic fixed-size Renko from broker BID ticks and

distinguishes three stages: a level breach, a confirmed return inside the
level (reclaim), and consecutive completed closes outside it (acceptance).
It displays the levels and events on a Renko dashboard, compares subsequent
price movement, and exports the full event log to CSV.

How it works
The end of a completed run becomes a swing level only when a reversal brick
confirms it. The first incomplete run at the history boundary is excluded.
The most recent confirmed upper and lower levels are monitored. Each level
can produce one breach event; later swings replace older unbreached levels.

Reclaim and acceptance are evaluated on later real ticks, after all bricks
produced by that tick have been processed. The price of a synthetic brick
inside a price gap is never treated as an executable quote. A classification
deadline prevents an old unresolved event from waiting indefinitely in brick
time. Unclassified and expired events remain in the export.

The dashboard measures directional BID movement after a selected number of
additional completed bricks. It also shows the completed sample count,
the percentage of positive price changes, and average MFE/MAE in brick units.
These are price statistics, not simulated trade returns or a trading win rate.
Overlapping events are not independent observations.

Use
Attach the indicator to a separate normal chart and wait for the tick history
to load. Set Brick Size in price units; zero selects 200 symbol points.
Start=0 loads the selected number of hours before the latest broker quote
and continues with incoming ticks. A nonzero server-time start selects a
fixed historical interval with the same duration.

PAUSE / RESUME keeps the processing cursor. EXPORT CSV writes the event log
to MQL5/Files/GDS_Renko_Sweep_Lab. Each file includes inputs, effective price
buffers, timestamps and tick sequence numbers. The dashboard requires a
chart area of at least 760 x 520 pixels. Inputs are available through Ctrl+I.

No orders, DLL, external indicator, custom symbol or offline chart is used.
The original chart visibility and background are restored when the indicator
is removed. Only the indicator's own chart objects are deleted.

The word liquidity describes a price-pattern hypothesis. The indicator does
not observe hidden stop orders or measure actual order-book liquidity.
History availability depends on the broker; missing ticks are not reconstructed
from OHLC. Price statistics do not include spread, fees or slippage.
The historical result is not evidence of a persistent trading edge and is not
a promise of future profitability.

Suggested screenshots after native testing:
1. Full Renko dashboard with a visible breached level and R/A classification.
2. Close-up of both outcome groups and their sample counts.
Use actual MT5 output. No synthetic test picture should illustrate performance.
Enhanced Spread Monitor Enhanced Spread Monitor

Spread Monitor is a simple information indicator for MetaTrader 5. It displays the current spread in pips in the form of a compact graphical panel with colour-coded indicators and a level bar.

MACrossoverEA MACrossoverEA

The advisor opens trades when two moving averages (Fast and Slow) cross. It works on any instrument and timeframe.

Fair Value Gaps (FVG) - unfilled imbalance zones with fill tracking and alerts Fair Value Gaps (FVG) - unfilled imbalance zones with fill tracking and alerts

Draws the fair value gaps (three-candle imbalances) that price has not filled yet, follows how much of each gap is filled and ends the box when it is. Closed candles only, no repaint. Alerts and buffers for EAs.

Market Structure BOS and CHoCH - swing points HH / HL / LH / LL, no repaint, alerts Market Structure BOS and CHoCH - swing points HH / HL / LH / LL, no repaint, alerts

Market structure in the way of Smart Money Concepts: swing highs and lows with HH / HL / LH / LL labels, BOS (break of structure) and CHoCH (change of character) lines. Swings count only after their right candles close, so nothing repaints. Alerts and a trend buffer for EAs.